MEMBERS ONLY
Use ChartStyles to Stop All the Clicking!
Hello Fellow ChartWatchers!
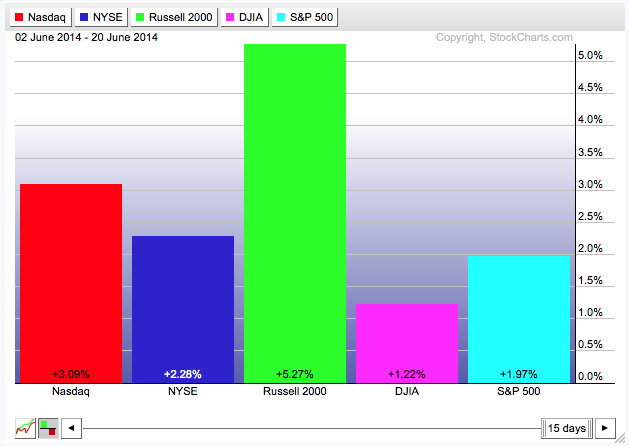
Small Caps have been on a tear recently - have you noticed? This week all the major market averages moved higher with the Russell 2000 Small Caps (+1.85%) leading the way. The same is true for the month of June so far with the Russell up...
READ MORE
MEMBERS ONLY
Energy and Metals Lead Commodity Rally

by John Murphy,
Chief Technical Analyst, StockCharts.com
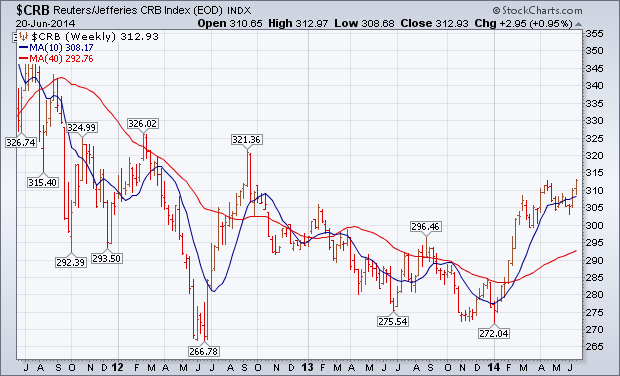
The weekly bars in Chart 1 show the Reuters/Jefferies CRB Index closing at the highest level since the third quarter of 2012. [The CRB Index includes 19 commodities that are traded on exchanges in the U.S. and U.K.]. Commodity prices turned up during the first quarter of...
READ MORE
MEMBERS ONLY
Industrial Suppliers Waiting Their Turn?

by Tom Bowley,
Chief Market Strategist, EarningsBeats.com
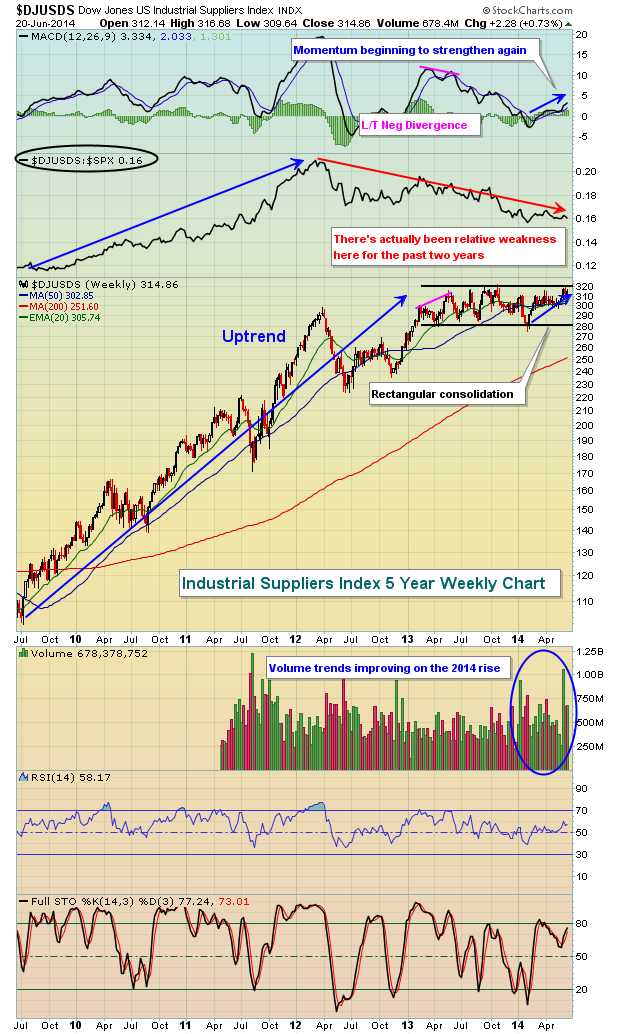
The Dow Jones US Industrial Suppliers Index ($DJUSDS) experienced a HUGE bull market run off the 2009 lows through mid-2013, quadrupling in value during the period. Momentum on the weekly chart turned negative, as evidenced by the long-term negative divergence on its MACD. As a result, this index has gone...
READ MORE
MEMBERS ONLY

ENERGY AND METALS LEAD COMMODITIES TO NEW 2014 HIGH -- FOREX FUNDS FLOW INTO BRITAIN AND CANADA -- WISDOMTREE JAPAN HEDGED EQUITY FUND NEARS UPSIDE BREAKOUT ON WEAKER YEN -- NISSAN AND TOYOTA HELP LEAD STRONG AUTO GROUP
by John Murphy,
Chief Technical Analyst, StockCharts.com
ENERGY AND METALS LEAD COMMODITY RALLY... The weekly bars in Chart 2 show the Reuters/Jefferies CRB Index closing at the highest level since the third quarter of 2012. [The CRB Index includes 19 commodities that are traded on exchanges in the U.S. and U.K.]. Commodity prices turned...
READ MORE
MEMBERS ONLY
Eight of Nine Sector SPDRs Hit New Highs

by Arthur Hill,
Chief Technical Strategist, TrendInvestorPro.com
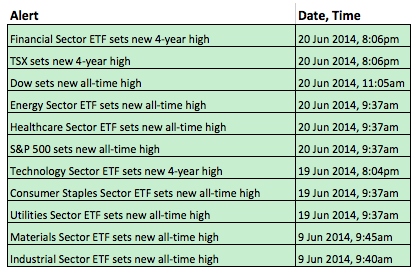
The overall picture remains bullish for stocks and sector participation is broad. Six of the nine sector SPDRs hit new highs this week, and seven of the nine hit new highs this month. The Consumer Discretionary SPDR is the only one that has yet to hit a new high and...
READ MORE
MEMBERS ONLY

SECTOR MAJORITY REMAINS BULLISH -- ONE KEY SECTOR IS STILL LAGGING -- LARGE-CAPS LEAD AND MID-CAPS HIT NEW HIGHS -- SMALL-CAP BREAKOUT HOLDS -- HOME CONSTRUCTION ISHARES TESTS THE BREAKOUT ZONE -- REFINERS AND THE BRENT-WTI SPREAD
by John Murphy,
Chief Technical Analyst, StockCharts.com
SECTOR MAJORITY REMAINS BULLISH... Link for today's video. The overall picture remains bullish for stocks. Note that seven major index ETFs hit new highs this week. These include the Nasdaq 100 Equal-Weight ETF, Nasdaq 100 ETF, Russell 1000 iShares, S&P 1500 ETF, S&P MidCap...
READ MORE
MEMBERS ONLY

Invest Like You Drive & Put $$$ in Your Pockets

by Gatis Roze,
Author, "Tensile Trading"
I spent the weekend with my friend Dan, a prison chaplain, who always seems to have unique and useful insights. This visit was no exception. Yes, understanding the parallels between prisoners and investors will put money in your pockets. Here is his insight on decision making amongst the two populations....
READ MORE
MEMBERS ONLY
Yields Move Higher Despite Dovish Fed - UUP Falls Back to Retracement
by Arthur Hill,
Chief Technical Strategist, TrendInvestorPro.com
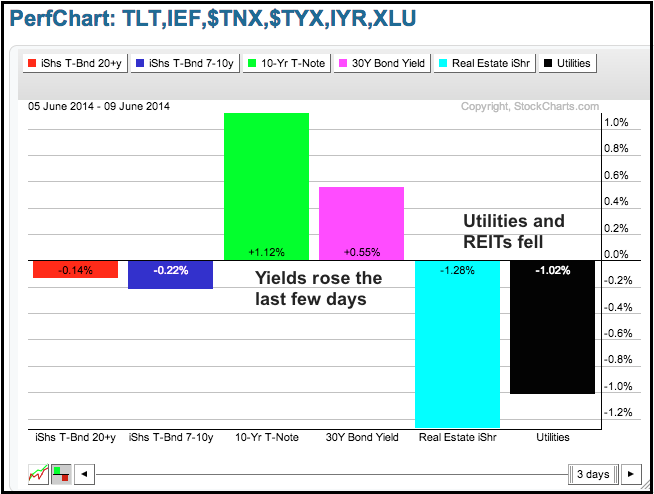
Stocks did not do much, but it was a most interesting day elsewhere. The major index ETFs closed fractionally higher and the sectors were mixed. The consumer discretionary, technology and finance sectors were fractionally lower. The energy, consumer staples and utilities sectors were modestly higher. Gold and silver miners surged...
READ MORE
MEMBERS ONLY
Money Market Weekly Cash Flow Shows Bullish Sentiment

by Carl Swenlin,
President and Founder, DecisionPoint.com
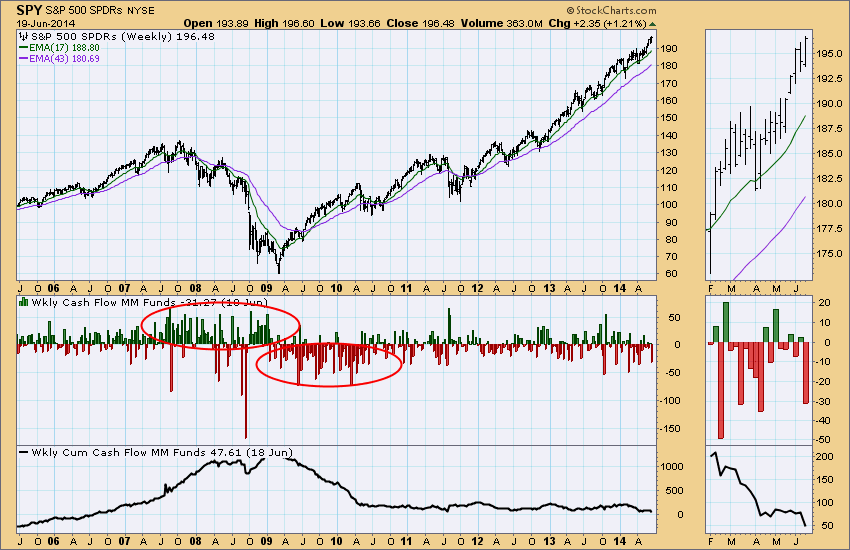
One of the data sets we keep is Money Market Mutual Fund Weekly Net Cash Flow, published on ICI.org. It is a sentiment indicator that allows us to watch short-term sentiment, as well as sentiment trends. The histogram on the chart below reflects the weekly cash flow in billions,...
READ MORE
MEMBERS ONLY
Failure of Equities to Decline on Unexpected Bad News from Iraq is Bullish

by Martin Pring,
President, Pring Research
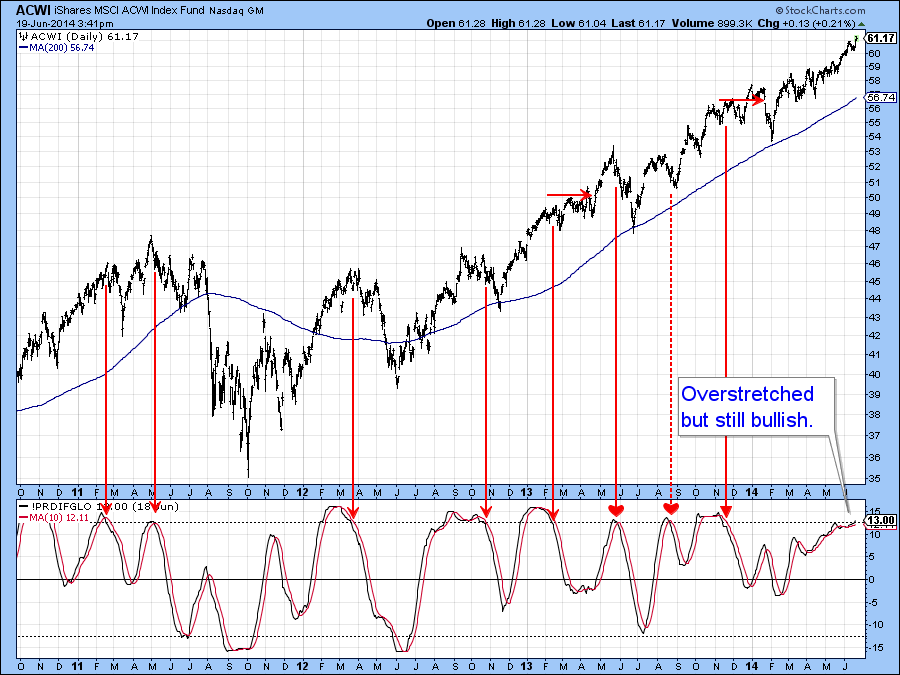
* Equities remain overstretched.
* Japanese ETF just below key resistance.
* Bonds look vulnerable as short-term rates break to the upside.
* Dollar Index triggers a sell signal.
* Gold is cloe to confirming a primary bull market.
* Commodities acting consistently with a primary bull market.
(Click here for the narrated video version of...
READ MORE
MEMBERS ONLY

FEDERAL RESERVE MEETING SENDS MARKETS TO NEW HIGHS -- $$GDP AND EQUITY MARKET CORRELATIONS -- $COMPQ TRIES TO HOLD NEW HIGHS AFTER BREAKING OUT -- $INDU SURGES 100 POINTS -- $VIX MAKES FRESH 7-YEAR LOWS -- XLU AND XLP HAVE HUGE VOLUME SURGES
by John Murphy,
Chief Technical Analyst, StockCharts.com
FEDERAL RESERVE MEETING SENDS MARKET TO NEW HIGHS... The equities market S&P 500 ($SPX) clearly liked the Fed announcement yesterday. It pushed the market back up above the highs of last week after some small range days Friday through to Tuesday. Sometimes the Fed day can be a...
READ MORE
MEMBERS ONLY
A Dark Cloud Forms Over Paychex
by Arthur Hill,
Chief Technical Strategist, TrendInvestorPro.com
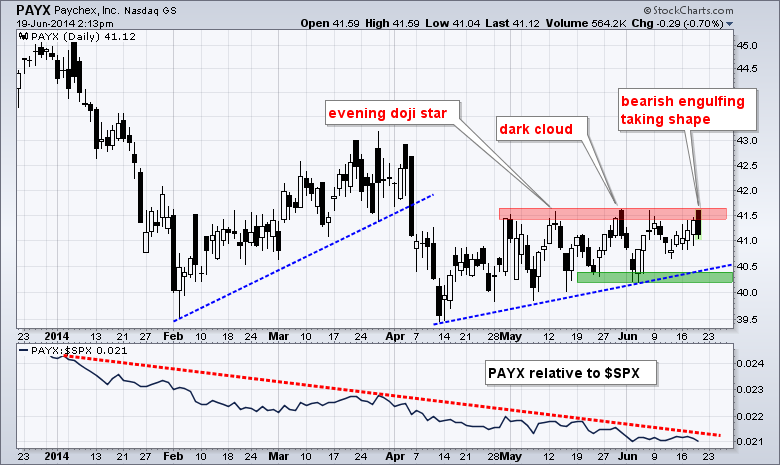
Paychex (PAYX) is having all kinds of problems breaking through resistance in the 41.7 area. A bearish engulfing is taking shape today and this is the third bearish candlestick reversal pattern in six weeks. The late May and early June lows mark support in the 40.2-40.4 area...
READ MORE
MEMBERS ONLY
Dovish Fed Puts Bid into Stocks, Bonds and Gold
by Arthur Hill,
Chief Technical Strategist, TrendInvestorPro.com
The Yellen Fed came out with a dovish statement on Wednesday. This put a bid into utilities, gold, bonds and stocks. The Dollar and Treasury yields moved lower. The gains in the major index ETFs were modest, but enough to extend the short-term uptrends. The Utilities SPDR surged over 2%...
READ MORE
MEMBERS ONLY
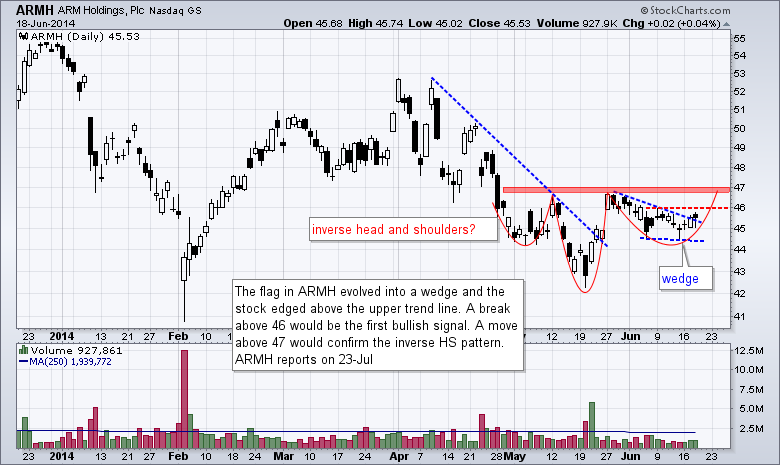
Chart Setups: ARMH, CERN, JNPR, LSCC, TASR
by Arthur Hill,
Chief Technical Strategist, TrendInvestorPro.com
There are five setups today. First, we start with a semiconductor stock forming an inverse head-and-shoulders pattern. Second, there is a healthcare stock with a bull flag taking shape. Third, we feature a networking stock with a Bollinger Band squeeze. The fourth stock also comes from the semiconductor group and...
READ MORE
MEMBERS ONLY
Utility Stocks Show Big Relative Gains on SCTR Table
by Arthur Hill,
Chief Technical Strategist, TrendInvestorPro.com
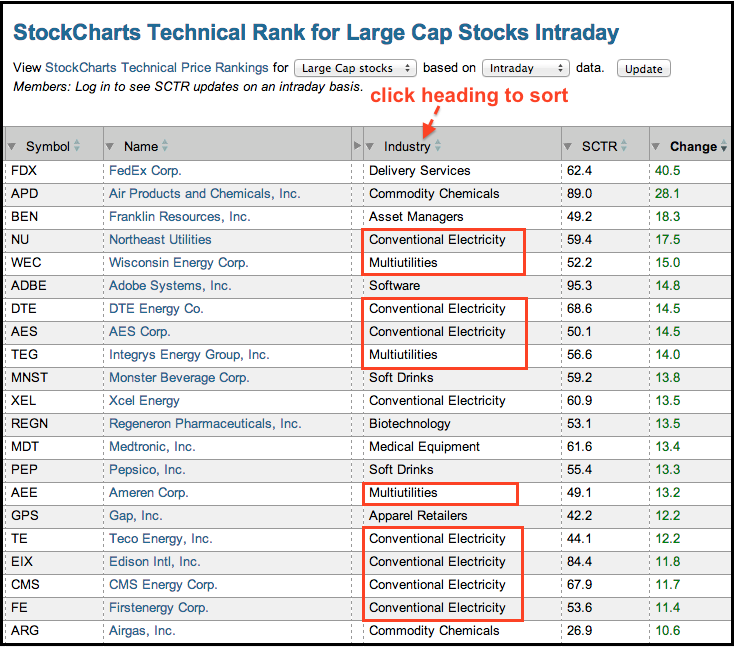
The utilities sector is on fire Wednesday with several stocks sporting big gains in their StockCharts Technical Rank (SCTR). Northeast Utilities (NU), DTE Energy (DTE) and AES Corp (AES) have double digit gains in their SCTR. Notice that this table can be sorted by clicking the column heading. This makes...
READ MORE
MEMBERS ONLY
UUP Bounces off Support as GLD Hits Resistance
by Arthur Hill,
Chief Technical Strategist, TrendInvestorPro.com
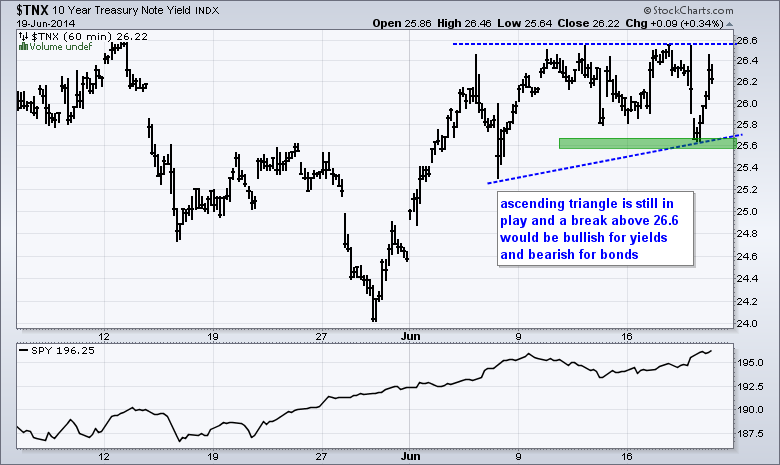
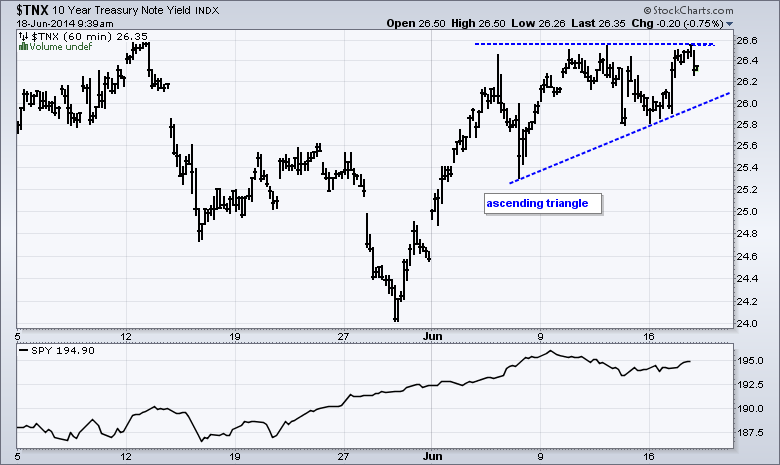
It seems that there are higher yields in our future. The economy is plugging along, the labor market is improving and inflation is on target. The Consumer Price Index (CPI) rose .4% in May and this was the largest increase since February 2013. It also puts the CPI on target...
READ MORE
MEMBERS ONLY
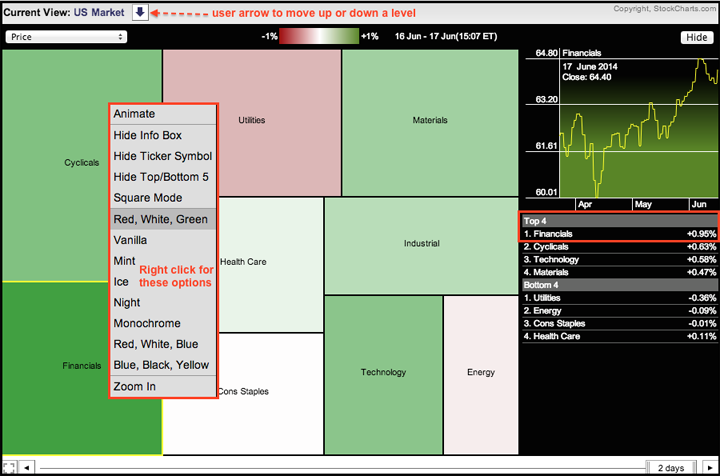
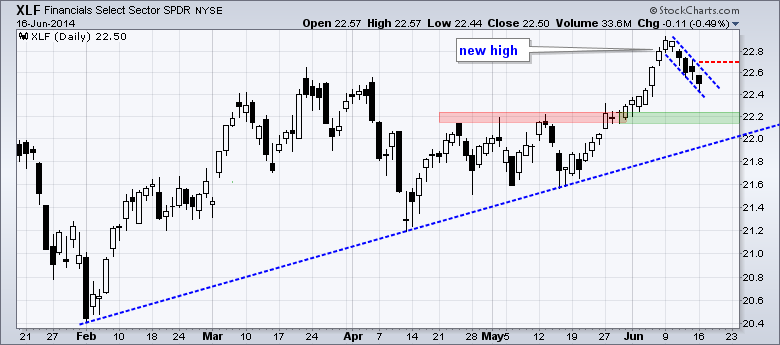
Finance Sector Lights up the MarketCarpet
by Arthur Hill,
Chief Technical Strategist, TrendInvestorPro.com
The Sector MarketCarpet shows the Finance SPDR (XLF) catching the strongest bid because it is the darkest green. The Utilities SPDR (XLU) is the weakest with an average loss of .36%. Hover over the carpet and right click to see formatting options. Click the arrow in the upper right to...
READ MORE
MEMBERS ONLY

SMALL-CAP ETFS HOLD BREAKOUTS AND CONTINUE TO LEAD -- RUSSELL 2000 VALUE ETF NEARS NEW HIGH -- TECHS AND BIOTECHS WEIGH ON RUSSELL 2000 GROWTH ETF -- SHORT-TERM YIELDS SURGE AS 10-YEAR CHALLENGES RESISTANCE -- RISING RATES BENEFIT REGIONAL BANKS
by John Murphy,
Chief Technical Analyst, StockCharts.com
SMALL-CAP ETFS HOLD BREAKOUTS AND CONTINUE TO LEAD... Link for today's video. A strong breakout should hold, and a weak breakout should fold. The Russell 2000 ETF (IWM) and S&P SmallCap iShares (IJR) broke out with big moves over the last four weeks and it is...
READ MORE
MEMBERS ONLY
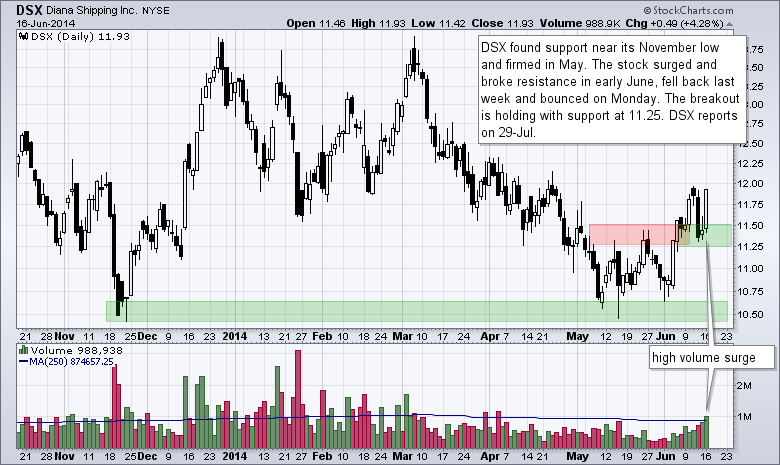
Chart Setups: DSX,GME,HMC,IMMR,NKE,UAL
by Arthur Hill,
Chief Technical Strategist, TrendInvestorPro.com
Today we have six setups. We start with a shipper that broke resistance and successfully tested this breakout with a high volume bounce. Next we have a video game retailer consolidating after a gap. Third up is a Japanese automaker with a bull flag. The fourth slot goes to a...
READ MORE
MEMBERS ONLY
Finance Sector Corrects as Fed and Settlements Loom
by Arthur Hill,
Chief Technical Strategist, TrendInvestorPro.com
Stocks were mixed on Monday, but the major index ETFs managed to eek out small gains. Small-caps showed some relative strength as the Russell 2000 ETF gained .48% on the day. The sectors were mixed with weakness in finance, industrials and materials. Energy and utilities were strong. Strength in oil...
READ MORE
MEMBERS ONLY
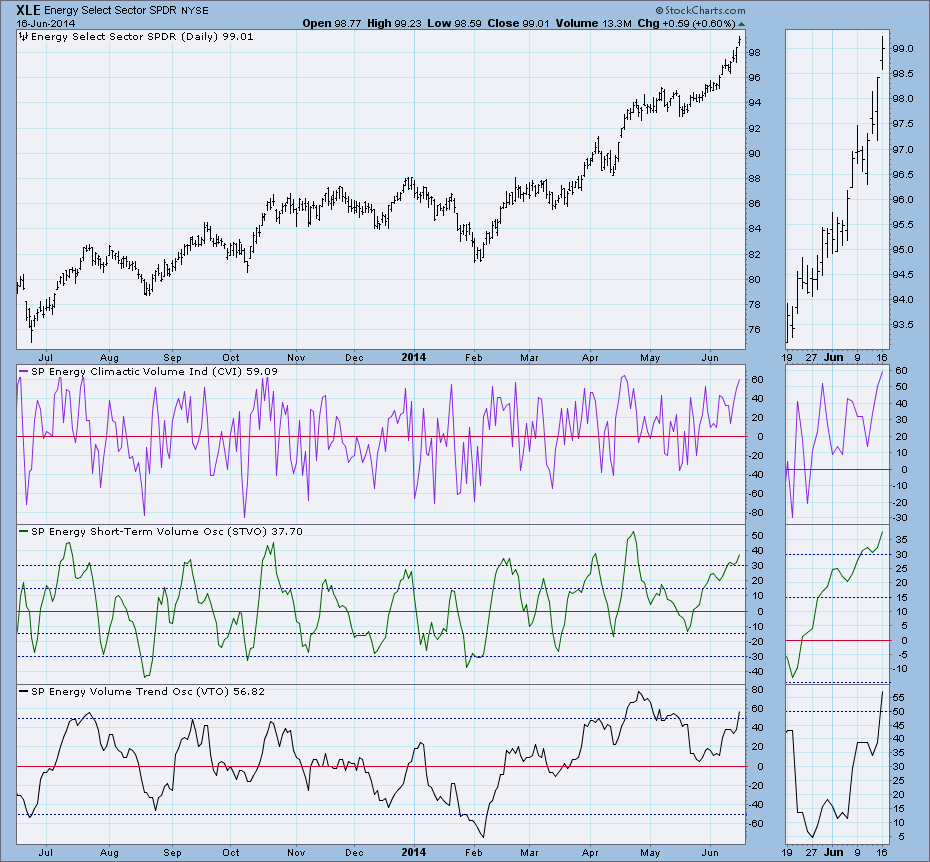
Analyzing On-Balance Volume Indicators On Select Sectors

by Erin Swenlin,
Vice President, DecisionPoint.com
The DecisionPoint On Balance Volume (OBV) indicator suite consists of three related indicators: Climactic Volume Indicator (CVI), Short-term Volume Oscillator (STVO), and Volume Trend Oscillator (VTO). All of these indicators are derived from the basic OBV calculation.
On-Balance Volume was invented by the late Joe Granville. It is a basic...
READ MORE
MEMBERS ONLY
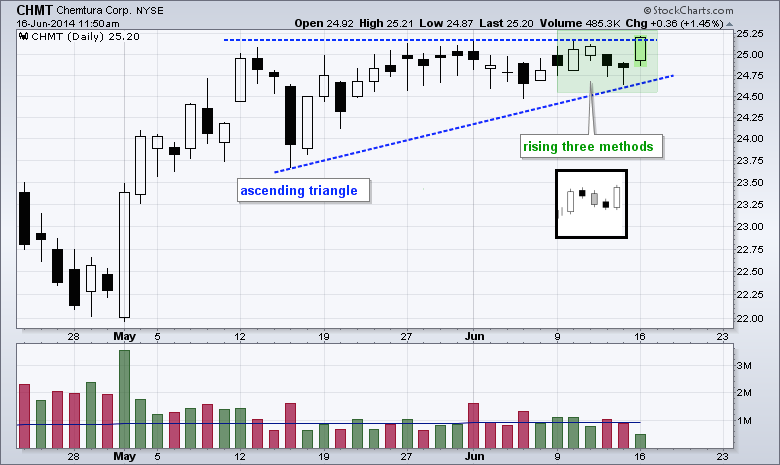
Chemtura Hits Rising Three Methods Scan
by Arthur Hill,
Chief Technical Strategist, TrendInvestorPro.com
The Rising Three Methods candlestick pattern is a bullish continuation pattern with four candlesticks: a long white candlestick, three candlesticks with small bodies and a long white candlestick that signals a continuation higher. The three small candlesticks mark a short correction or pullback. The chart below shows Chemtura with this...
READ MORE
MEMBERS ONLY

SOLAR ENERGY ETF BOUNCES OFF KEY MOVING AVERAGE -- FIRST SOLAR SURGES OFF KEY RETRACEMENT -- GT ADVANCED TECH AND SUNEDISON LEAD THE GROUP -- SOLARCITY CONSOLIDATES NEAR KEY RETRACEMENT -- SUNPOWER FORMS BULLISH CONTINUATION PATTERN
by John Murphy,
Chief Technical Analyst, StockCharts.com
SOLAR ENERGY ETF BOUNCES OFF KEY MOVING AVERAGE ... Link for today's video. The Solar Energy ETF (TAN) is perking up with a bounce off its rising 200-day moving average and a break above the 50-day moving average. Chart 1 shows TAN hitting a new high near 50 and...
READ MORE
MEMBERS ONLY
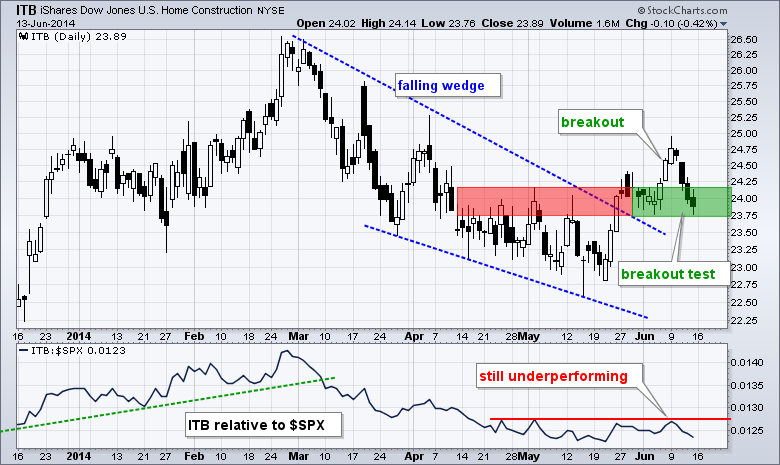
It Could be a Big Week for Housing Stocks and Treasuries
by Arthur Hill,
Chief Technical Strategist, TrendInvestorPro.com
It could be a big week for housing-related stocks and Treasury bonds. The Home Construction iShares (ITB) is at a critical juncture because it is testing the early June breakout after last week's pullback. We will get new data points for housing starts and building permits on Tuesday....
READ MORE
MEMBERS ONLY

BRIC ISHARES TEST OVERHEAD RESISTANCE AS CHINESE ISHARES RISE TO NEW 2014 HIGH -- CANADIAN STOCKS NEAR 2008 HIGH AND GET A BOOST FROM GOLD AND OIL -- UPSIDE BREAKOUT IN OIL HELPS ENERGY STOCKS BUT HURT AIRLINES
by John Murphy,
Chief Technical Analyst, StockCharts.com
EMERGING MARKETS ISHARES ARE TESTING RESISTANCE... My May 28 message showed emerging market stocks moving up toward overhead resistance. That testing process continues. The weekly bars in Chart 1 show Emerging Markets iShares (EEM) ending the week above their October intra-day high (43.52), but still below their December 2012...
READ MORE
MEMBERS ONLY

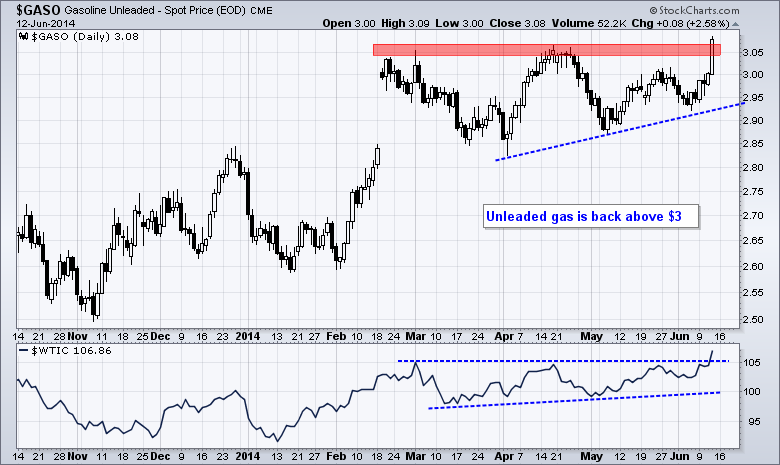
STOCKS DESERVE A CORRECTION AFTER BIG MOVES -- THROWBACK LEVELS TO WATCH FOR SPY AND RSP -- STEEL ETF UNDERPERFORMS AFTER WEDGE BREAKOUT -- WTI, BRENT AND GASOLINE BREAK TO NEW HIGHS -- RETAIL SALES STAGNATE AS XRT BACKS OFF KEY TREND LINE
by John Murphy,
Chief Technical Analyst, StockCharts.com
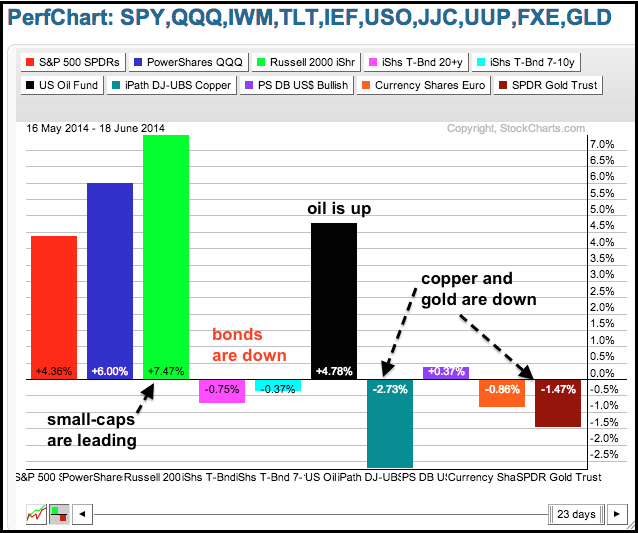
STOCKS DESERVE A CORRECTION AFTER BIG MOVES... Link for today's video. Stocks went on a tear with big gains from mid April to mid June. PerfChart 1 shows the percentage gains for the major index ETFs from April 11th to June 12th. The Nasdaq 100 ETF and Nasdaq...
READ MORE
MEMBERS ONLY

How the Markets Have Changed Me Over 25 Years: Part II
by Gatis Roze,
Author, "Tensile Trading"
“It is good to have an end to journey toward; but it is the journey that matters, in the end.” -- Ernest Hemingway
And quite a transformative journey it has been. Previously, I shared a number of the key lessons and changes I’ve experienced as I’ve evolved through...
READ MORE
MEMBERS ONLY
Modest Selling Pressure Hits Stocks - GLD Surges to First Resistance
by Arthur Hill,
Chief Technical Strategist, TrendInvestorPro.com
Selling pressure extended on Thursday, but the losses in the major index ETFs were modest. The Russell 2000 ETF declined .61% and the S&P 500 SPDR fell .71%. This is moderate selling pressure. There were, of course, some pockets with more intense selling pressure. The consumer discretionary and...
READ MORE
MEMBERS ONLY

$SPX BREAKS THROUGH TO A 50 YEAR RECORD -- $SPX SITS NEAR 3 YEAR TREND LINES -- $NYA HOLDS ABOVE THE 2007 HIGHS -- $SPX ROLLS OVER AFTER TOUCHING TREND LINE -- RUSSELL 2000 STALLS AT LEFT SHOULDER
by John Murphy,
Chief Technical Analyst, StockCharts.com
$SPX BREAKS THROUGH TO A 50 YEAR RECORD... The S&P 500 ($SPX) recorded its 81st week since touching the 200 DMA back in 2012. This is the longest streak surpassing both the 1986 and the 1965 streak of 80 weeks. Pretty amazing. This chart shows some of the...
READ MORE
MEMBERS ONLY
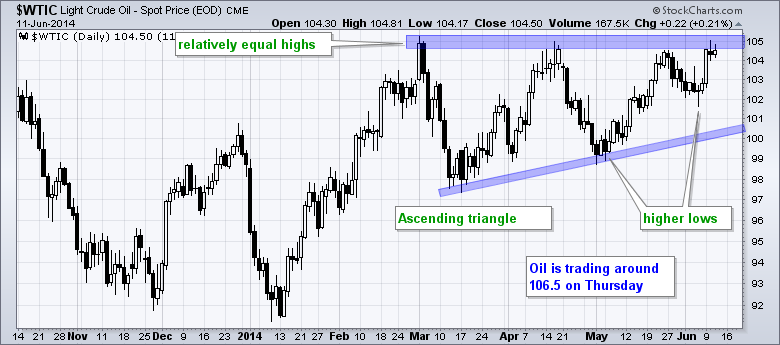
Spot Light Crude Surges Through Resistance
by Arthur Hill,
Chief Technical Strategist, TrendInvestorPro.com
Tensions in Iraq put a big bid into Spot Light Crude ($WTIC) as this key commodity broke above its March-May highs. Overall, crude formed an ascending triangle over the last few months and today's breakout signals a continuation of the January-February surge. The height of the pattern (105...
READ MORE
MEMBERS ONLY
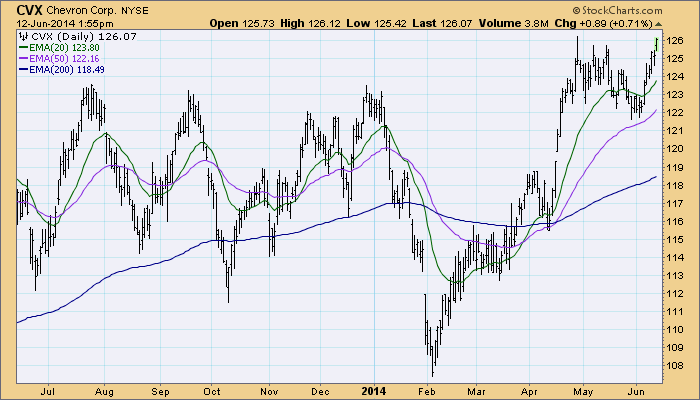
Understanding Price and Moving Average Relationships
by Carl Swenlin,
President and Founder, DecisionPoint.com
A useful and basic technique for deciding if a stock is bullish or bearish to observe the relationship of price to its moving averages. I use the 20EMA (short-term), 50EMA (medium-term), and 200EMA (long-term), and the stock is considered to be bullish or bearish in a given time frame depending...
READ MORE
MEMBERS ONLY
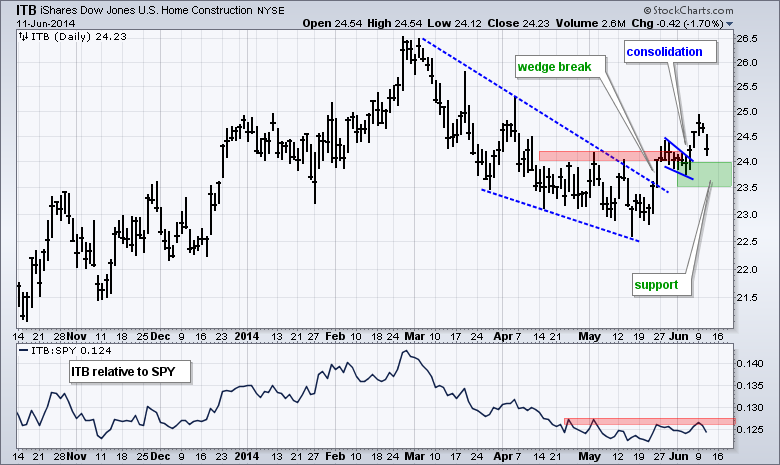
ITB Tests Breakout Zone - UUP Extends Higher
by Arthur Hill,
Chief Technical Strategist, TrendInvestorPro.com
Stocks came under selling pressure on Wednesday with the Russell 2000 ETF losing around .50% and the S&P 500 SPDR falling .35%. Even though today's decline was insignificant for the broader market, there are some growing concerns that could lead to a pullback or corrective period...
READ MORE
MEMBERS ONLY
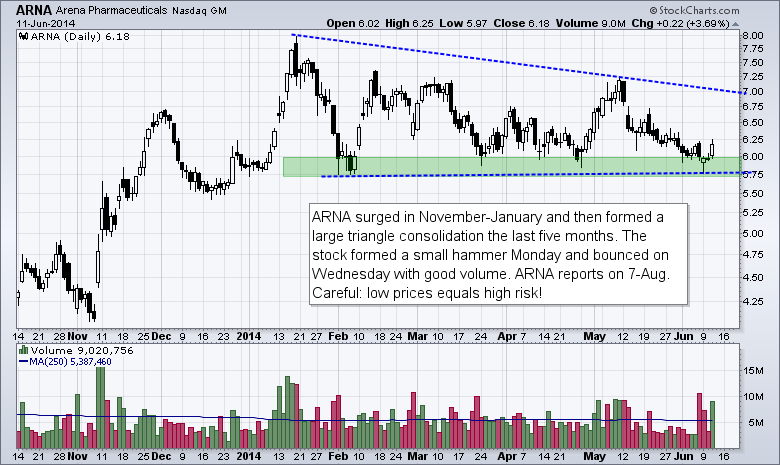
Chart Setups: ARNA, EIGI, JIVE, MYL, UTHR
by Arthur Hill,
Chief Technical Strategist, TrendInvestorPro.com
Today's charts feature five setups. First, there is a small pharma company bouncing off support after a hammer. Second, we have a recent IPO getting a breakout with good volume. Third, there is a small software company with a double bottom taking shape. Fourth, a generic drug maker...
READ MORE
MEMBERS ONLY

The Equity Rally is Getting Overstretched on a Short-term Basis.
by Martin Pring,
President, Pring Research
* More signs of an intermediate peak in the bond market.
* Dollar Index is now overbought.
* Gold and gold shares are down, but not yet out.
* Commodities continue to struggle at key short-term support.
US Equities
The short-term uptrend remains intact but is becoming overextended. You can see this from the...
READ MORE
MEMBERS ONLY
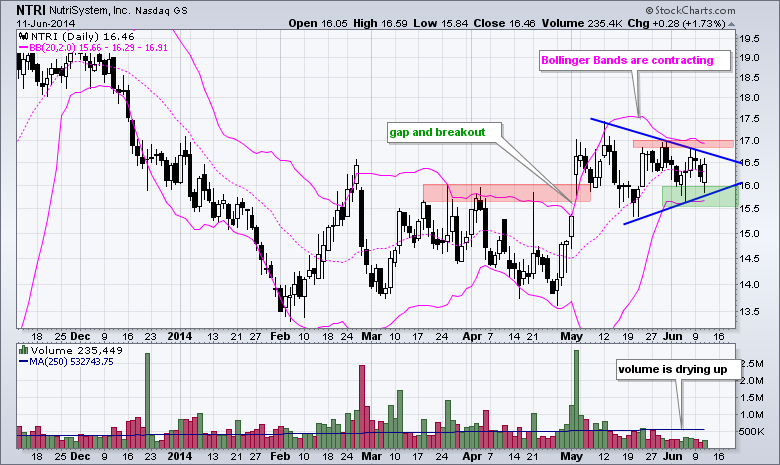
The Noose Tightens on NutriSystem
by Arthur Hill,
Chief Technical Strategist, TrendInvestorPro.com
Nutrisystem (NTRI) broke out with a big gap-surge in early May and then consolidated with a triangle. The gap and breakout are largely holding as volatility contracts. Notice how the Bollinger Bands narrowed and volume dried up over the last few weeks. Chartists should watch the June range for the...
READ MORE
MEMBERS ONLY
Stocks Turned Mixed, but Short-Term Uptrend Remains
by Arthur Hill,
Chief Technical Strategist, TrendInvestorPro.com
It was a mixed day on Wall Street as the Nasdaq 100 ETF edged higher (.17%) and the S&P 500 SPDR edged lower (.01%). The gains and losses in the major index ETFs were insignificant and Tuesday can be called a consolidation day. The sectors were also mixed...
READ MORE
MEMBERS ONLY

WILL THE STRONGEST SECTOR IN THE FIRST HALF REPEAT? -- WATCHING TREASURY YIELDS FOR CLUES ON UTILITIES -- 10-YR TREASURY YIELD CHALLENGES RESISTANCE ZONE -- INVESTORS INTEL BULLISH SENTIMENT HITS AN EXTREME -- CITRIX BREAKS OUT TO CONFIRM REVERSAL PATTERN
by John Murphy,
Chief Technical Analyst, StockCharts.com
WILL THE STRONGEST SECTOR IN THE FIRST HALF REPEAT?... Link for today's video. The utilities sector is the strongest of the nine sectors so far this year. This is true for the sector SPDRs, which are weighted by market cap, and the equal-weight sector ETFs. Chart 1 shows...
READ MORE
MEMBERS ONLY
New Highs Expand as Small-Caps Extend Rally
by Arthur Hill,
Chief Technical Strategist, TrendInvestorPro.com
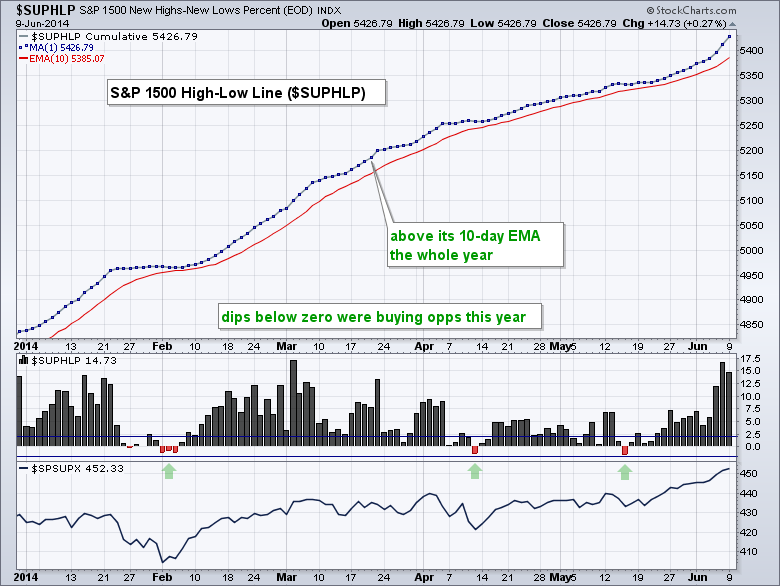
Stocks continued higher in early trading and then succumbed to some selling pressure in the afternoon. The Nasdaq 100 ETF (QQQ) closed slightly lower, the S&P 500 SPDR (SPY) edged higher and the Russell 2000 ETF (IWM) gained .88% on the day. The sectors were mixed with five...
READ MORE
MEMBERS ONLY
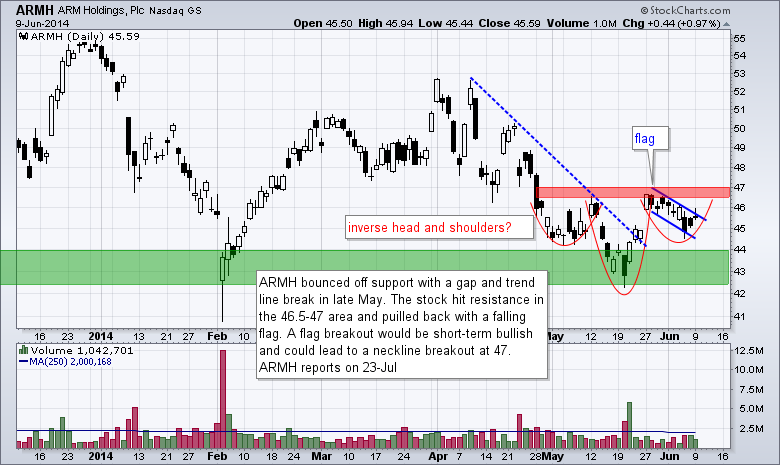
Chart Setups: ARMH, CERN, DWA, HTWR, WTW
by Arthur Hill,
Chief Technical Strategist, TrendInvestorPro.com
Today's charts feature five setups. First, we have a semiconductor stock with a bullish reversal pattern in the works. Second, we have a software company catering to the healthcare sector. Third, there is a movie producer scheduled to release a sequel this weekend. Fourth, there is a medical...
READ MORE
