MEMBERS ONLY
Intermediate-Term Indicators No Longer Congested

by Erin Swenlin,
Vice President, DecisionPoint.com
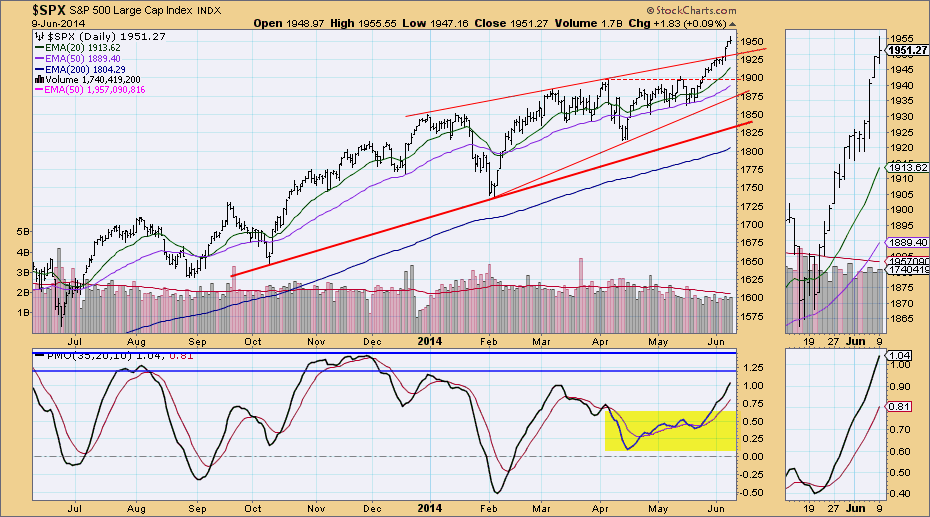
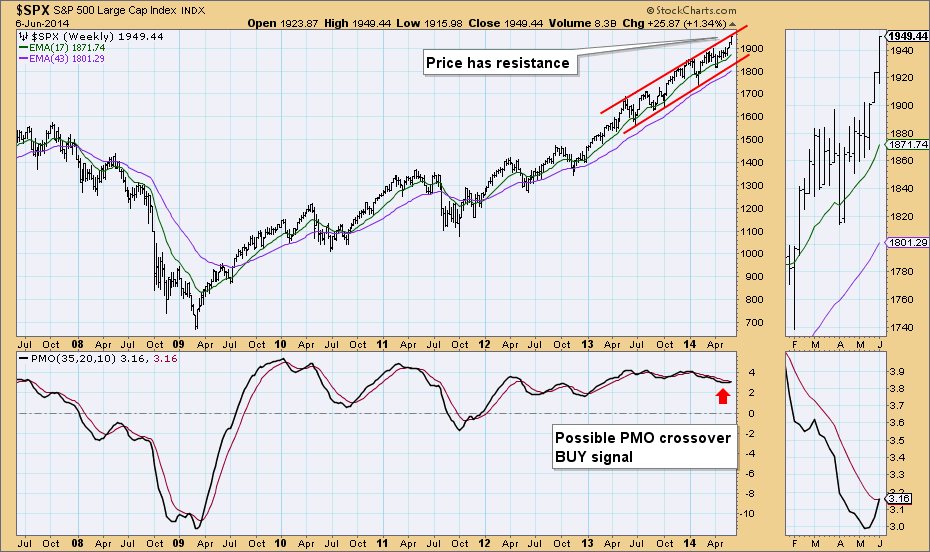
For some time, our intermediate-term indicators have been oscillating in a tight range. But since the breakout rally began, readings are now setting themselves apart. Let's look at a few charts from the DP Chart Gallery.
First is the daily chart for the SPX. Price broke out above...
READ MORE
MEMBERS ONLY

BASE METALS ETF FORMS REVERSAL PATTERN -- ZINC AND COPPER PART WAYS -- COULD ALUMINUM BREAK THE STALEMATE WITHIN DBB? -- DJ ALUMINUM INDEX HITS NEW HIGH -- ALCOA BREAKS CONSOLIDATION BOUNDARY -- CENTURY, CONSTELLIUM AND KAISER TREND HIGHER

by John Murphy,
Chief Technical Analyst, StockCharts.com
BASE METALS ETF FORMS REVERSAL PATTERN... Video will be posted soon. The Base Metals ETF (DBB) continues to challenge resistance as an inverse head-and-shoulders pattern takes shape. I featured DBB last week and showed the strong correlation to copper. Today, I would like to expand on DBB by looking at...
READ MORE
MEMBERS ONLY
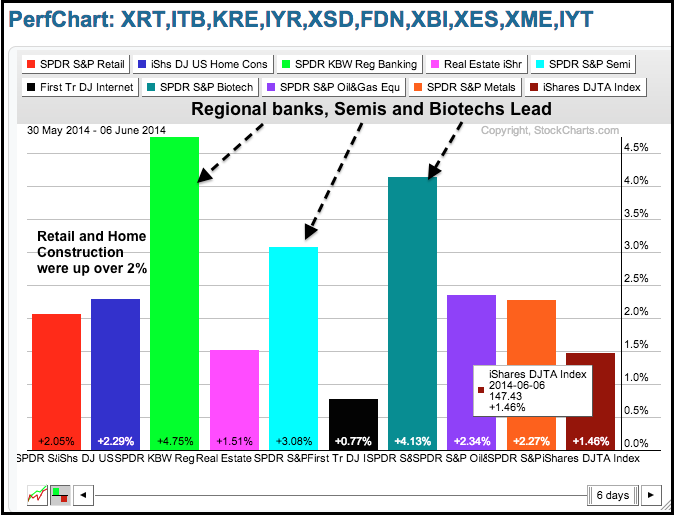
Key Industry Group ETFs Lead Market Higher

by Arthur Hill,
Chief Technical Strategist, TrendInvestorPro.com
Stocks caught a decent bid last week with small-caps, mid-caps and micro-caps leading the way. This shows strength at the high-beta end of the market and shows an increased appetite for risk. All sectors were up with finance, industrials and consumer discretionary leading the way. Relative strength in finance and...
READ MORE
MEMBERS ONLY
Five Things StockCharts Members Need to Try Today
Hello Fellow ChartWatchers!
We are half-way through 2014 and so far it has been a positive year for stocks with the S&P up 5.5%, the Nasdaq up 3.5% and the Dow up 2.1%. Small-Caps haven't participated nearly as much as their larger counterparts...
READ MORE
MEMBERS ONLY
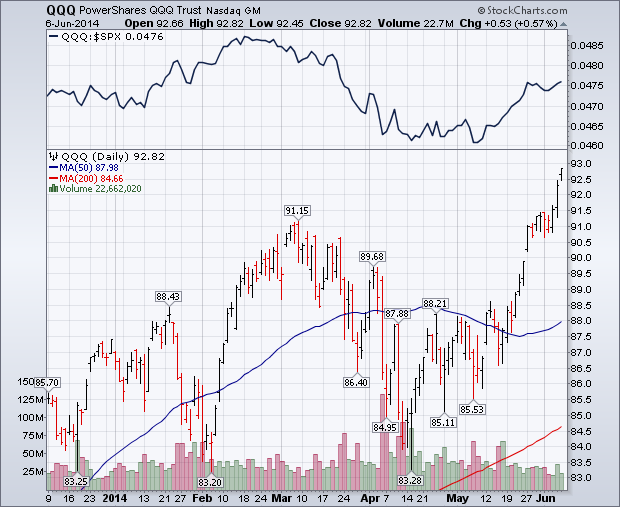
Nasdaq and Russell 2000 Charts Turn Positive
by John Murphy,
Chief Technical Analyst, StockCharts.com
This week's strong chart action in the Nasdaq market and small caps has lent more support to large cap stock indexes that have been setting new record highs. Chart 1 shows Powershares QQQ Trust breaking out to a new recovery high this week. Its relative strength ratio (above...
READ MORE
MEMBERS ONLY
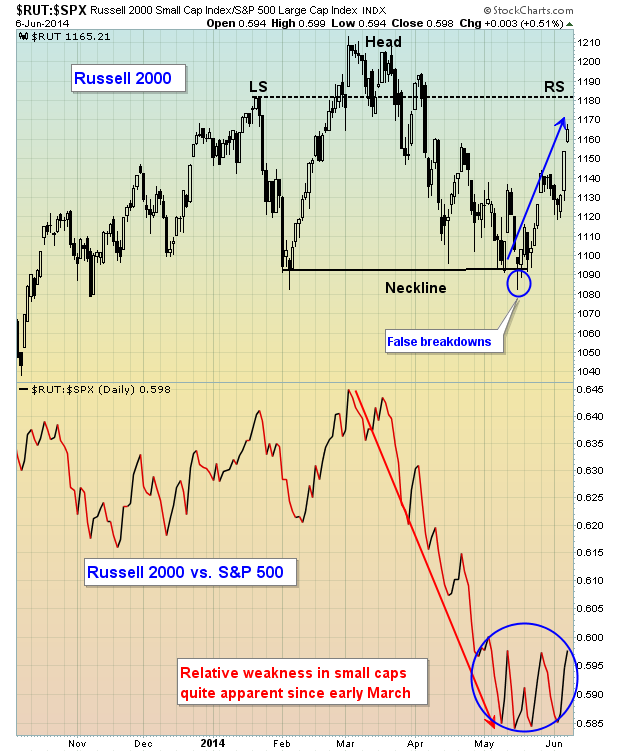
Small Caps Rebound After Holding Major Support

by Tom Bowley,
Chief Market Strategist, EarningsBeats.com
In my last article, I posted a chart of the Russell 2000, identifying a potentially bearish head & shoulders pattern. This pattern, however, requires a high volume breakdown to confirm the likelihood of future weakness. That breakdown never occurred and small cap bulls used historical bullish tendencies from late May...
READ MORE
MEMBERS ONLY
Weekly PMO Readings Insightful
by Erin Swenlin,
Vice President, DecisionPoint.com
In many cases, we all spend a lot of time looking at daily charts and varying indicators. The Price Momentum Oscillator (PMO) using daily, weekly and monthly data to create a unique value for the chart you're looking at. The daily PMO may be reacting quite differently in...
READ MORE
MEMBERS ONLY

NASDAQ AND SMALL CAPS LEAD MARKET HIGHER FOR A CHANGE -- CONSUMER DISCRETIONARY AND FINANCIALS STOCKS ALSO SHOW NEW LEADERSHIP -- EURO REBOUNDS AFTER ECB EASING -- BUT EUROZONE STOCKS AND BONDS RALLY - EUROZONE STOCKS MAY START TO OUTPACE THE U.S.
by John Murphy,
Chief Technical Analyst, StockCharts.com
NASDAQ AND RUSSELL 2000 CHARTS TURN POSITIVE... This week's strong chart action in the Nasdaq market and small caps has lent more support to large cap stock indexes that have been setting new record highs. Chart 1 shows Powershares QQQ Trust breaking out to a new recovery high...
READ MORE
MEMBERS ONLY
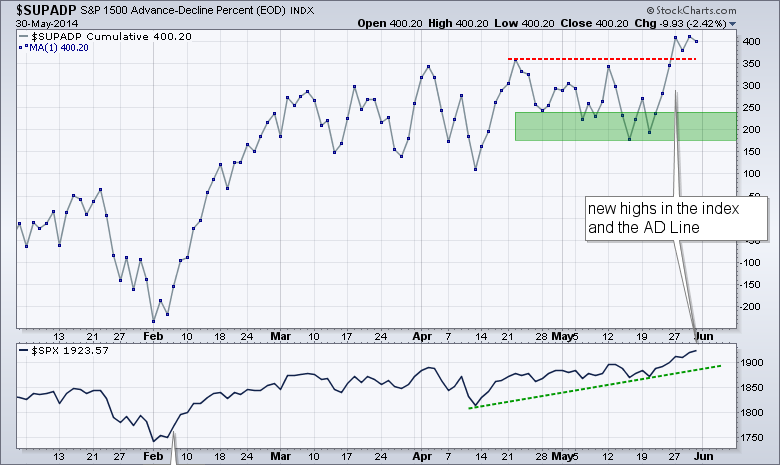
Key Breadth Indicators Confirm New Highs in the Stock Market
by Arthur Hill,
Chief Technical Strategist, TrendInvestorPro.com
The AD Line and AD Volume Line are aggregate measures of participation. The AD Line favors small and mid-caps because an advance equals +1 and a decline equals -1, regardless of market cap. This means an advance in Apple ($556 billion market cap) counts the same as an advance in...
READ MORE
MEMBERS ONLY

Commodities Facing a Bull Market Test of their Manhood

by Martin Pring,
President, Pring Research
* US Equity market trend is still positive but more cracks appearing.
* Bond rally may well be over, but confirmation is needed.
* Dollar Index rally likely to extend.
* More base building in the gold market is likely.
(Click here for the narrated video version of this article)
US Equities
Last week...
READ MORE
MEMBERS ONLY

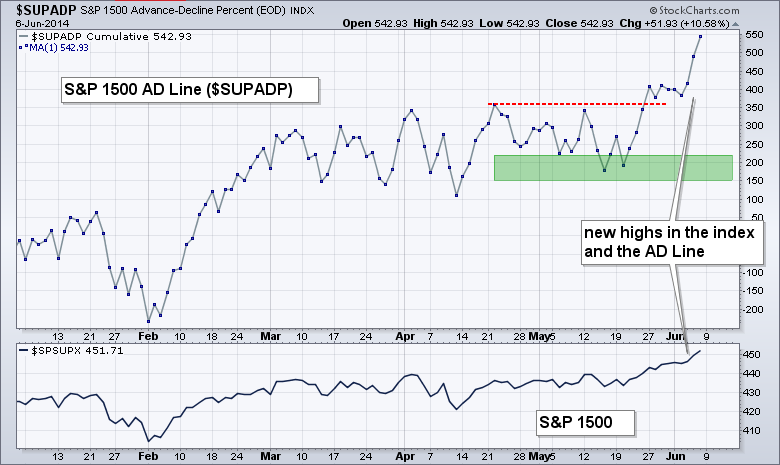
THE MAJORITY RULES FOR THE MAJOR INDEX ETFS -- SMALL-CAP AND MICRO-CAP ETFS BREAK OUT -- VAST MAJORITY OF SECTOR ETFS HIT NEW HIGHS -- S&P 1500 AD LINE AND AD VOLUME LINE HIT NEW HIGHS -- HIGH-LOW PERCENT SURGES TO HIGHEST LEVEL SINCE MARCH
by John Murphy,
Chief Technical Analyst, StockCharts.com
THE MAJORITY RULES FOR THE MAJOR INDEX ETFS... Link for today's video. The Russell 2000 ETF (IWM), Russell MicroCap iShares (IWC) and S&P SmallCap iShares (IJR) are underperforming and well below their March highs, but they are the minority and may be poised to play catch-up....
READ MORE
MEMBERS ONLY

This Could Change Your Life! How You Can Mimic Wall Street's Best & Profit Handsomely: Part II

by Gatis Roze,
Author, "Tensile Trading"
This is a continuation of last week’s popular blog about how individual investors can outperform institutional money managers. For many novice investors, it’s all about their egos. For us seasoned investors, it’s all about stocks that can make us money. We’ll use any and every advantage...
READ MORE
MEMBERS ONLY
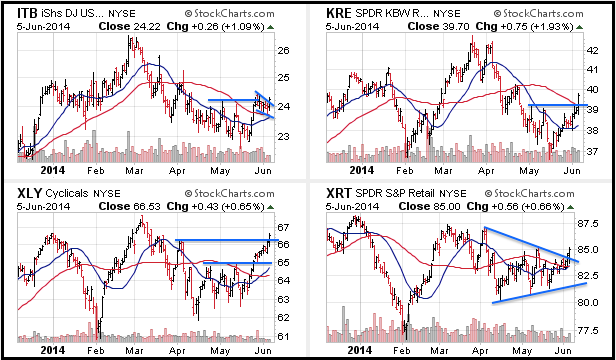
Small-Caps and Regional Banks Lead Market Higher
by Arthur Hill,
Chief Technical Strategist, TrendInvestorPro.com
Stocks caught a bid with the Russell 2000 ETF and Russell MicroCap iShares leading the charge. Both gained over 2% and easily outperformed the S&P 500 SPDR, which gained just .60% on the day. All sectors were up with industrials and finance leading. Among the key industry group...
READ MORE
MEMBERS ONLY

THE EURO ($XEU) SLINGSHOTS HIGHER ON ECB ANNOUNCEMENTS -- EUROPEAN MARKETS ($CAC,$DAX) WELCOME THE ANNOUNCEMENTS -- THE 10 YEAR NOTE YIELD ($TNX) STALLS AT RESISTANCE -- THE $SPX ROARS TO NEW HIGHS ON THE ECB MOVE
by John Murphy,
Chief Technical Analyst, StockCharts.com
THE EURO SLINGSHOTS HIGHER ON MAJOR ECB ANNOUNCEMENTS... The Euro ($XEU) traded in a wide range this morning after the ECB announced strategy changes on monetary policy. While the majority of changes had been leaked to the market in advance, the Euro still reacted with a big 1.7 cent...
READ MORE
MEMBERS ONLY
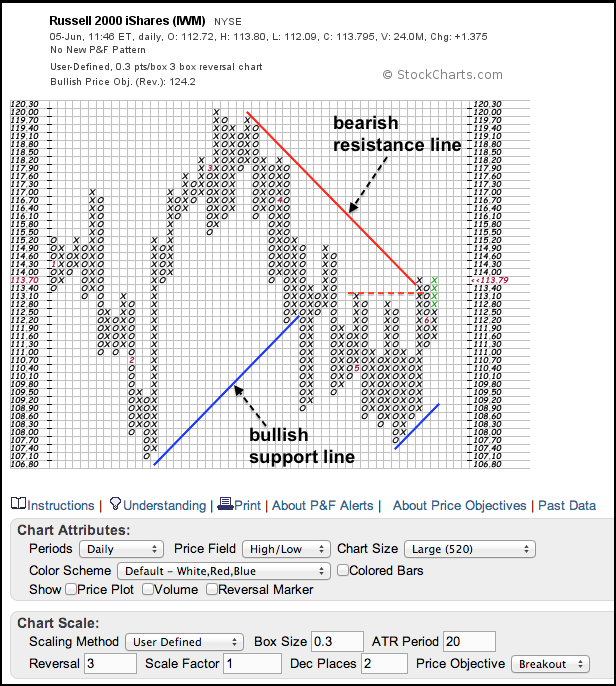
IWM Breaks Bearish Resistance Line on P&F Chart
by Arthur Hill,
Chief Technical Strategist, TrendInvestorPro.com
The P&F chart below shows the Russell 2000 ETF (IWM) with 30-cent boxes to capture the medium-term trend. Notice that this chart extends back to January, which is marked by the red numeral 1 in the first column. The ETF broke the bullish support line in April and...
READ MORE
MEMBERS ONLY
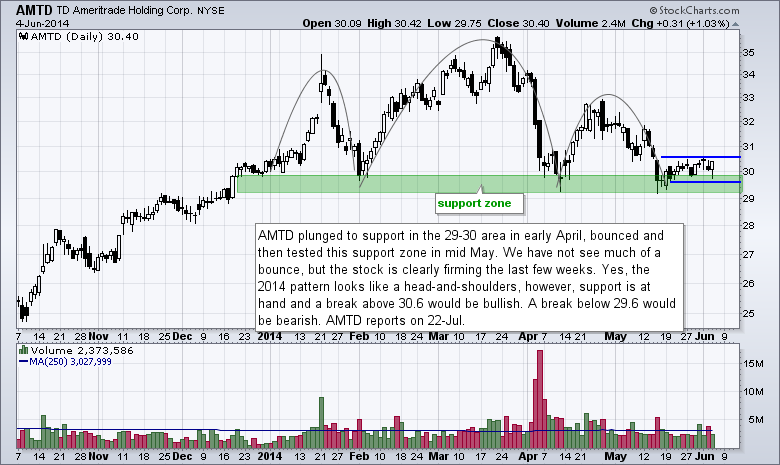
Chart Setups: AMTD, BBRY, DSX, IACI, SPWR
by Arthur Hill,
Chief Technical Strategist, TrendInvestorPro.com
Today's charts feature five setups. First, we have a stockbroker testing a major support zone. Second, there is a cell phone maker gapping higher and holding the gap. Third, a shipper is showing signs of life with a big move. The fourth chart features an internet company with...
READ MORE
MEMBERS ONLY
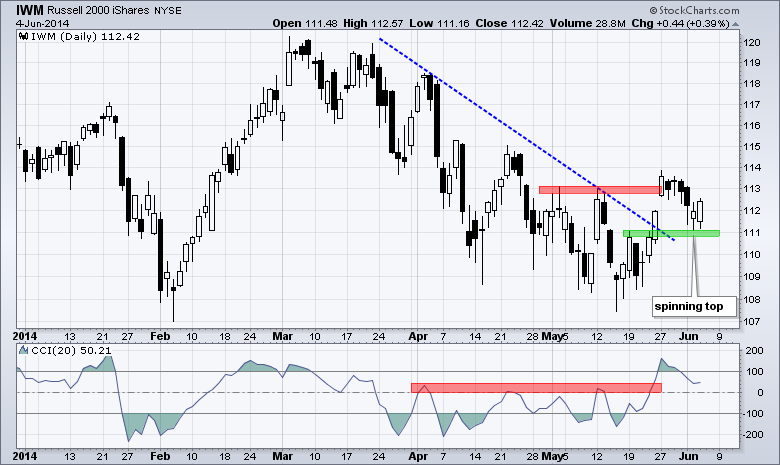
CCI Breakout on IWM Chart Holds - TLT Breaks Support
by Arthur Hill,
Chief Technical Strategist, TrendInvestorPro.com
Stocks edged higher on Wednesday with the major index ETFs posting modest gains. The economic reports continue to be positive with the ISM Services Index coming in well above 50 and the ADP report showing 179000 new private sector jobs. Also note that the Fed's beige book showed...
READ MORE
MEMBERS ONLY
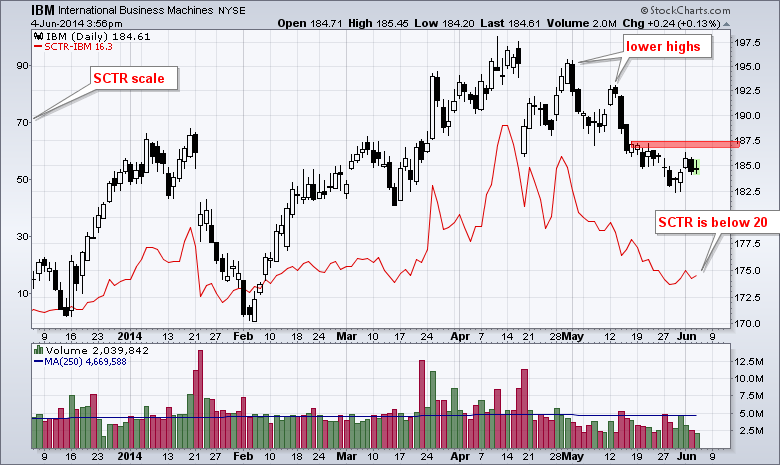
Dow Hits New High without Big Blue
by Arthur Hill,
Chief Technical Strategist, TrendInvestorPro.com
The Dow Industrials hit another new high this week, but IBM did not help the cause and remains well below its mid April high. This means IBM shows relative weakness, which is confirmed by the StockCharts Technical Rank (SCTR). The SCTR (red line) is below 20 and has spent most...
READ MORE
MEMBERS ONLY
Nasdaq 100, Health Care, and Technology Have Excess of PMO Buy Signals

by Carl Swenlin,
President and Founder, DecisionPoint.com
The Precentage of Stocks on PMO Crossover Buy Signals is flashing a warning on three of the indexes we track in the decisionPoint Alert Daily Report. The Price Momentum Oscillator is a primary DecisionPoint indicator that generates short-term Buy and Sell signals when it crosses above and below its 10EMA....
READ MORE
MEMBERS ONLY

CHIP ETFS HIT NEW HIGH -- AMAT, LAM RESEARCH, AND SANDISK ACHIEVE BULLISH BREAKOUTS -- METLIFE AND PRUDENTIAL LEAD INSURANCE RALLY -- FORD AND GM LEAD AUTO GROUP -- FALLING YEN BOOSTS JAPANESE STOCKS
by John Murphy,
Chief Technical Analyst, StockCharts.com
CHIPS CONTINUE TO EXCEL... Last Wednesday's message showed the Market Vectors Semiconductor ETF (SMH) moving up to challenge its 2014 highs. It has since broken out to the highest level in fourteen years. Chart 1 shows the PHLX Semiconductor iShares (SOXX) doing the same. I'm switching...
READ MORE
MEMBERS ONLY
Stocks Start Outperforming Bonds as TLT Tests Support
by Arthur Hill,
Chief Technical Strategist, TrendInvestorPro.com
Stocks put in a lackluster performance as the market awaits a data deluge in the coming days. We have the ADP Employment Report, Fed Beige Book and ISM Services today. Initial Claims and the European Central Bank (ECB) meeting are Thursday. And, of course, Friday is non-farm payrolls. Automakers reported...
READ MORE
MEMBERS ONLY
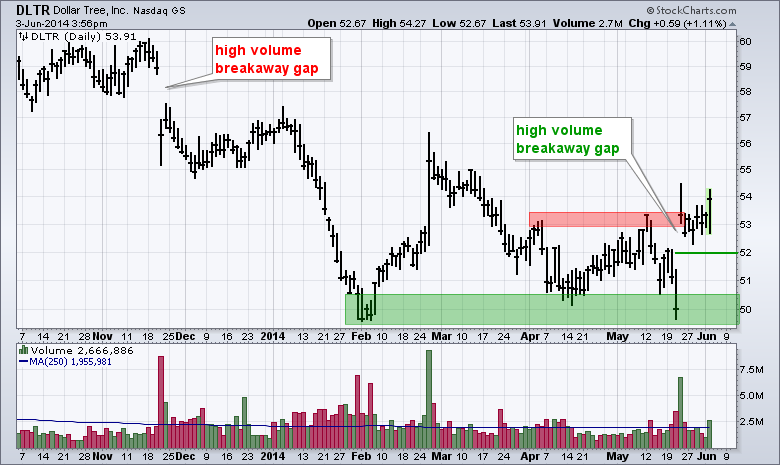
Dollar Tree Holds the Breakaway Gap
by Arthur Hill,
Chief Technical Strategist, TrendInvestorPro.com
The Dollar Tree chart shows two breakaway gaps in opposite directions. The first breakaway gap occurred in November and started a downtrend. The second breakaway gap occurred in late May and held for over a week. Like the November gap, this gap occurred on high volume and could signal the...
READ MORE
MEMBERS ONLY

MACD MAKES A KEY CROSS FOR THE AUTO INDEX -- FORD LEADS GM WITH BREAKOUT -- HONDA CONFIRMS PIERCING PATTERN AS TOYOTA BREAKS TREND LINE -- 10-YR TREASURY YIELD SPRINGS BACK ABOVE KEY LEVEL -- FINANCE SPDR BREAKS ABOVE RESISTANCE
by John Murphy,
Chief Technical Analyst, StockCharts.com
MACD MAKES A KEY CROSS FOR THE AUTO INDEX... Link for today's video. I featured the DJ US Auto Index on May 20th as a large consolidation formed and the MACD line flattened. Auto stocks are getting a boost today after Chrysler, which is owned by Fiat (FIATY)...
READ MORE
MEMBERS ONLY
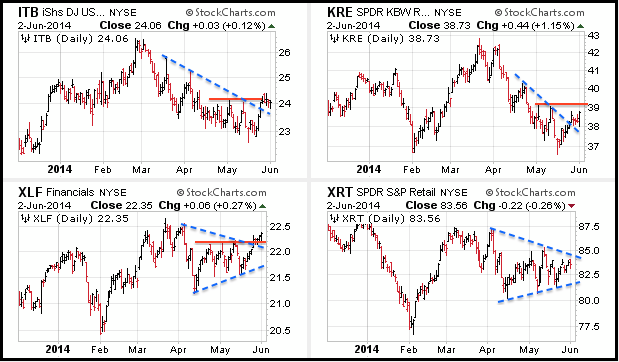
KRE Challenges Resistance as TLT Plunges to Trend Line Support
by Arthur Hill,
Chief Technical Strategist, TrendInvestorPro.com
Stocks put in a mixed performance on Monday with large-caps and mid-caps edging higher, and small-caps moving lower. The gains and losses were contained and not enough to affect the short-term trends. Five of the nine sector SPDRs were up, but the gains and losses were inconsequential. Of note, the...
READ MORE
MEMBERS ONLY
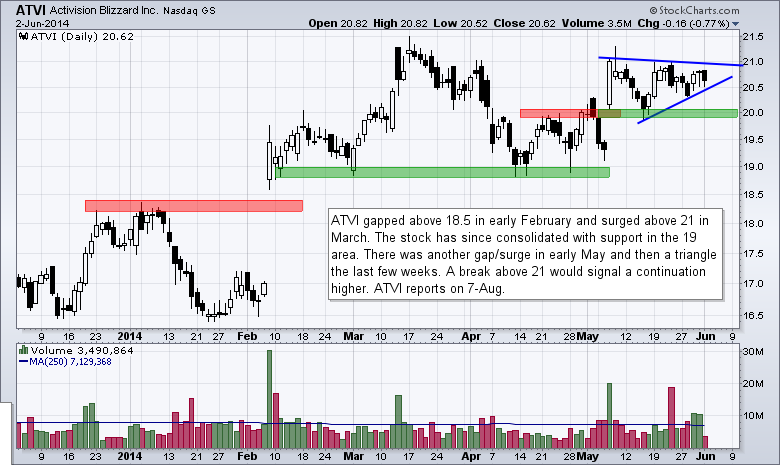
Chart Setups: ATVI, ANF, LB, MOS, NYT
by Arthur Hill,
Chief Technical Strategist, TrendInvestorPro.com
Today's charts feature five setups. A video game maker is consolidating within an uptrend. A teen apparel retailer triggered a bear trap after a failed support break. A women's apparel retailer is consolidating after a gap-reversal. A fertilizer company formed a big bullish continuation pattern. And,...
READ MORE
MEMBERS ONLY
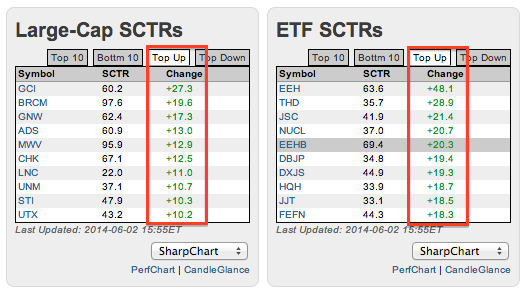
Gannet Leads Large-caps SCTR Gainers with a Big Gap
by Arthur Hill,
Chief Technical Strategist, TrendInvestorPro.com
Looking for relative performance leaders? Look no further than the StockCharts home page and the top SCTR movers. The StockCharts Technical Rank (SCTR) tables can be found on the home page near the bottom. Click the "top up" tab to see the biggest gainers and "top down&...
READ MORE
MEMBERS ONLY

RELATIVE WEAKNESS IN KEY GROUPS UNDERMINES SMALL-CAPS -- RETAIL SPDR BOUNCES OFF SUPPORT ZONE -- REGIONAL BANK SPDR BREAKS WEDGE TREND -- PEABODY BREAKS DOWN, BUT CONSOL HOLDS STRONG -- COAL ETF FAILS TO HOLD BREAKOUT
by John Murphy,
Chief Technical Analyst, StockCharts.com
RELATIVE WEAKNESS IN KEY GROUPS UNDERMINES MARKET... Link for today's video. The S&P 500 and Dow Industrials notched new highs yet again, but the Russell 2000 remains well below its spring highs and continues to lag. Chart 1 shows the Russell 2000 in red and the...
READ MORE
MEMBERS ONLY
SPY and TLT Hit New Highs ahead of Big Economic Week
by Arthur Hill,
Chief Technical Strategist, TrendInvestorPro.com
The S&P 500 SPDR and 20+ YR T-Bond ETF extended their uptrends with new highs last week, but this positive correlation could get a big test with a full economic docket this week. The Dow Diamonds, Nasdaq 100 ETF, Equal-Weight S&P 500 ETF and S&...
READ MORE
MEMBERS ONLY

New DecisionPoint Subscribers and StockCharts Beginners Welcome!
by Erin Swenlin,
Vice President, DecisionPoint.com
I'm sure that you have seen the information on the upcoming ChartCon 2014 in August, but you may not know that this convention is not just for StockCharts veterans. In fact, it will be invaluable to those new to StockCharts.com.
To the DecisionPoint subscribers that followed us...
READ MORE
MEMBERS ONLY
PMO BUY Signals Reviewed From DP 152 Blue Chip Tracker Report
by Erin Swenlin,
Vice President, DecisionPoint.com
The DP Tracker reports are full of information on a variety of stocks and ETFs. Here is a link to a blog with more information on DP Trackers and how to find and use them.
I took at look at Friday's DP 152 Blue Chip Tracker Report to...
READ MORE
MEMBERS ONLY

FALLING EURO BOOSTS THE DOLLAR -- ECB THURSDAY ANNOUNCEMENT SHOULD DETERMINE EURO DIRECTION AS IT TESTS 200 DAY AVERAGE -- FALLING TREASURY BOND YIELDS ARE PART OF GLOBAL RETREAT -- BOUNCING DOLLAR CAUSES PROFIT-TAKING IN COMMODITIES
by John Murphy,
Chief Technical Analyst, StockCharts.com
DOLLAR BOUNCE IS TIED MAINLY TO EURO DROP... When studying the trend of the U.S. Dollar Index, it's a good idea to study the trend of the Euro as well. That's because the Euro has the biggest influence on dollar direction (57%). [The Japanese yen...
READ MORE
MEMBERS ONLY
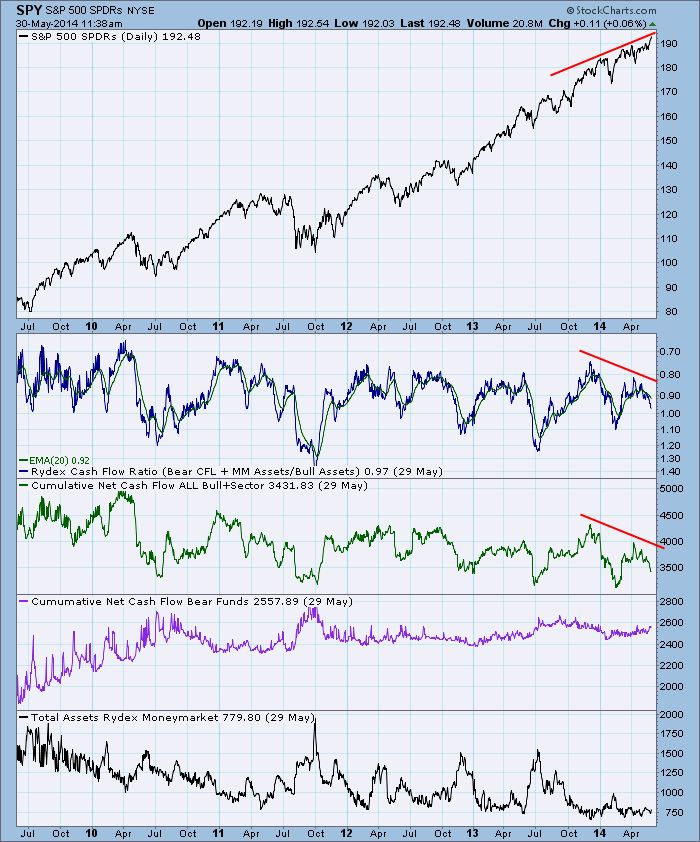
Rydex Cash Flow Undermines Market Rally
by Carl Swenlin,
President and Founder, DecisionPoint.com
We calculate and chart daily and cumulative net cash flow, which is the actual cash entering and leaving each fund in the Rydex group of funds. This is done by calculating the amount that total assets in a fund should have changed based upon the percentage change of per share...
READ MORE
MEMBERS ONLY

$TRAN SOARS WITH TRUCKING, AIRLINES AND RAILS ALL IN GEAR -- $NAHL DIPS BELOW BULL MARKET TREND -- $NYHL STAYS IN BULL MARKET TREND -- $SILVER CONTINUES TO PUSH DOWN ON THE BOTTOM RIGHT -- $GOLD LOOKS TO RETEST ANNUAL LOWS IN JUNE
by John Murphy,
Chief Technical Analyst, StockCharts.com
$TRAN SOARS WITH TRUCKING, AIRLINES AND RAILS ALL IN GEAR... The Dow Jones Transportation Index ($TRAN) has clearly broken out to new highs as shown in Chart 1. There are three sub-indexes that make up the Transportation Index; Airlines ($DJUSAR), Rails ($DJUSRR) and Trucking ($DJUSTK). All three sub-indexes have soared...
READ MORE
MEMBERS ONLY

This Could Change Your Life! How You Can Mimic Wall Street's Best & Profit Handsomely:Part 1
by Gatis Roze,
Author, "Tensile Trading"
This should be illegal. If I was a hedge fund or mutual fund manager, I’d be thoroughly upset, but since I’m not, let me show you a unique and powerful advantage that exists for us individual investors.
You may be familiar with a new breed of ETFs that...
READ MORE
MEMBERS ONLY

DP Subscribers: Renew Your StockCharts Subscription For Less Than Your DP Subscription!
by Erin Swenlin,
Vice President, DecisionPoint.com
Just a reminder that the majority of DecisionPoint.com subscribers will be losing their StockCharts.com access (and consequently access to the majority of DP content) unless they renew now. Questions have been coming in to the Support Team regarding the cost difference and what they are getting for their...
READ MORE
MEMBERS ONLY

Will the Dollar Index Surprise on the Upside?
by Martin Pring,
President, Pring Research
* S&P Breaks to a new high, but leaves a lot to be desired.
* Bond rally intact but getting overstretched.
* Dollar Index is breaking to the upside.
* Euro experiences a double whipsaw breakout.
* Gold violates a key support trend line.
* Commodities face an important test of the bull market...
READ MORE
MEMBERS ONLY

$SPX MAKES ANOTHER NEW HIGH -- $COMPQ TESTS RIGHT SHOULDER LEVEL -- $NDX TESTS MARCH 6 HIGHS -- $INDU HOLDS ABOVE 16600 -- $RUT IS AT A MAJOR SUPPORT/RESISTANCE LINE -- APPLE BUYS BEATS FOR $3B, SPLITS STOCK, WWDC NEXT WEEK
by John Murphy,
Chief Technical Analyst, StockCharts.com
THE S&P 500 MAKES A NEW HIGH. ... The S&P 500 ($SPX) shown in Chart 1 is climbing to a new intraday high for the third day in a row. This new high is supported by the French ($CAC) and German ($DAX) markets also making new highs...
READ MORE
MEMBERS ONLY
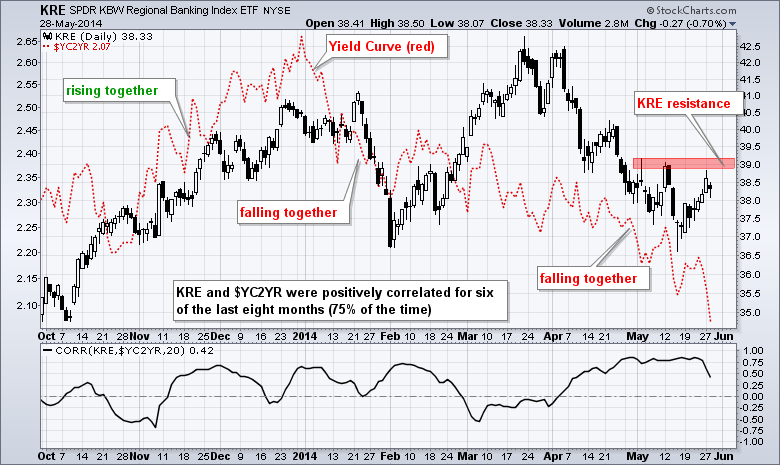
Regional Bank SPDR Continues to Track the Yield Spread
by Arthur Hill,
Chief Technical Strategist, TrendInvestorPro.com
While falling yields translate into lower borrowing costs for the borrower, they are not always positive for the lender. In particular, the recent decline in the 10-Year Treasury Yield ($TNX) caused the spread between the 10-year yield and the 2-year yield to narrow (red dashed line). The chart below shows...
READ MORE
MEMBERS ONLY
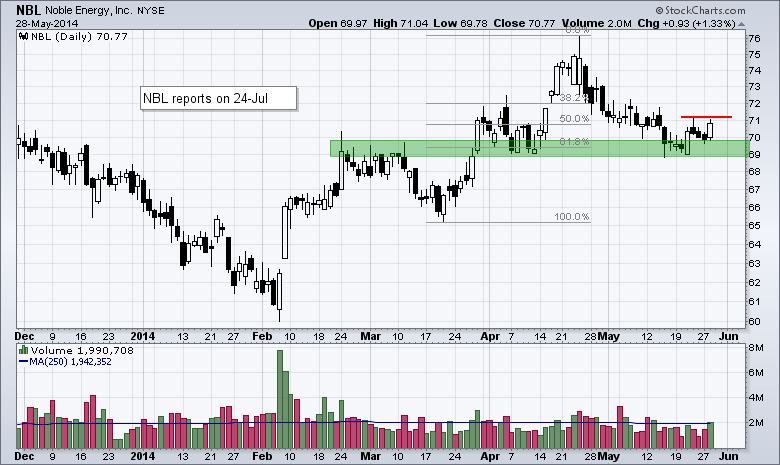
Chart Setups: COPPER, GME, NBL, $WTIC, XRT
by Arthur Hill,
Chief Technical Strategist, TrendInvestorPro.com
Today's charts feature five setups from across the board. A key industrial metal retraced 50-62% of its prior advance and may hit resistance soon. A game retailer with high short interest gapped up. An oil services company shows signs of firming in a key retracement zone. Oil hit...
READ MORE
