MEMBERS ONLY
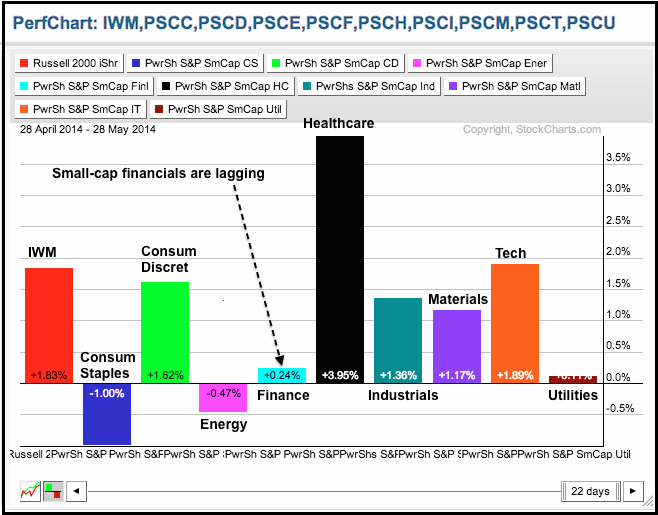
Small-Cap Financials are Still Underperforming

by Arthur Hill,
Chief Technical Strategist, TrendInvestorPro.com
Note that I will be taking a day off on Friday and Art's charts will not be updated until Monday. Stocks took a breather on Wednesday with small losses in the major index ETFs. The Russell 2000 ETF and Russell MicroCap iShares suffered the biggest losses, but the...
READ MORE
MEMBERS ONLY
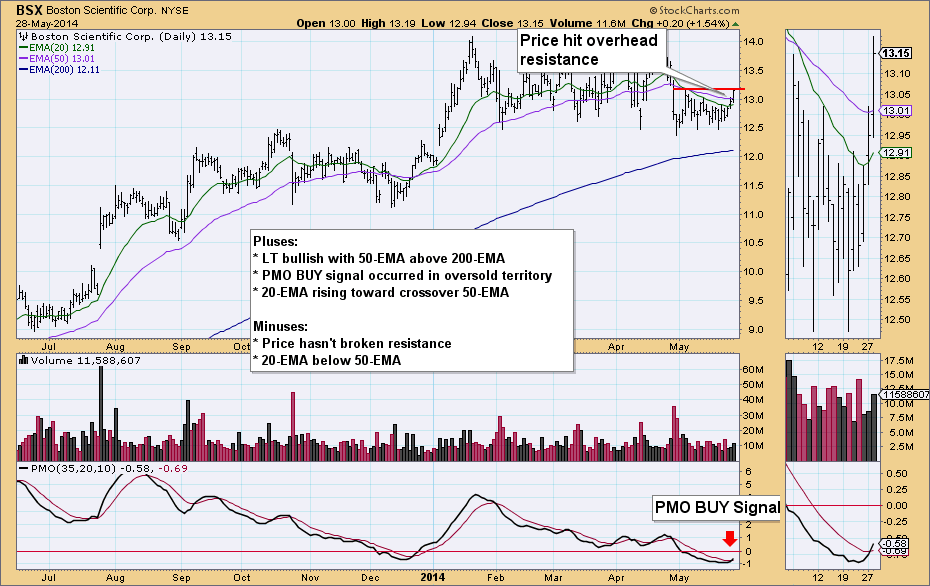
Using PMO BUY Signals on DP SPX-Plus Tracker Report

by Erin Swenlin,
Vice President, DecisionPoint.com
One of my favorite ways to use the DP Tracker Reports is to call one up and take a look at brand new PMO BUY/SELL signals that have been generated by the PMO crossing over its EMA. Today I specifically pulled up the DP SPX-Plus Tracker Report 4. This...
READ MORE
MEMBERS ONLY

EMERGING MARKET ISHARES TEST OVERHEAD RESISTANCE -- WHILE TAIWAN ISHARES REACH A NEW RECORD -- EAFE ISHARES NEAR TEST OF 2007 HIGHS -- WHILE GERMANY ISHARES HIT NEW RECORD -- JAPAN STOCKS CONSOLIDATE WITHIN UPTREND

by John Murphy,
Chief Technical Analyst, StockCharts.com
EEM STILL TESTING TRENDLINE RESISTANCES... My May 18 message suggested that emerging markets might be approaching an important upside breakout. The weekly bars in Chart 1 show the Emerging Markets iShares (EEM) still testing the upper resistance line in three-year symmetrical triangle. A decisive close above that resistance line is...
READ MORE
MEMBERS ONLY
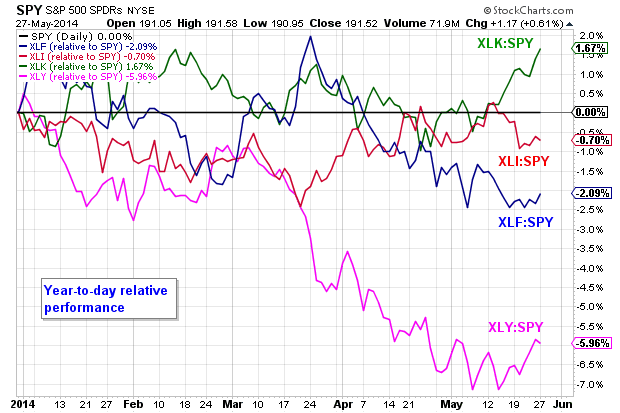
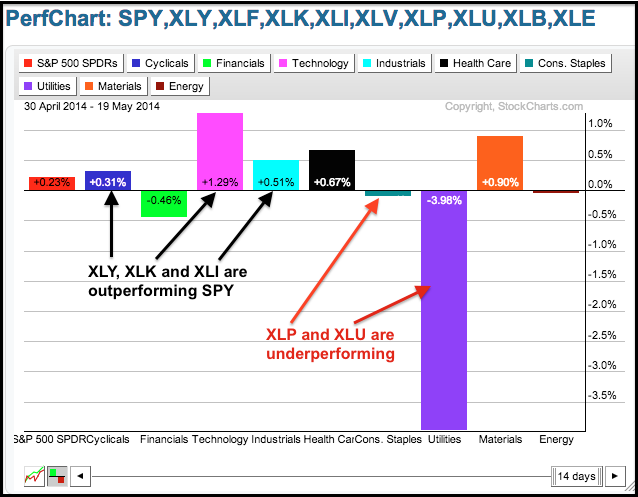
Tech SPDR Makes a Relative Strength Breakout
by Arthur Hill,
Chief Technical Strategist, TrendInvestorPro.com
The chart below shows year-to-date relative performance for four sector SPDRs (XLK, XLF, XLI and XLY). Notice that the XLK:SPY ratio shot up over the last two weeks and moved to its highest level of the year (above the February peak). In fact, the XLK:SPY ratio is the...
READ MORE
MEMBERS ONLY
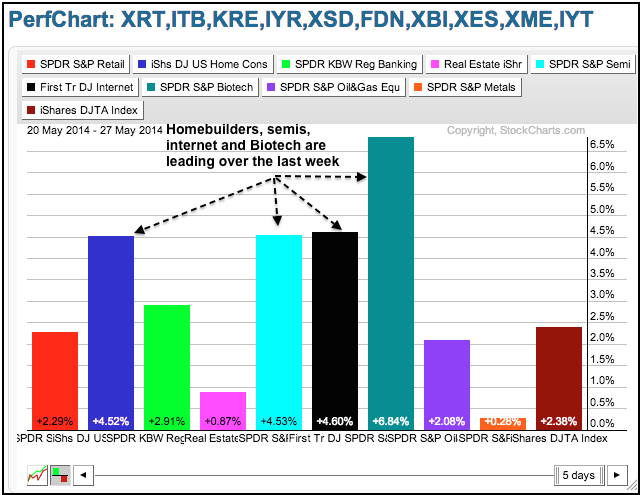
Techs Lead Market High - Gold Confirms Bearish Continuation Pattern
by Arthur Hill,
Chief Technical Strategist, TrendInvestorPro.com
Stocks were higher again on Tuesday with small-caps leading the way. The Russell 2000 ETF and Russell MicroCap iShares gained 1.44% and 1.92%, respectively. Strength in small-caps triggered a breakout in IWM as it moved above its mid May high. The Finance SPDR and Technology SPDR led the...
READ MORE
MEMBERS ONLY
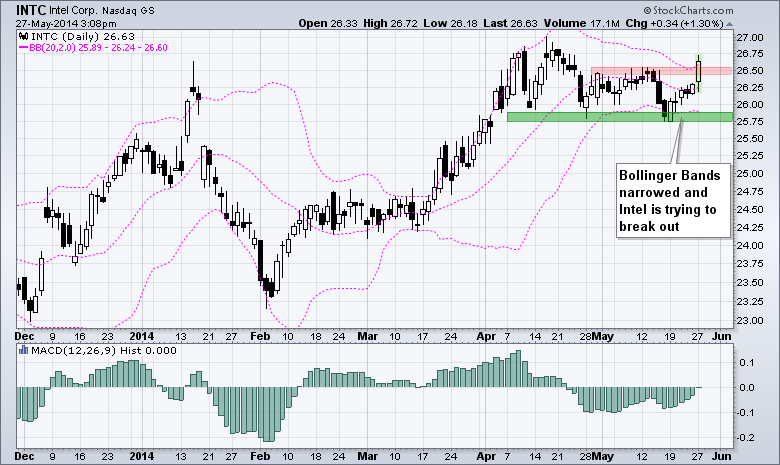
Intel Gets a Squeeze and a Breakout
by Arthur Hill,
Chief Technical Strategist, TrendInvestorPro.com
Intel (INTC) is leading the semiconductor group higher with a move above its upper Bollinger Band. Notice how the bands contracted as volatility narrowed over the last few weeks. The breakout signals what could be the start of a volatility expansion and continuation higher. Chartists can use the recent lows...
READ MORE
MEMBERS ONLY

S&P 1500 ETF FORMS BULLISH CONTINUATION PATTERN -- WATCHING SMALL-CAP BREADTH INDICATORS FOR A BREAKOUT -- TECH AND CONSUMER DISCRETIONARY BPIS TURN UP -- GOOGLE TRIGGERS P&F BREAKOUT -- FACEBOOK REMAINS ON SELL SIGNAL
by John Murphy,
Chief Technical Analyst, StockCharts.com
S&P 1500 ETF FORMS BULLISH CONTINUATION PATTERN... Link for today's video. The head-and-shoulders pattern can be a reversal pattern or a continuation pattern. The difference depends on the price movement preceding the pattern. There are two types of head-and-shoulders patterns: normal and inverse. The direction of...
READ MORE
MEMBERS ONLY
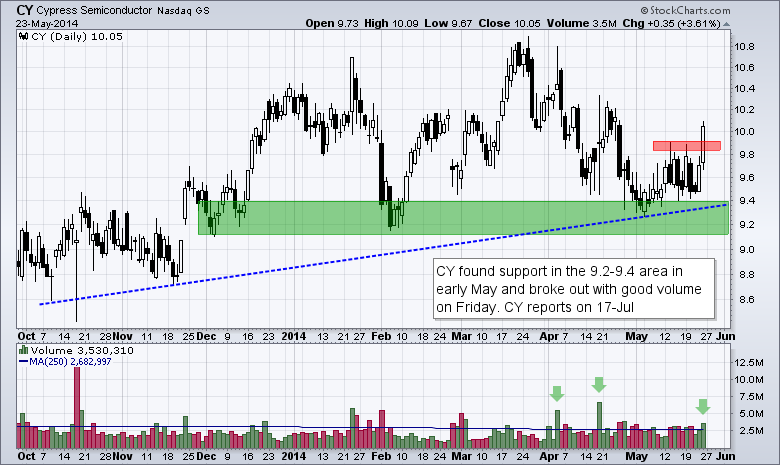
Chart Setups: CY, GPS, LB, MRVL, USG
by Arthur Hill,
Chief Technical Strategist, TrendInvestorPro.com
Today's charts feature five setups in various groups. We start with a semiconductor stock making a breakout on high volume. Next, there are two retailers with bullish continuation patterns forming. Both broke out with gaps and are now consolidating. Fourth, we have another semiconductor stock bouncing off support...
READ MORE
MEMBERS ONLY
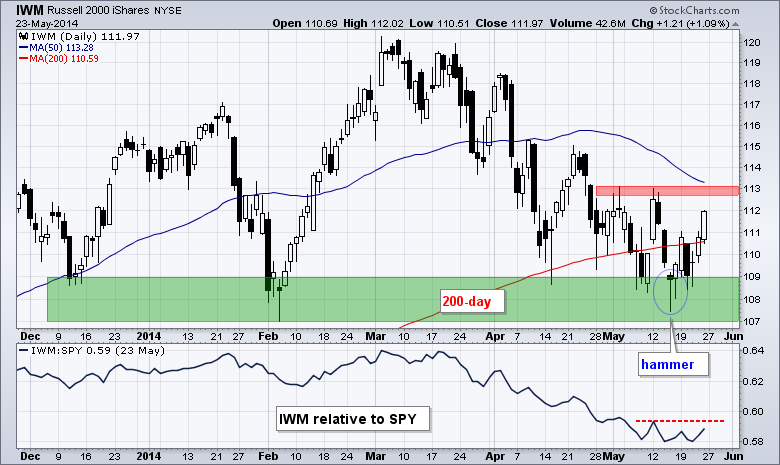
IWM Moves Back above Key Moving Average - SPY Hits New High
by Arthur Hill,
Chief Technical Strategist, TrendInvestorPro.com
Last week was a pretty good week for stocks. First, small-caps led the market as the Russell 2000 ETF gained over 2%. Second, the Consumer Discretionary SPDR led the sectors higher with a 2.09% gain. Third, Treasuries actually fell as the 20+ YR T-Bond ETF lost .74% last week....
READ MORE
MEMBERS ONLY

HOMEBUILDER BOUNCE LED BY DR HORTON AND LENNAR -- NASDAQ SHOWS IMPROVEMENT -- BIG CAP TECH STOCKS PUSH TECHNOLOGY SPDR TO NEW HIGH -- TECH LEADERS INCLUDE HPQ, CISCO, ORACLE, VERIZON, AND APPLE -- APPLE HAS BIGGEST INFLUENCE ON TECH SECTOR
by John Murphy,
Chief Technical Analyst, StockCharts.com
HOMEBUILDERS BOUNCE ... A bigger than expected rise in April new home sales gave a big boost to homebuilding stocks at week's end. And it couldn't have come at a better time. Chart 1 shows the Dow Jones U.S. Home Construction iShares (ITB) climbing more than...
READ MORE
MEMBERS ONLY
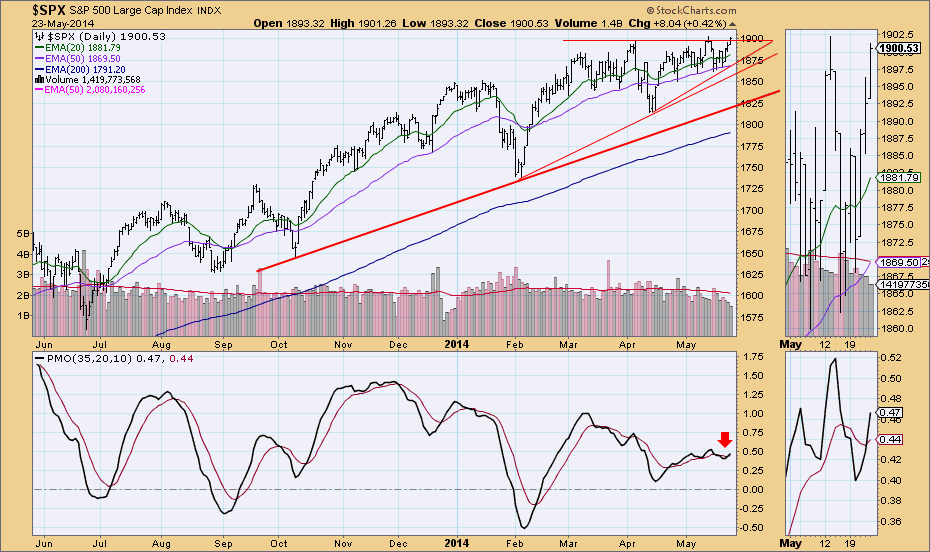
Market at a Decision Point - DP Gallery Review
by Erin Swenlin,
Vice President, DecisionPoint.com
A week-end look at the charts in the DP Chart Gallery tells us that the market, having just reached and pushed above horizontal resistance, is at a decision point. Will price be turned away or will it make a decisive breakout move? Let's look at what the DecisionPoint...
READ MORE
MEMBERS ONLY
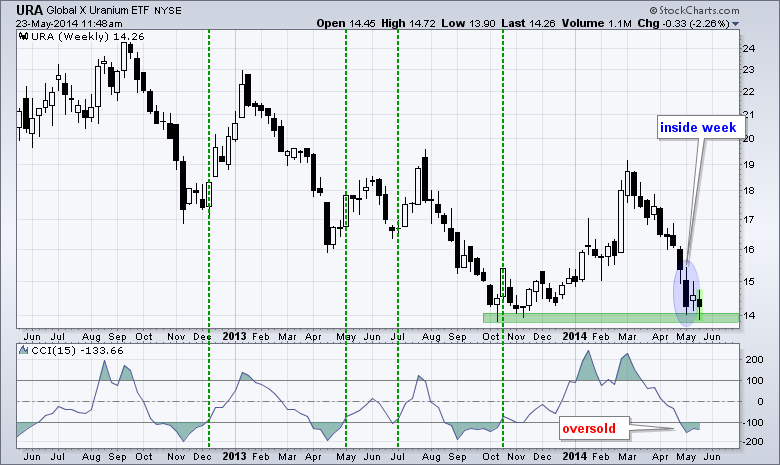
Uranium ETF Tests Support with Inside Week
by Arthur Hill,
Chief Technical Strategist, TrendInvestorPro.com
The Global Uranium ETF (URA) has had a tough eleven weeks with a decline from 19 to 14, but support may be at hand. The October-November lows marked support in the 14 area and the ETF firmed here with an inside week last week. Also notice that CCI is oversold....
READ MORE
MEMBERS ONLY

IS THE RUSSELL 2000 WAGGING THE RUSSELL 1000? -- TRANSPORTS AND AIRLINES CONTINUE SHOWING RELATIVE STRENGTH -- JETBLUE RECOVERS AFTER SUPPORT BREAK -- UNITED FIRMS AFTER SHARP DECLINE -- SHORT-TERM YIELDS DIVERGE FROM LONG-TERM YIELDS
by John Murphy,
Chief Technical Analyst, StockCharts.com
IS THE RUSSELL 2000 WAGGING THE RUSSELL 1000?... Link for today's video. There has been a lot of talk about relative weakness in the Russell 2000 and small-caps over the last few weeks. While relative weakness in small-caps is a concern, we should not read too much into...
READ MORE
MEMBERS ONLY

Key Take-Aways from the 67th CFA Annual Conference Part II

by Gatis Roze,
Author, "Tensile Trading"
In a previous blog, I labeled the four-day Global Chartered Financial Analysts event in Seattle as the ‘gold standard’ of conferences and seminars I’ve attended. In this Part II blog, I want to share with you more key investment-related insights from the impressive slate of conference speakers.
1. Recent...
READ MORE
MEMBERS ONLY
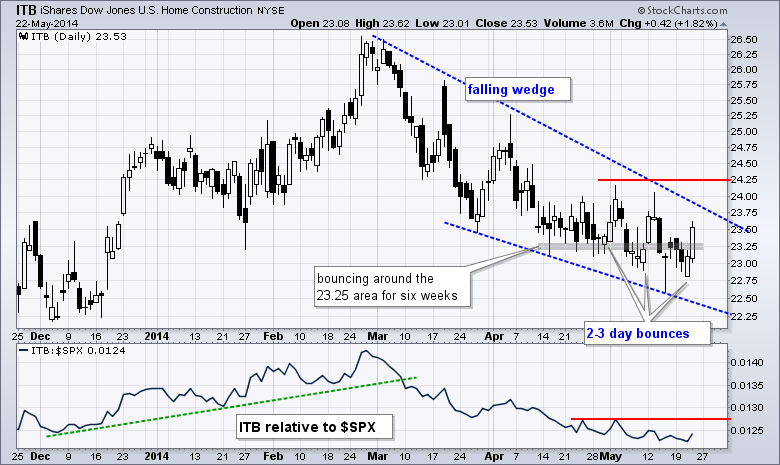
IWM Keeps Bear Trap Alive - ITB Bounces within Downtrend
by Arthur Hill,
Chief Technical Strategist, TrendInvestorPro.com
Stocks moved higher on Thursday with another lopsided advance. The Russell 2000 ETF gained around 1%, but the S&P 500 SPDR gained just .30%. Small-caps led and large-caps lagged. Eight of the nine sectors were higher with the consumer discretionary and finance sectors leading. Homebuilders contributed to relative...
READ MORE
MEMBERS ONLY

No Sell Signal for Equities...Yet!

by Martin Pring,
President, Pring Research
* The line of least resistance for global and US equities looks to be an upward one.
* The overstretched short-term condition argues against taking undue risks.
* Bond rally is showing signs of tiredness.
* The commodity correction may be over.
(Click here for the video version of this article)
First, I would...
READ MORE
MEMBERS ONLY

CONSUMER CYCLICALS COMING INTO A STRONG SEASONAL BIAS -- CONSUMER CYCLICALS RELATIVE STRENGTH STARTS TO IMPROVE -- CYCLICALS START TO OUTPERFORM CONSUMER STAPLES -- CYCLICALS START TO OUTPERFORM UTILITIES -- XLY BUILDS A MOMENTUM BASE
by John Murphy,
Chief Technical Analyst, StockCharts.com
CONSUMER CYCLICALS COMING INTO A STRONG SEASONAL BIAS... John did an indepth view of energy yesterday, and Arthur did an in depth view of the 5 major technology groups on Monday. Some of the price action I have seen this week is pointing towards some strength in Cyclicals. We will...
READ MORE
MEMBERS ONLY
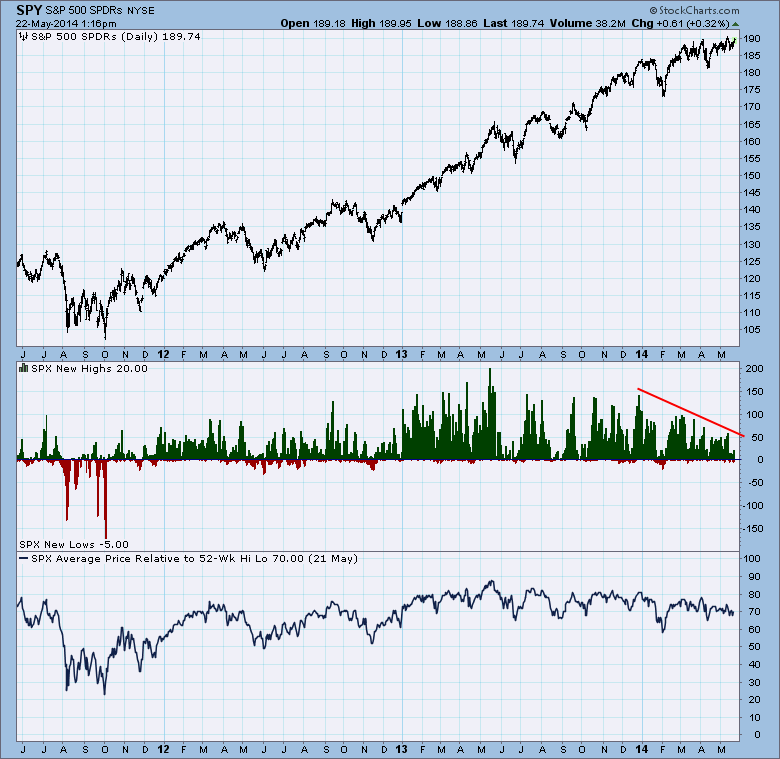
Fading New Highs Not a Problem Yet

by Carl Swenlin,
President and Founder, DecisionPoint.com
In the last three months price has been squeezing out new record highs, but the number of new 52-week highs has been contracting. Clearly, fewer stocks are participating in the push to new price highs, and this divergence is of concern. However, we also note that there has not been...
READ MORE
MEMBERS ONLY
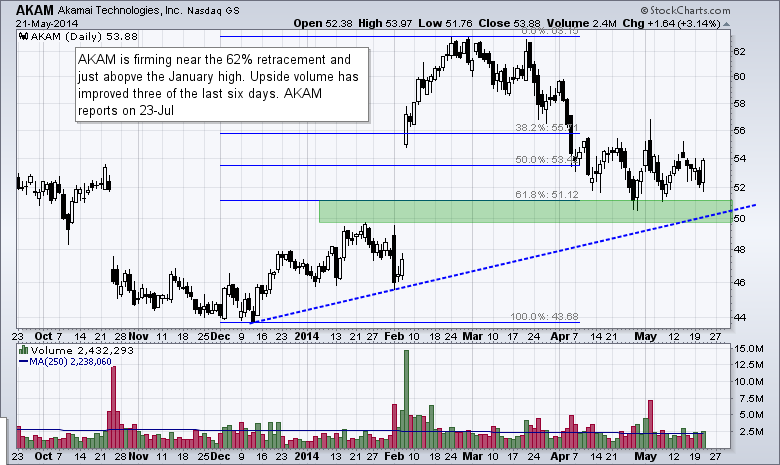
Charts: ANF, AKAM, CYH, DDD, FB
by Arthur Hill,
Chief Technical Strategist, TrendInvestorPro.com
Today's charts feature five setups in various groups. We start with an internet stock that is firming in a gap zone and retracement area. There is a clothing retailer with a bearish wedge. Next up is a hospital stock that appears to be healing with a gap and...
READ MORE
MEMBERS ONLY
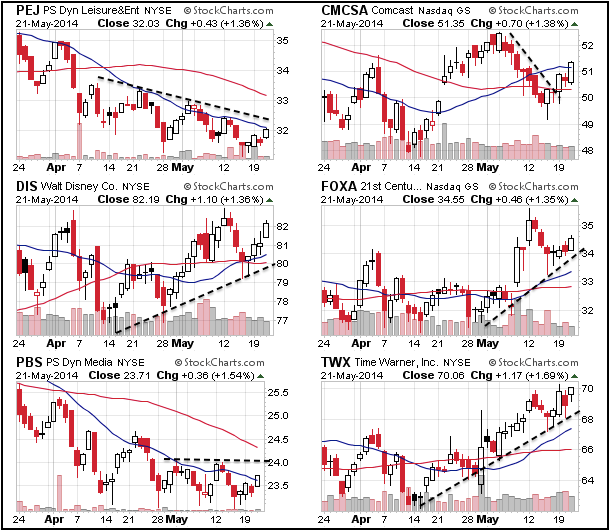
Media Stocks Lead XLY - Small-Cap Breadth Indicator Remains Bearish
by Arthur Hill,
Chief Technical Strategist, TrendInvestorPro.com
Stocks rebounded on Wednesday with large-caps leading the way. The Dow Diamonds (DIA) and S&P 100 ETF (OEF) rose around 1%. All sectors were up with consumer discretionary and industrials leading. Note, however, that the Retail SPDR (XRT) and the Home Construction iShares (ITB) did not lead the...
READ MORE
MEMBERS ONLY
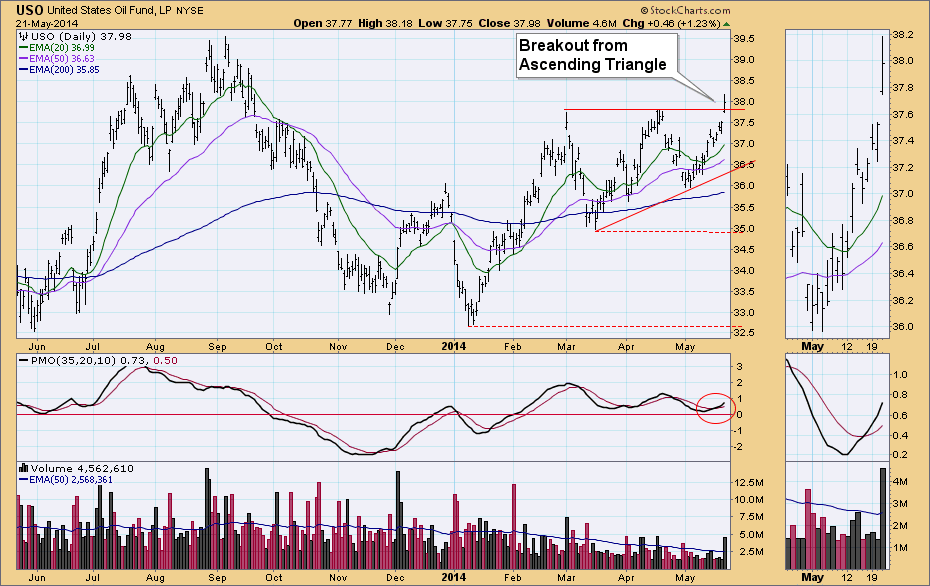
USO Breaks Out
by Erin Swenlin,
Vice President, DecisionPoint.com
Today, USO broke out above overhead resistance from the bullish ascending triangle. This move confirms the PMO BUY signal that was generated two days ago when the PMO crossed above its 10-EMA.
This breakout came on high volume which is positive. The next area of resistance would be at the...
READ MORE
MEMBERS ONLY

CRUDE OIL PRICES HIT CONTRACT HIGHS WHICH GIVES A BOOST TO ENERGY SHARES -- ENERGY SHARES HAVE BEEN 2014 LEADERS, BUT STILL LOOK CHEAP -- CHEVRON BOUNCES OFF CHART SUPPORT -- OCCIDENTIAL PETROLEUM NEARS BREAKOUT
by John Murphy,
Chief Technical Analyst, StockCharts.com
BRENT AND LIGHT CRUDE OIL FUTURES HIT NEW HIGHS... A government report showing a big drop in oil inventories last week has pushed oil prices to new highs. Chart 1 shows July Light Crude Oil closing climbing 1.74 today to trade at a new contract high near 1.04....
READ MORE
MEMBERS ONLY

Hello to all the StockCharts.com Subscribers!
by Martin Pring,
President, Pring Research
Hello Stockchart Subcribers!
My name is Martin Pring and I’m very excited to be joining the team at StockCharts.com! For those of you who may not be familiar with my work, I have been providing research to the international investment community since 1968. My professional analysis career was...
READ MORE
MEMBERS ONLY
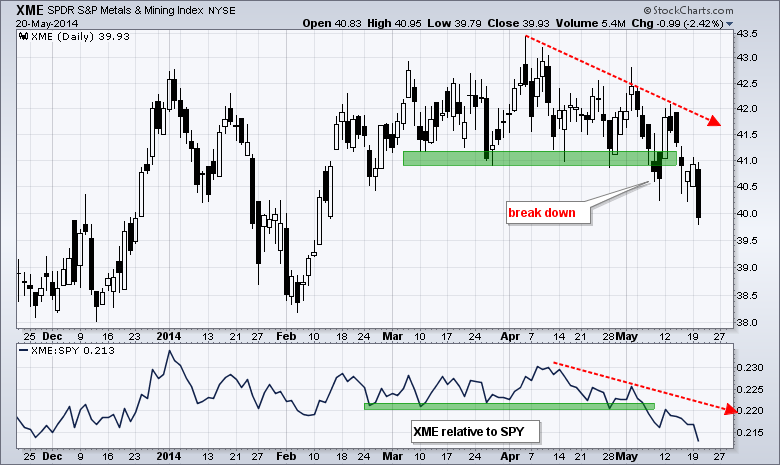
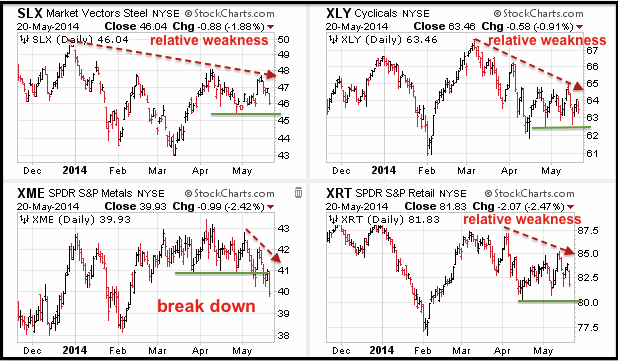
Metals & Miners SPDR Breaks Support and Shows Relative Weakness
by Arthur Hill,
Chief Technical Strategist, TrendInvestorPro.com
After stalling in March and April, the Metals & Miners SPDR (XME) turned lower in May and broke a key support zone. Notice how XME held the 41 area for two months and then broke this zone twice in May. The indicator window shows the price relative (XME:SPY ratio)...
READ MORE
MEMBERS ONLY
Retailers Weigh on Market, but SPY and QQQ Hold Up
by Arthur Hill,
Chief Technical Strategist, TrendInvestorPro.com
Stocks came under selling pressure with retailers leading the way lower. The Russell 2000 ETF and Russell MicroCap iShares lost around 1.5% on Tuesday. The S&P 500 SPDR and Nasdaq 100 ETF led up relatively well with losses of .63% and .36%, respectively. Yes, the song remains...
READ MORE
MEMBERS ONLY

MARKING KEY LEVELS FOR SPY AND QQQ BREADTH INDICATORS -- DJ AUTO INDEX FORMS LARGE CONTINUATION PATTERN -- FORD HOLDS BREAKOUT -- GM STALLS NEAR RESISTANCE -- GOLD SPDR FORMS BEARISH CONTINUATION PATTERN -- SILVER ETF STALLS NEAR WINTER LOWS
by John Murphy,
Chief Technical Analyst, StockCharts.com
MARKING KEY LEVELS FOR SPY AND QQQ BREADTH INDICATORS... Link for today's video. The breadth indicators for the Nasdaq 100 ETF and S&P 500 SPDR hit new highs this month and have yet to break down. Small-caps may be lagging and momentum names may be down...
READ MORE
MEMBERS ONLY
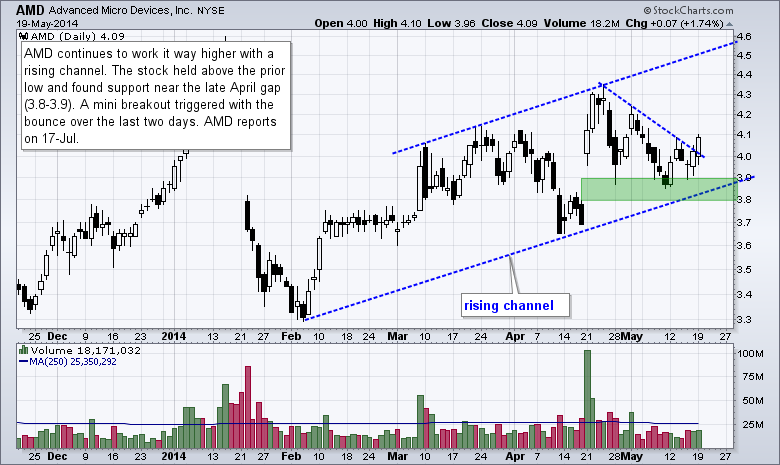
Charts: AMD, GLF, F, FAST, TWO
by Arthur Hill,
Chief Technical Strategist, TrendInvestorPro.com
Today's charts feature five setups in various groups. A little chip maker found support near its prior gap with a breakout the last two days. An offshore driller shows signs of buying pressure after a breakout. An auto maker bounces off support. An industrial supply stock firms near...
READ MORE
MEMBERS ONLY
Techs and Small-Caps Lead the Bounce
by Arthur Hill,
Chief Technical Strategist, TrendInvestorPro.com
Stocks rallied on Monday with techs and small-caps leading the way. The Russell 2000 ETF gained over 1% and the Nasdaq 100 Equal-Weight ETF advanced .85% on the day. Seven of the nine sector SPDRs were higher with technology, finance and consumer discretionary leading. Their gains, however, were quite modest...
READ MORE
MEMBERS ONLY
DecisionPoint Trackers: Timing Signals and Strength Rankings Across the Markets
by Erin Swenlin,
Vice President, DecisionPoint.com
Before there were scans, there were DecisionPoint Tracker Reports. While my scans are useful, the Tracker reports still provide some of the best timing and ranking information around to help you sniff out investment opportunities across the major indexes, ETFs, S&P 400, 500 & 600, mutual funds and...
READ MORE
MEMBERS ONLY

NASDAQ TURNS DULL AS BOLLINGER BANDS CONTRACT -- INTUIT LEADS SOFTWARE ETF HIGHER -- F5 LEADS NETWORKING ISHARES ABOVE FIRST RESISTANCE -- INTERNET ETF FIRMS AS GOOGLE BOUNCES OFF KEY MOVING AVERAGE -- ALTERA LEADS SEMICONDUCTOR SPDR WITH A GAP-BREAKOUT
by John Murphy,
Chief Technical Analyst, StockCharts.com
NASDAQ TURNS DULL AS BOLLINGER BANDS CONTRACT ... Link for today's video. The Technology SPDR (XLK) held up much better than the Nasdaq over the last few months and the performance contrast is quite stark. Chart 1 shows XLK challenging its early April high, while chart 2 shows the...
READ MORE
MEMBERS ONLY
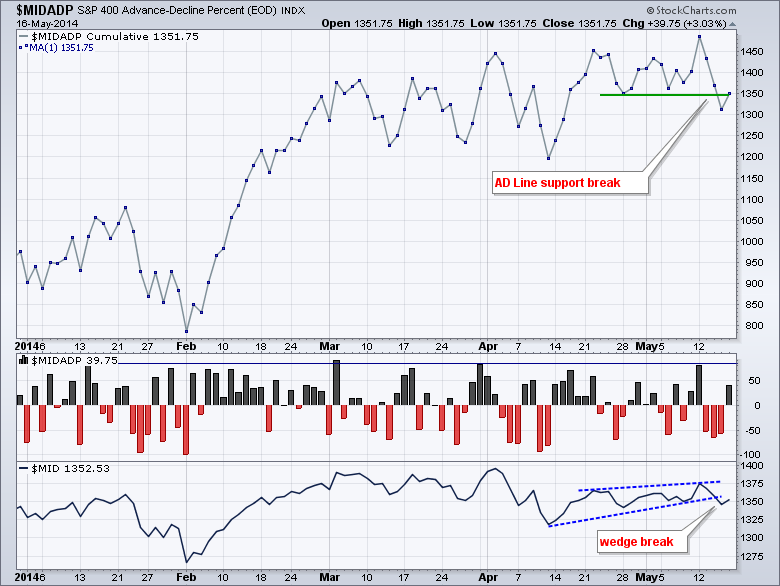
MidCap AD Line Breaks First Support
by Arthur Hill,
Chief Technical Strategist, TrendInvestorPro.com
Stocks remain mixed overall, but selling pressure is quietly spreading. The S&P 500 SPDR and Nasdaq 100 ETF continue to hold up well, but the Russell 2000 ETF and small-caps remain relatively weak. The market as a whole remains vulnerable as long as small-caps under perform. Note that...
READ MORE
MEMBERS ONLY
Small Caps: Turn Around Approaching?

by Tom Bowley,
Chief Market Strategist, EarningsBeats.com
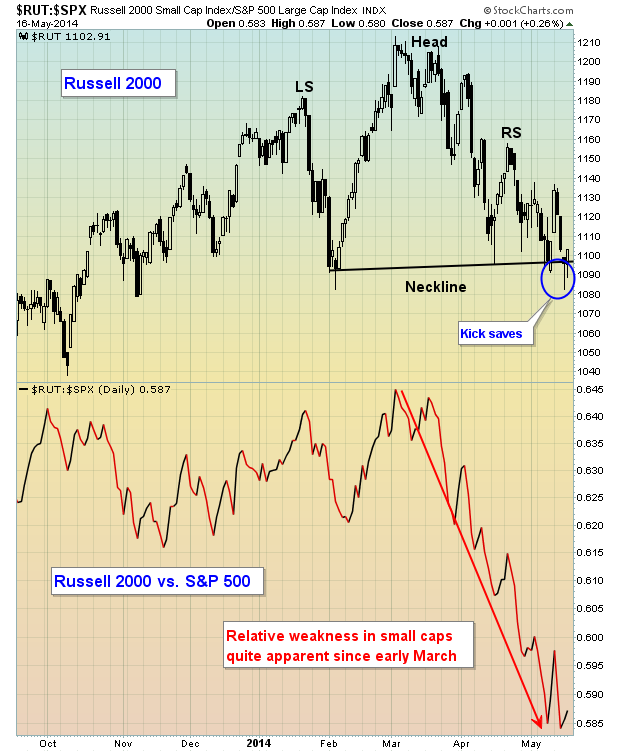
I've been very cautious about the stock market throughout most of 2014. There are warning signs galore. But the Russell 2000 has been hit particularly hard year-to-date, dropping approximately 10% from the high set in early March. That was the time when money began rotating away from many...
READ MORE
MEMBERS ONLY
A (Mostly) Complete List of This Year's New Features on StockCharts
Hello Fellow ChartWatchers!
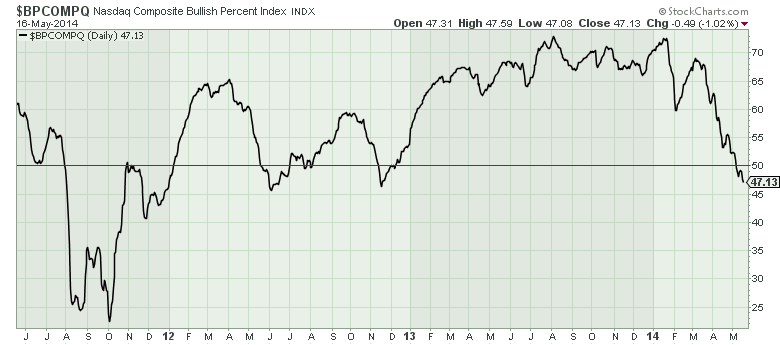
While the major averages were mixed last week with the Nasdaq up 0.5% and the Dow down 0.5%, in general the markets continued to weaken. Check out the Bullish Percent Index chart for the Nasdaq Composite:
It has continued to move lower even after crossing...
READ MORE
MEMBERS ONLY
A Comparison of Global Stocks Shows Unusual Divergences
by John Murphy,
Chief Technical Analyst, StockCharts.com
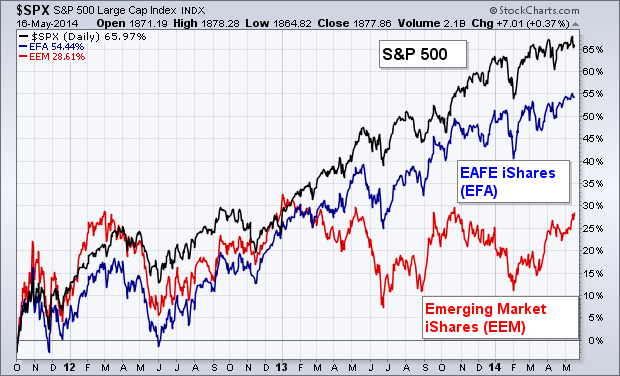
While U.S. stocks are starting to struggle on fears of high valuation, some money is starting to flow into foreign stocks that show better value. The chart below shows the S&P 500 doing better than foreign developed and emerging markets since the October 2011 bottom. During that...
READ MORE
MEMBERS ONLY

A COMPARISON OF GLOBAL STOCKS SHOWS UNUSUAL DIVERGENCES -- MONEY MAY BE STARTING TO ROTATE OUT OF THE U.S. INTO FOREIGN STOCKS, ESPECIALLY EMERGING MARKETS -- EMERGING MARKETS ISHARES MAY BE BREAKING OUT TO THE UPSIDE
by John Murphy,
Chief Technical Analyst, StockCharts.com
COMPARISON OF GLOBAL STOCK INDEXES ... While U.S. stocks are starting to struggle on fears of high valuation, some money is starting to flow into foreign stocks that show better value. Chart 1 shows the S&P 500 doing better than foreign developed and emerging markets since the October...
READ MORE
MEMBERS ONLY
10-Year Treasury Yields Fall to Seven-Month Low
by John Murphy,
Chief Technical Analyst, StockCharts.com
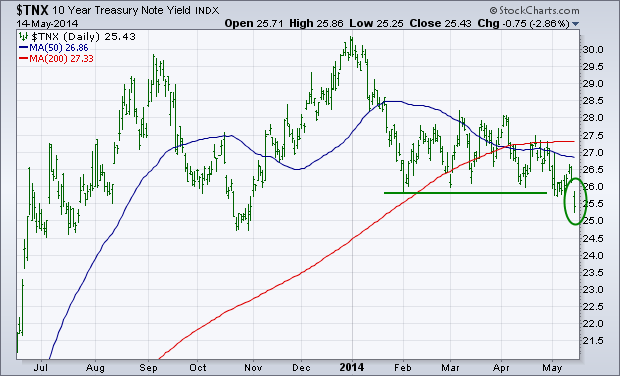
The first chart below shows the 10-Year Treasury Note Yield (TNX) falling below its early February low in trading on Wednesday. That puts the TNX at the lowest level since last October. Normally, a falling bond yield signals that investors are turning more pessimistic on the economy. That seems strange...
READ MORE
MEMBERS ONLY
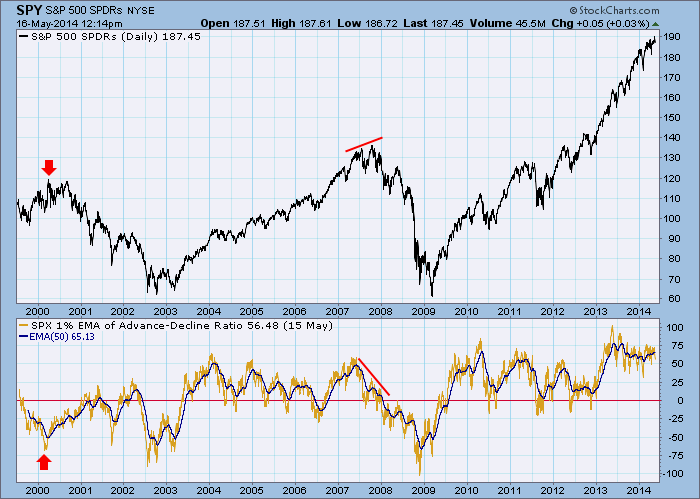
The 1% EMA A-D Index: A Long-Term Breadth Indicator
by Carl Swenlin,
President and Founder, DecisionPoint.com
Our focus is so often on the short term, but an awareness of what is happening longer-term is essential to getting a complete sense of market condition. One useful long-term indicator is what we call the 1% EMA of the Advance-Decline Ratio. I first learned of this indicator from Stan...
READ MORE
MEMBERS ONLY
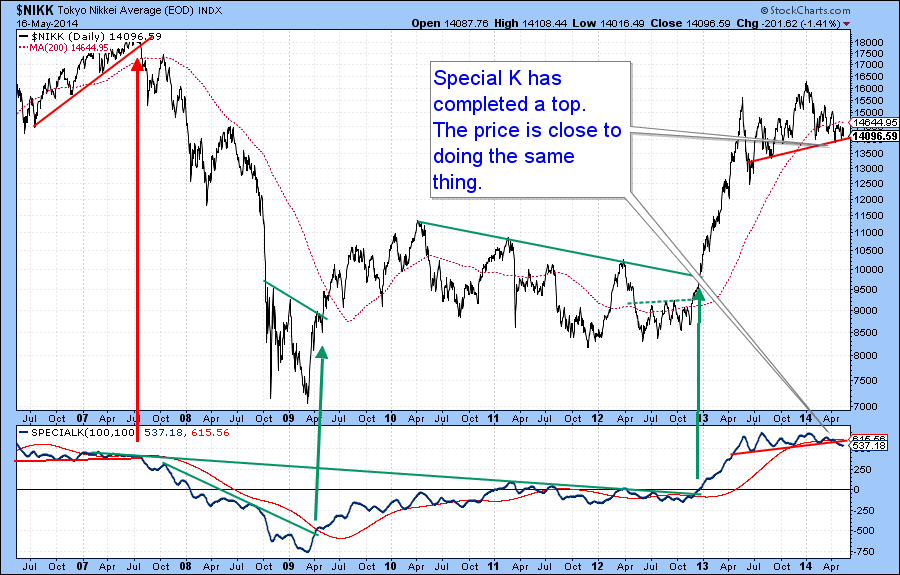
Are Japanese Equities Topping Out? If so, Will US Equities be Far Behind?
by Martin Pring,
President, Pring Research
* Japanese Equities May be on the Verge of a Major Breakdown.
* Yen Close to an Unexpected Upside breakout?
* Nikkei has led Every US Stock Market Peak Since 1990.
Normally Martin Pring's Market Roundup, the PMR, will give you a short-term synopsis of the US equity and bond markets...
READ MORE
MEMBERS ONLY
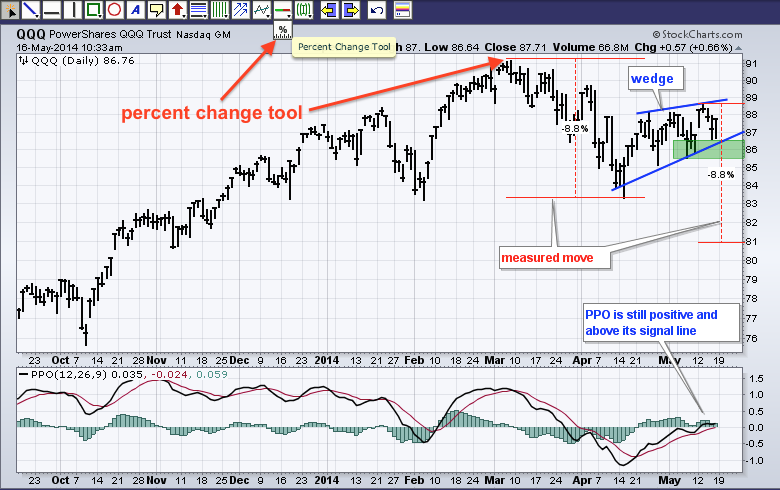
Another Wedge worth Watching
by Arthur Hill,
Chief Technical Strategist, TrendInvestorPro.com
As noted in ChartWatchers two weeks ago, rising wedges are appearing on some key charts and chartists should watch these closely for directional clues. Even though the rising wedge can be a bearish continuation pattern, keep in mind that the immediate trend is up as long as the wedge rises....
READ MORE
