MEMBERS ONLY
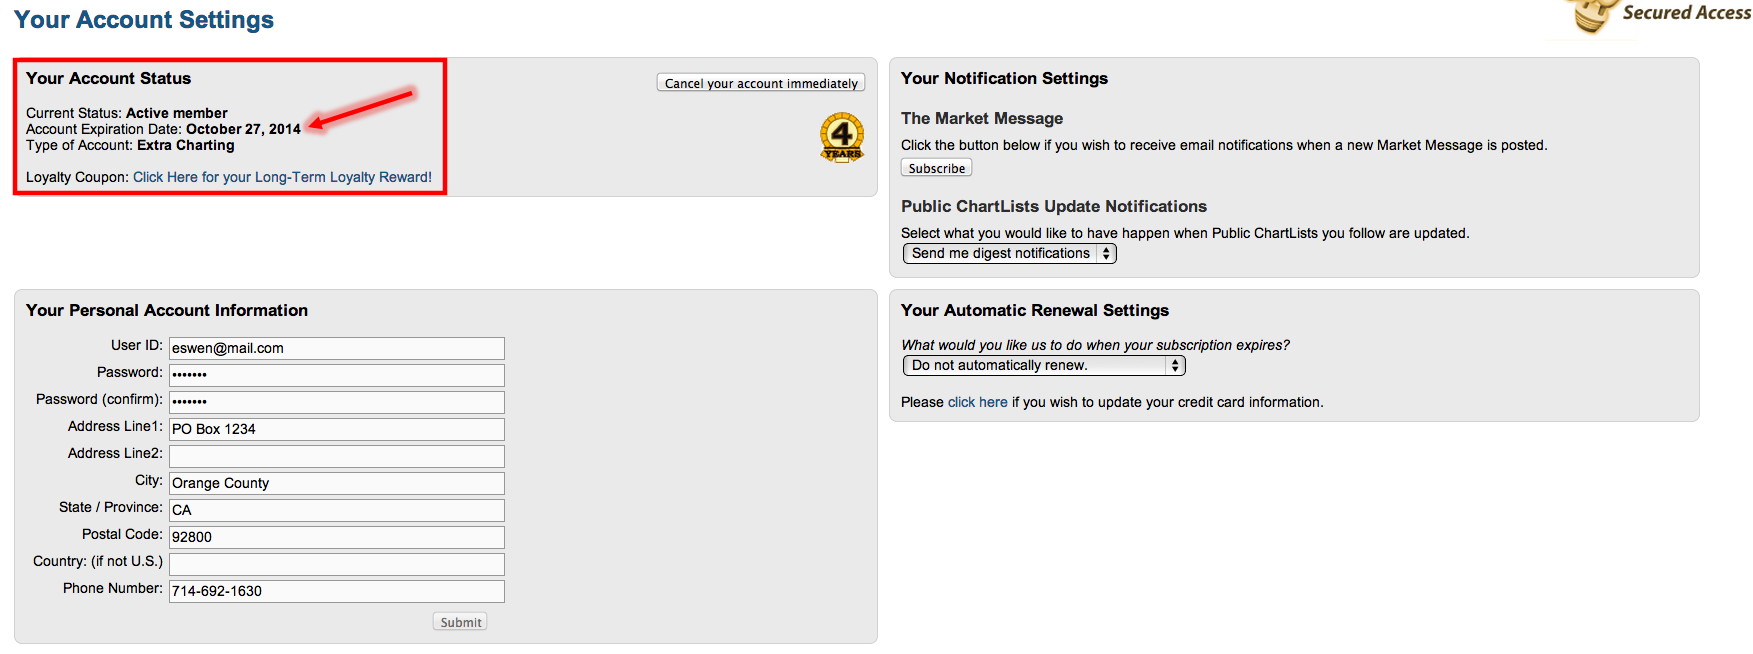
Don't Lose Your DecisionPoint Content! Renew Now!

by Erin Swenlin,
Vice President, DecisionPoint.com
This article is directed mainly at current DecisionPoint.com subscribers, but if you need information on how to renew your subscription, read on! As part of the merger between StockCharts.com and DecisionPoint.com, all DP subscribers were given complimentary "Extra" StockCharts membership accounts so that they could...
READ MORE
MEMBERS ONLY

QQQ AND MDY FORM BEARISH CONTINUATION PATTERNS -- HOUSING STARTS AND BUILDING PERMITS TICK HIGHER -- A VOLATILITY SQUEEZE HITS THE HOME CONSTRUCTION ISHARES -- PLUNGE IN YIELDS WEIGHS ON REGIONAL BANKS AND BROKERS

by John Murphy,
Chief Technical Analyst, StockCharts.com
QQQ AND MDY FORM BEARISH CONTINUATION PATTERNS... Bearish wedges are appearing on some key charts and chartists should watch these closely for directional clues. A bearish wedge is typically a continuation pattern that forms after a decline. Like a bear flag, bearish wedges slope up and represent a corrective bounce...
READ MORE
MEMBERS ONLY

Key Take-Aways from the 67th CFA Annual Conference: Part I

by Gatis Roze,
Author, "Tensile Trading"
During my investment life, I’ve attended well over 100 different conferences and seminars. The Chartered Financial Analysts four-day event in Seattle last week was the ‘gold standard’. With over 1800 attendees, the CFA Institute brought together a stellar collection of speakers, including my former professor, William F. Sharpe, a...
READ MORE
MEMBERS ONLY
Test Looms for SPY as TLT Surges to Highest Level of 2014

by Arthur Hill,
Chief Technical Strategist, TrendInvestorPro.com
Stocks took it on the chin Thursday with the major index ETFs falling across the board. Reading the financial media, one would have expected 2+ percent declines and blood in the street. The losses, however, where relatively modest and the Russell 2000 did not lead the way lower. The Dow...
READ MORE
MEMBERS ONLY

DOW JONES INDUSTRIAL AVERAGE FAILS TO HOLD BREAKOUT LEVEL -- S&P 500 FALLS BELOW SUPPORT AS WELL -- THE NASDAQ FINDS RESISTANCE AT THE 50 DMA -- NASDAQ COMPOSITE IS PART WAY THROUGH A POTENTIAL TOPPING STRUCTURE
by John Murphy,
Chief Technical Analyst, StockCharts.com
DOW JONES INDUSTRIAL AVERAGE FAILS TO HOLD BREAKOUT LEVEL... The Dow Jones Industrial Average ($DJIA) has been the strongest of the 4 main indexes recently. On Thursday, the Dow was unable to hold its breakout level. It pushed down to the 50 Day Moving Average (50 DMA). The rally which...
READ MORE
MEMBERS ONLY
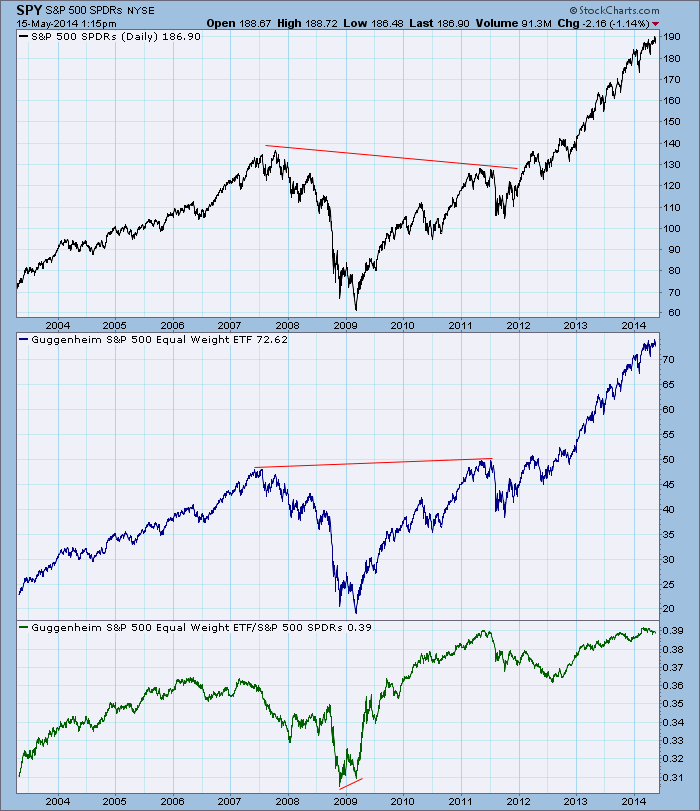
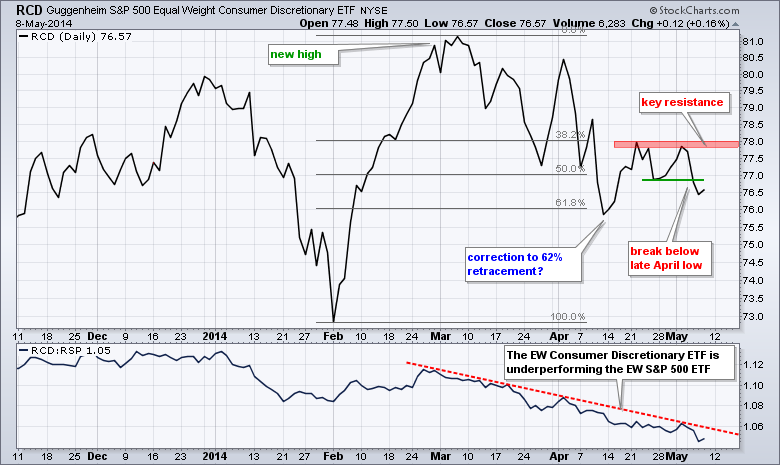
Expect Equal Weight Index Underperformance

by Carl Swenlin,
President and Founder, DecisionPoint.com
The recent emerging weakness in small-cap stocks should alert us to potential weakness in equal weight market/sector indexes. To demonstrate this point let's look at a comparison between SPY and the S&P 500 Equal Weight Index (RSP). But wait! How do we learn about small-cap...
READ MORE
MEMBERS ONLY
The New Neutral is Well Underway
by Arthur Hill,
Chief Technical Strategist, TrendInvestorPro.com
Pimco's Bill Gross called his new secular investment theme "the new neutral". Gross expects slow economic growth and low real interest rates over the next five years, and this will fuel the hunt for yield. We can already see the hunt for yield playing out in...
READ MORE
MEMBERS ONLY
IWM Traces out Bearish Continuation Pattern
by Arthur Hill,
Chief Technical Strategist, TrendInvestorPro.com
Small-caps once again led the market lower with the Russell 2000 ETF and Russell MicroCap iShares losing over 1.5% on the day. The Dow Diamonds and S&P 500 SPDR held up relatively well and lost around .5% on Wednesday. The offensive sectors led lower with the consumer...
READ MORE
MEMBERS ONLY
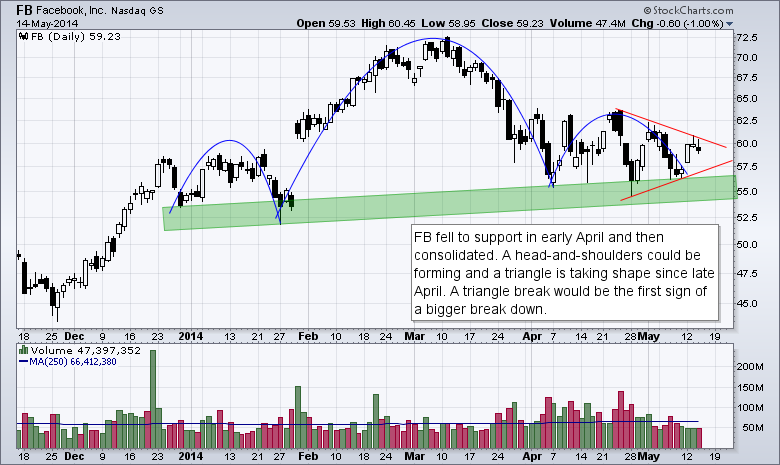
Chart Setups: FB, FLIR, POOL, PTC, Z
by Arthur Hill,
Chief Technical Strategist, TrendInvestorPro.com
Today's charts feature five setups in various groups. Facebook, the king of social networking, has a big reversal pattern taking shape. Flir Systems fell sharply and then formed a bearish continuation pattern. SCP Pool is suffering long with housing stocks and formed rising flag the last few weeks....
READ MORE
MEMBERS ONLY

DecisionPoint Market Recap and Expanded Market Summary
by Erin Swenlin,
Vice President, DecisionPoint.com
The last two days I filled you in on the DP Alert Daily Report and the DP Daily Update, both in the DP Reports blog. Today I'll cover the Market Recap and Expanded Market Summary Reports. Both are concise summaries of market action from not only today, but...
READ MORE
MEMBERS ONLY

10-YEAR T-NOTE YIELD FALLS TO SEVEN MONTH LOW -- THAT'S ANOTHER NEGATIVE DIVERGENCE FOR STOCKS -- ANOTHER NEGATIVE WARNING IS THAT HIGH YIELD BONDS ARE UNDERPERFORMING TREASURIES -- SMALL CAP WEAKNESS CONTINUES TO WEIGH ON MARKET
by John Murphy,
Chief Technical Analyst, StockCharts.com
10-YEAR TREASURY YIELDS FALL TO SEVEN-MONTH LOW... Chart 1 shows the 10-Year Treasury Note Yield (TNX) falling below its early February low in today's trading. That puts the TNX at the lowest level since last October. Normally, a falling bond yield signals that investors are turning more pessimistic...
READ MORE
MEMBERS ONLY
XSD Triangulates - UUP Breaks Free - TLT Bounces within Uptrend
by Arthur Hill,
Chief Technical Strategist, TrendInvestorPro.com
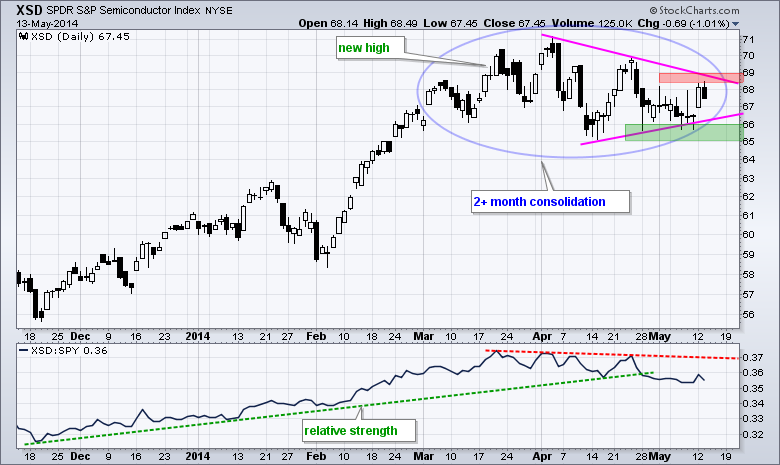
Stocks were mixed on Tuesday with the Russell 2000 ETF (IWM) falling around 1% and the S&P 500 SPDR (SPY) advancing .1% on the day. Eight of the nine sector SPDRs were up, and just one down. The gains were small with the Energy SPDR (XLE) leading the...
READ MORE
MEMBERS ONLY

The DP Alert Daily Report - One Stop For Market Posture and Timing Signals
by Erin Swenlin,
Vice President, DecisionPoint.com
DecisionPoint.com has been providing table/spreadsheet reports for years. Each report provides a complete review of the market day, in addition to comparisons to previous days and to other indexes and sectors. In a glance you can see numerically what the market has accomplished as well as the actual...
READ MORE
MEMBERS ONLY

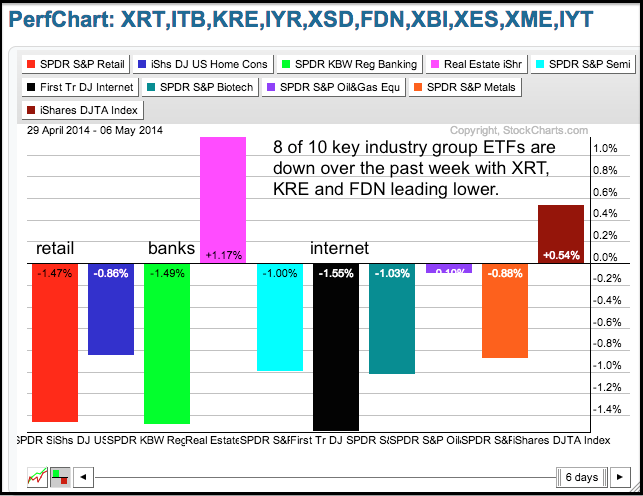
CONSUMER DISCRETIONARY SECTOR REMAINS THE WEAKEST LINK -- EW CONSUMER DISCRETIONARY ETF BOUNCES OFF TREND LINE -- RETAIL ETFS SURGE TO ESTABLISH KEY SUPPORT LEVELS -- RAILROAD INDEX CONSOLIDATES WITHIN UPTREND
by John Murphy,
Chief Technical Analyst, StockCharts.com
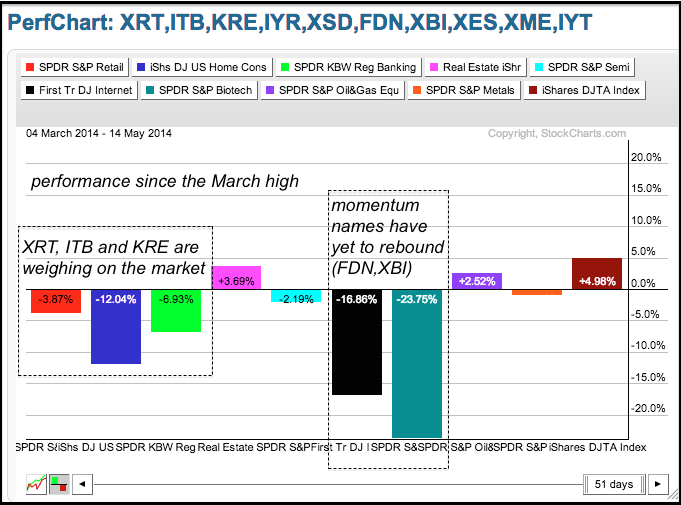
CONSUMER DISCRETIONARY SECTOR REMAINS THE WEAKEST LINK... Link for today's video. Weakness in retailers and homebuilders weighed on the consumer discretionary sector and caused it to be the worst performing sector over the last three months. PerfChart 1 shows performance for the nine sectors since February 12th (three...
READ MORE
MEMBERS ONLY
SPY Challenges Prior High - GLD Remains with Bearish Pattern
by Arthur Hill,
Chief Technical Strategist, TrendInvestorPro.com
Stocks surged with a broad-based rally led by small-caps. The Russell 2000 ETF and the Russell MicroCap iShares gained over 2%, while the Dow Diamonds and S&P 500 SPDR gained less than 1%. It was a lopsided rally, but a little relative strength in small-caps is positive overall....
READ MORE
MEMBERS ONLY
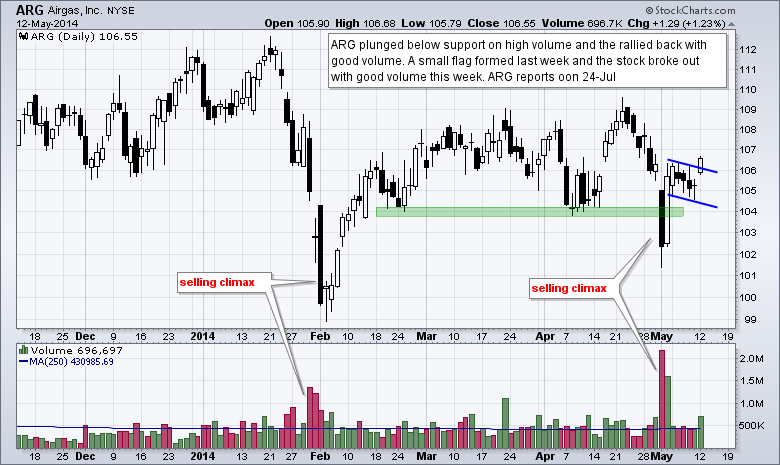
Charts: ARG, BBT, IMMR, JBP, UAL
by Arthur Hill,
Chief Technical Strategist, TrendInvestorPro.com
Today's charts feature five setups in various groups. Air Gas recovered from a support break and broke flag resistance. BB&T, a regional bank, held above its February low and bounced on good volume the last two days. Immersion continues to toy with support as it gapped...
READ MORE
MEMBERS ONLY
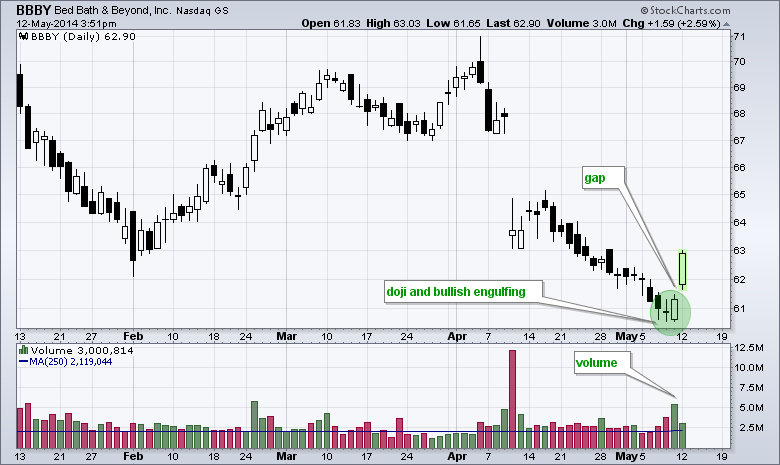
Bed Bath & Beyond Follows Bullish Candle with Gap
by Arthur Hill,
Chief Technical Strategist, TrendInvestorPro.com
Bed Bath & Beyond (BBBY), which is part of the important retail group, is showing strength with a gap and surge. Notice that this gap-surge came after the stock formed a doji and then a bullish engulfing. The doji signals indecision and the bullish engulfing is a bullish candlestick reversal...
READ MORE
MEMBERS ONLY
DecisionPoint Daily Blog Now On StockCharts.com!
by Erin Swenlin,
Vice President, DecisionPoint.com
I received numerous emails and concerns throughout this DP to StockCharts transition period from DecisionPoint subscribers regarding the possible loss of the DP Daily Blog. I'm happy to report that it has been moved to the StockCharts.com blog section under "DP Reports". It has a...
READ MORE
MEMBERS ONLY

QQQ CHALLENGES RESISTANCE AS IWM SURGES OFF SUPPORT -- REGIONAL BANK SPDR PLOWS THROUGH TREND LINE -- INTERNET ETF SURGES TOWARDS TREND LINE RESISTANCE -- BIOTECH ISHARES GETS A BULLISH AROON SIGNAL -- COPPER MINERS ETF FORMS BULLISH REVERSAL PATTERN
by John Murphy,
Chief Technical Analyst, StockCharts.com
QQQ CHALLENGES RESISTANCE AS IWM SURGES OFF SUPPORT... Link for today's video. The market surged on Monday with the Dow Industrials hitting a new high and the S&P 500 challenging its early April high. Despite a new high in the Dow, today's big story...
READ MORE
MEMBERS ONLY
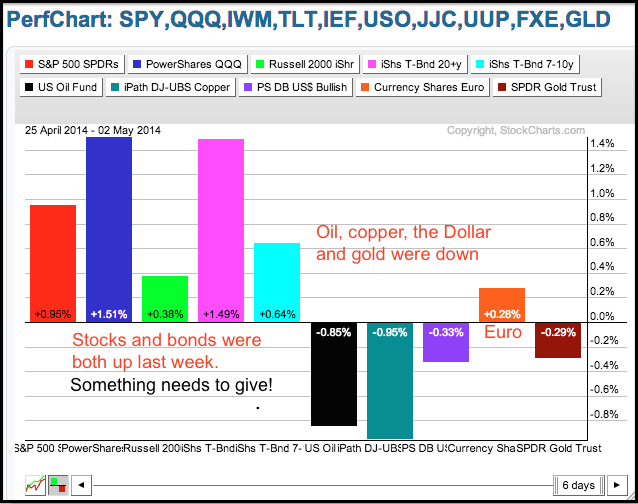
SPY Maintains Upward Bias - UUP Triggers a Bear Trap
by Arthur Hill,
Chief Technical Strategist, TrendInvestorPro.com
Not much happened in the stock market last week. The Dow Diamonds advanced .59%, the Nasdaq 100 ETF fell .79%, the S&P 500 SPDR decline just .05% and the Russell 2000 ETF lost 1.79%. The nine sector SPDRs were split with four up and five down. The...
READ MORE
MEMBERS ONLY

DOW AND S&P 500 END WEEK NEAR OLD HIGHS -- WHILE WEAKER NASDAQ AND SMALL CAP INDEXES TRY TO STAY ABOVE CHART SUPPORT -- STRONGER HOMEBUILDERS WOULD MAKE MS. YELLEN FEEL BETTER -- TREASURY YIELDS AND THE DOLLAR BOUNCE
by John Murphy,
Chief Technical Analyst, StockCharts.com
DOW AND S&P 500 END WEEK NEAR OLD HIGHS ... Today's message reads like a tale of two markets. Large cap blue chip indexes turned in a good week and are near record highs. Chart 1 shows the Dow Industrials bouncing off their 50-day average on Wednesday...
READ MORE
MEMBERS ONLY
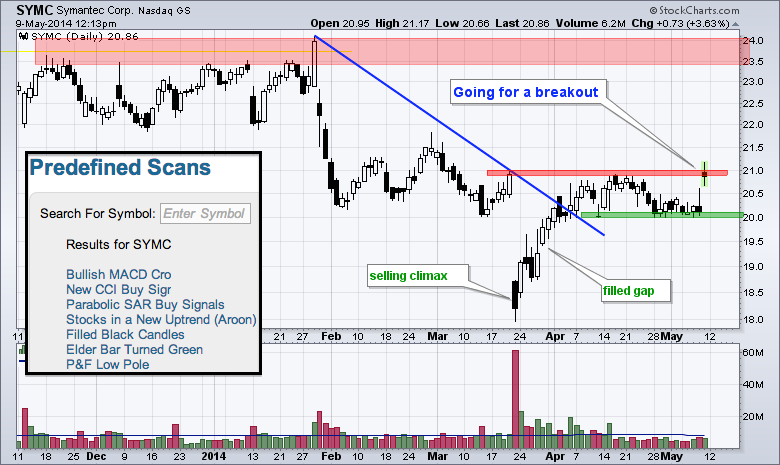
Symantec Goes for a Breakout With Multiple Scan Signals
by Arthur Hill,
Chief Technical Strategist, TrendInvestorPro.com
Symantec is popping after reporting earnings on Thursday. The chart below shows the stock with a selling climax in mid March, a recovery into early April and a consolidation the last few weeks. With today's gap, the stock is on the verge of a consolidation breakout. The left...
READ MORE
MEMBERS ONLY

S&P 500 AD LINE HITS NEW HIGH -- S&P MIDCAP SPDR STALLS WITH RISING WEDGE -- S&P SMALLCAP ISHARES CHANNELS LOWER -- FINANCE SECTOR BULLISH PERCENT INDEX SURGES -- PRUDENTIAL TRIGGERS P&F BUY SIGNAL -- THE YIELD CURVE REMAINS POSITIVE AND STEEP
by John Murphy,
Chief Technical Analyst, StockCharts.com
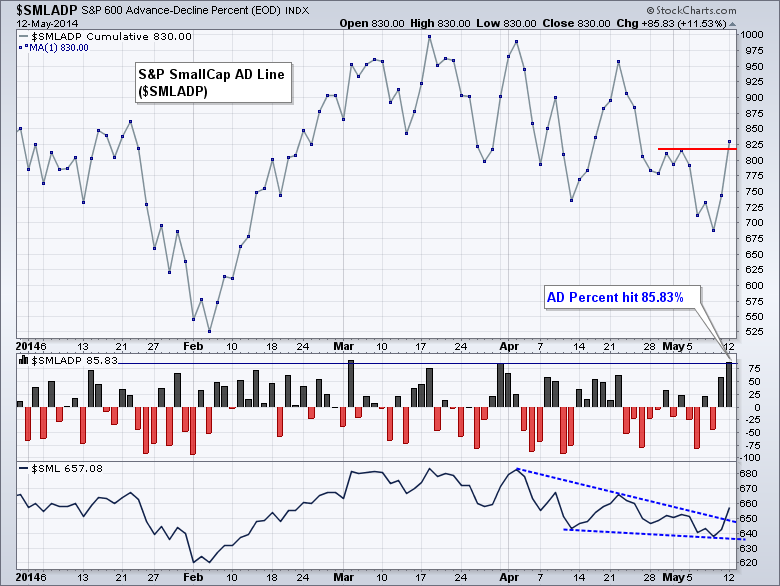
S&P 500 AD LINE HITS NEW HIGH... Link for today's video. The market remains split with large-caps holding up well since early March and small gaps moving lower the last two months. Mid-caps are caught somewhere in the middle and may ultimately tip the balance. Chart...
READ MORE
MEMBERS ONLY

Tensile Trading ChartPack Version 3.0: 95 Upgrades to Help You Invest Smarter with Less Effort
by Gatis Roze,
Author, "Tensile Trading"
The markets, charts and indicators can be very messy. The ChartPack removes that messiness. It does all the heavy lifting, ensuring that you maximize your analysis and minimize your time. It’s the next best thing to seeing around the corner.
This is an invitation to the 500-plus investors who...
READ MORE
MEMBERS ONLY
QQQ Holds Wedge Break - Consumer Discretionary Weighs on Market
by Arthur Hill,
Chief Technical Strategist, TrendInvestorPro.com
The bulls tried to rally the market in early trading, but the early gains failed to hold as stocks moved lower in the afternoon. Once again, the Russell 2000 ETF and Russell MicroCap iShares led the way lower. The Nasdaq 100 ETF, Dow Diamonds and S&P 500 SPDR...
READ MORE
MEMBERS ONLY
Revisiting the PMO Watch List - Looking Good!
by Erin Swenlin,
Vice President, DecisionPoint.com
About a week ago I wrote a blog article that looked at momentum changes that I picked up from my favorite PMO scan. The charts were interesting but needed confirmation of the momentum change with a breakouts and/or PMO BUY signals. I checked these charts out again and they...
READ MORE
MEMBERS ONLY
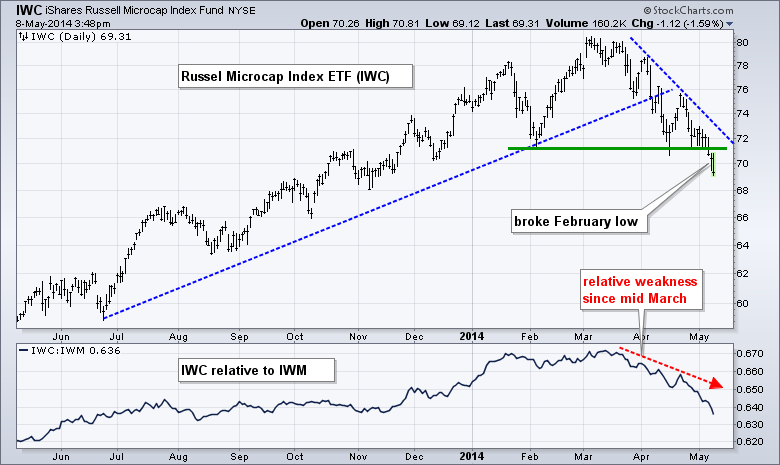
Russell MicroCap iShares Underperforms Russell 2000 ETF
by Arthur Hill,
Chief Technical Strategist, TrendInvestorPro.com
Small-caps are underperforming large-caps and microcaps are underperforming small-caps. Microcaps are similar to the momentum names in that they represent the high beta end of the stock market. The chart below shows the Russell MicroCap iShares (IWC) breaking below its February low with a 14% decline. The indicator window shows...
READ MORE
MEMBERS ONLY

$NDX BULLISH PERCENT TURNS UP -- OTHER INTERNAL NASDAQ INDICATORS REACH SELLING REVERSAL LEVELS -- THE 50:200 RATIO ALSO SUGGESTS WE ARE NEAR THE LOWS -- TIME SPAN FOR MARKET PULLBACK IS SIMILAR -- THE HIGH FLYERS ARE STILL DRIFTING
by John Murphy,
Chief Technical Analyst, StockCharts.com
$NDX BULLISH PERCENT TURNS UP... The Nasdaq Exchange has been one of the hardest hit in the latest downturn. While the Dow Jones Industrial Average ($INDU) was hitting new highs and the S&P 500 ($SPX) kept retesting the 1885 level, the Nasdaq Composite ($COMPQ) kept dropping as shown...
READ MORE
MEMBERS ONLY
SPY Forms Bull Flag - GLD Forms Bearish Continuation Pattern
by Arthur Hill,
Chief Technical Strategist, TrendInvestorPro.com
Stocks opened weak, firmed and rallied into the close. The major index ETFs finished with modest gains, but the Nasdaq 100 ETF closed slightly lower. The Finance SPDR and Utilities SPDR led the sectors higher. The Consumer Discretionary SPDR fell as the Retail SPDR declined around 1%. Weakness in retail...
READ MORE
MEMBERS ONLY
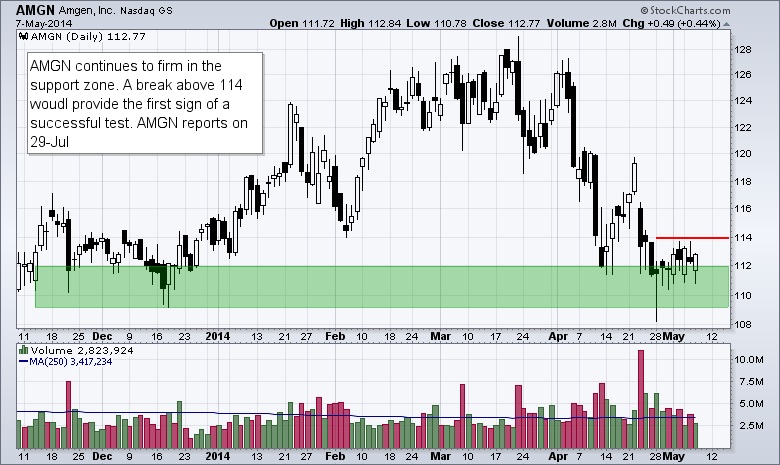
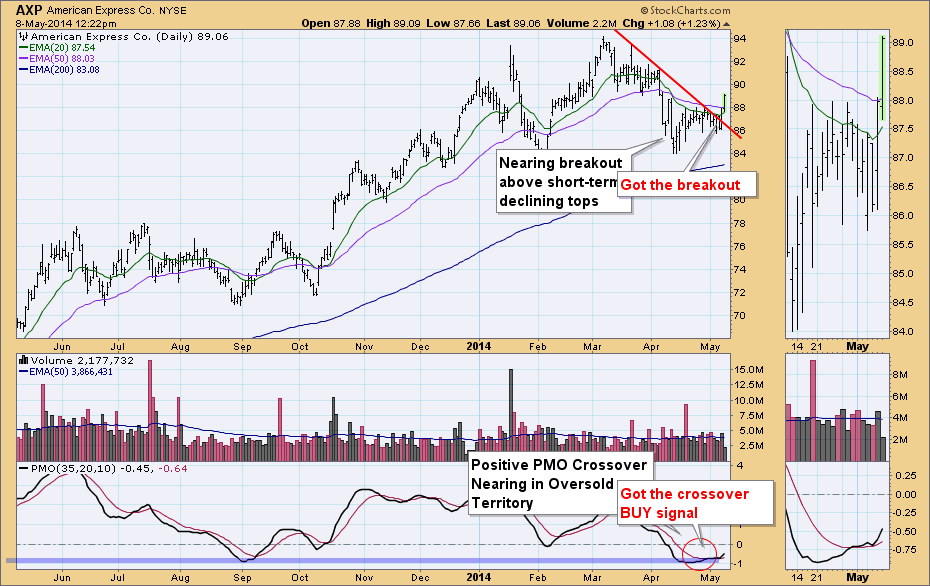
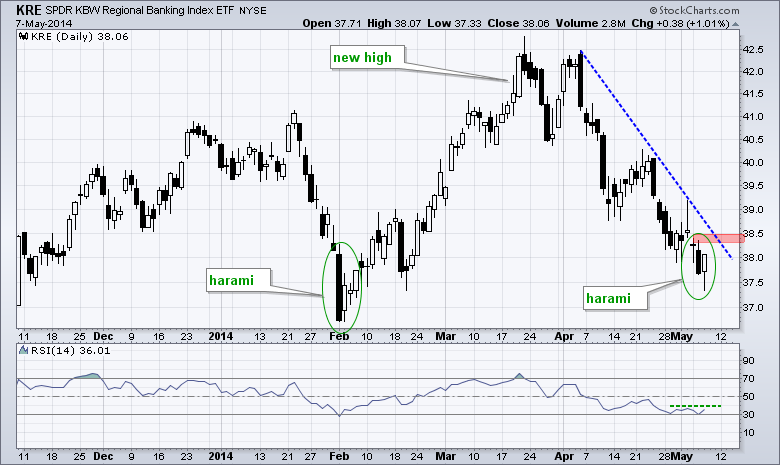
Chart Setups: AMGN, AXP, MSFT, PBCT, RF, TTGT
by Arthur Hill,
Chief Technical Strategist, TrendInvestorPro.com
Today charts feature three stocks from the finance sector, two from the tech sector and a biotech. Buying pressure is showing up in American Express over the last three days. Regional banks PBCT and RF are firming at key retracement. Microsoft formed a bullish candlestick in a support zone. Target...
READ MORE
MEMBERS ONLY
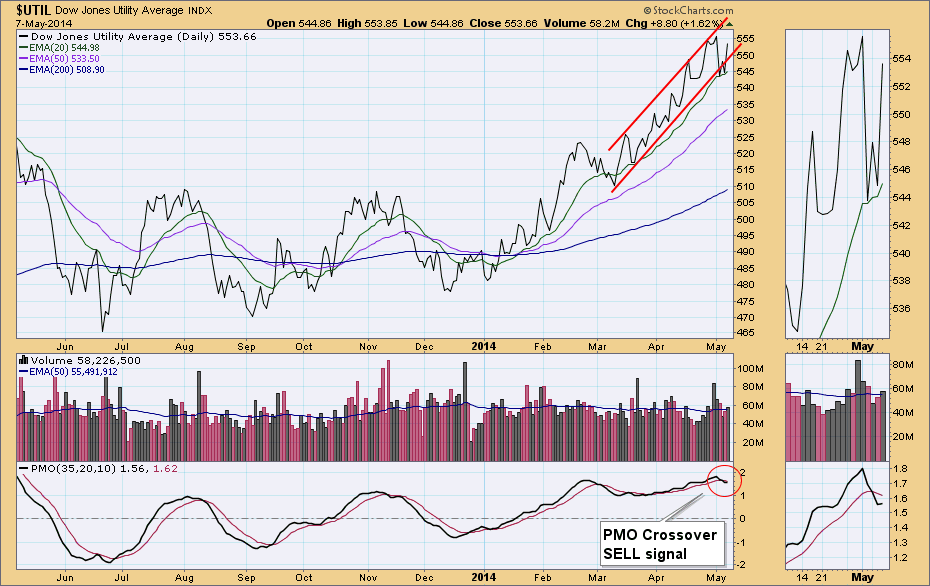
Equal-Weight Utilities ETF (RYU) Hits All-Time Closing High
by Erin Swenlin,
Vice President, DecisionPoint.com
The Utilities sector in general has been doing well with price traveling higher and higher within a rising trend channel since mid-March. In the past few weeks, price did falter and break slightly below the trend channel, but it has recuperated and it stayed above its 20-EMA. The PMO during...
READ MORE
MEMBERS ONLY

FALLING TREASURY YIELDS AND A WEAKER DOLLAR ARE HELPING BOOST EMERGING MARKET BONDS, CURRENCIES, AND STOCKS
by John Murphy,
Chief Technical Analyst, StockCharts.com
TREASURY YIELD AND DOLLAR REMAIN WEAK... Treasury bond yields continue to weaken. Chart 1 shows the 10-Year Treasury Note Yield ($TNX) trading below its 50- and 200-day moving averages and just a couple of tics above its early February low. A drop below that earlier level would put the TNX...
READ MORE
MEMBERS ONLY
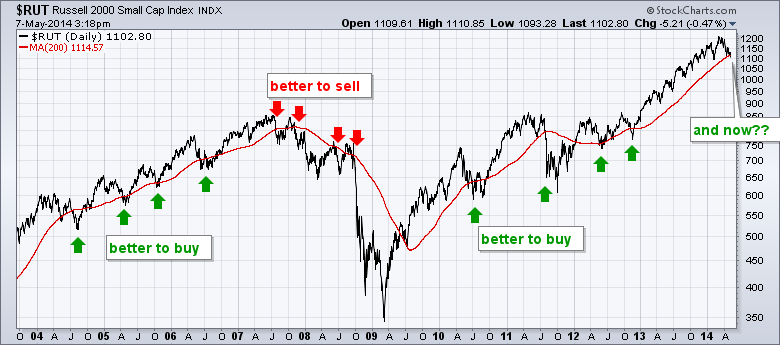
Russell 2000 Breaks 200-day. Is it a Buy Signal or Sell Signal?
by Arthur Hill,
Chief Technical Strategist, TrendInvestorPro.com
For the first time in over a year, the Russell 2000 closed below its 200-day moving average. This may seem like a long-term sell signal, but it really depends on the bigger trend. Notice how one would have been better off buying on breaks below the 200-day in 2004, 2005...
READ MORE
MEMBERS ONLY
SPY Breaks Trend line as QQQ Tests Wedge Support
by Arthur Hill,
Chief Technical Strategist, TrendInvestorPro.com
After opening weak and recovering on Monday, stocks opened slightly lower and declined on Tuesday. I consider a weak open and steady decline more negative because it suggests consistent selling pressure. The Russell 2000 ETF (IWM) and Russell MicroCap iShares (IWC) led the market lower. Relative weakness in small and...
READ MORE
MEMBERS ONLY
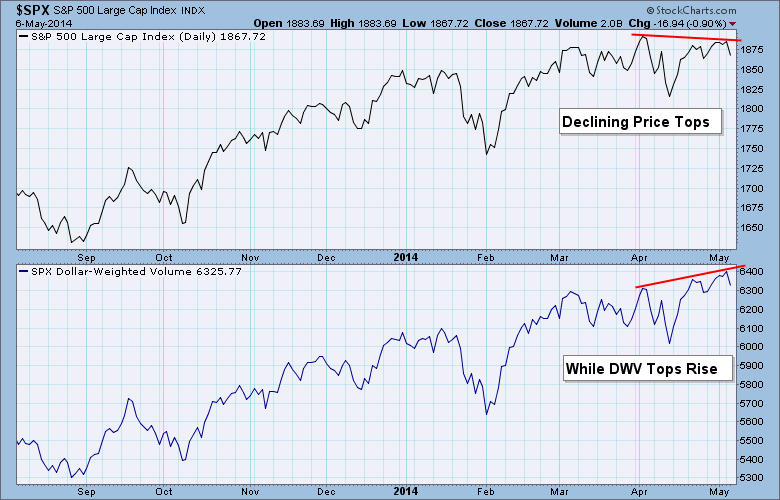
Bearish: Dollar-Weighted Volume Rises While Prices Fall
by Erin Swenlin,
Vice President, DecisionPoint.com
Over 10 years ago, Carl Swenlin developed an indicator called Dollar-Weighted Volume (DWV). DWV is variation of On-Balance Volume (OBV), which was developed by the late Joe Granville. DWV is calculated by multiplying the daily volume of each stock in a given market index by the closing price, then adding...
READ MORE
MEMBERS ONLY

SEMICONDUCTOR SPDR TESTS SUPPORT AS QQQ HITS RESISTANCE -- CONSUMER DISCRETIONARY SPDR STALLS AT RESISTANCE -- MATERIALS SPDR GOES FOR DIAMOND BREAKOUT -- HEALTHCARE PROVIDERS ETF BOUNCES NEAR KEY RETRACEMENT
by John Murphy,
Chief Technical Analyst, StockCharts.com
SEMICONDUCTOR SPDR TESTS SUPPORT AS QQQ HITS RESISTANCE... Link for today's video. As noted in prior commentaries, there is a certain dichotomy at work among the ETFs and indices in the stock market. For example, the Nasdaq and Russell 2000 are bouncing off support, but the S&...
READ MORE
MEMBERS ONLY
SPY Holds Breakout as XLF Recovers after Weak Open
by Arthur Hill,
Chief Technical Strategist, TrendInvestorPro.com
The major index ETFs opened weak, but firmed in the first thirty minutes and bounced to close virtually unchanged. The overall results were mixed with the Nasdaq 100 ETF advancing .53% on the day and the Russell 2000 ETF (IWM) closing .12% lower. Despite mixed results at the end, it...
READ MORE
MEMBERS ONLY
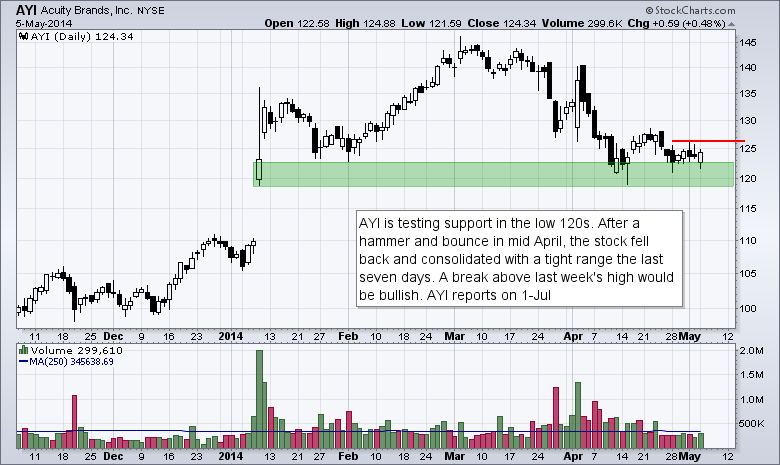
Charts: AYI, BMY, FLEX, UNH, USB
by Arthur Hill,
Chief Technical Strategist, TrendInvestorPro.com
AYI Tests Support Zone.
BMY Bounces off Big Support.
FLEX Forms Big Bull Flag.
UNH Firms with Large Spinning Top.
USB Finds Support near Key Retracement.
Video is not available at the moment because we moved to a new blogging platform over the last few days. We are working on...
READ MORE
MEMBERS ONLY

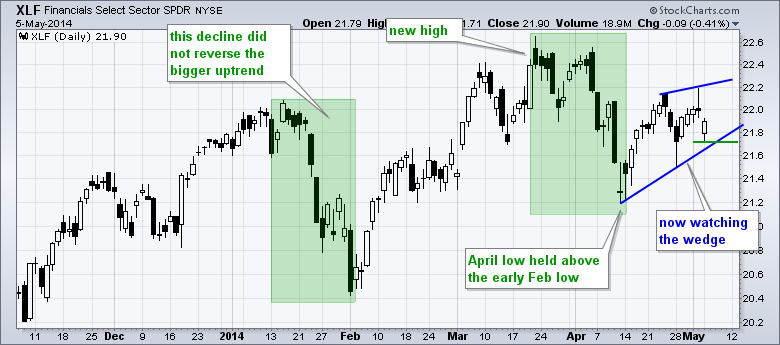
S&P 500 AND DOW CONSOLIDATE AT RESISTANCE -- RUSSELL 2000 AND THE NASDAQ TRIANGULATE NEAR SUPPORT -- JP MORGAN FOLLOWS BANK OF AMERICA WITH A GAP DOWN -- FINANCE SECTOR TESTS WEDGE TREND LINE -- INSURANCE ROCKS, WHILE REGIONAL BANKS FAIL
by John Murphy,
Chief Technical Analyst, StockCharts.com
S&P 500 AND DOW CONSOLIDATE AT RESISTANCE... Link for today's video. The S&P 500 and Dow Industrials are the two strongest indices in the stock market, but both are hitting resistance and stalling the last few days. Chart 1 shows the S&P...
READ MORE
MEMBERS ONLY
GLD Goes for a Breakout as TLT Hits a New High
by Arthur Hill,
Chief Technical Strategist, TrendInvestorPro.com
Nothing much changed last week. SPY broke flag resistance and continued to lead the major index ETFs. IWM remains in a downtrend and formed a rising wedge, which could be a bearish continuation pattern. The markets shrugged off good economic news and closed weak on Friday. Perhaps Ukraine fears kept...
READ MORE