MEMBERS ONLY
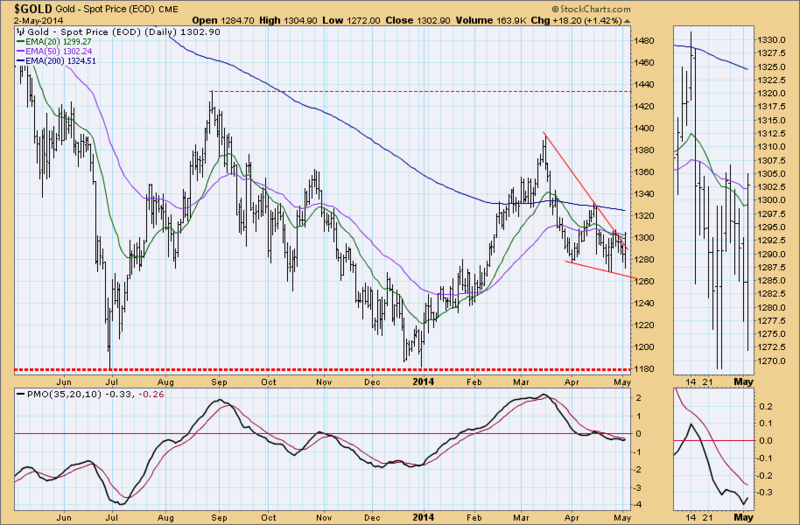
Gold Breaks Out of Falling Wedge

by Carl Swenlin,
President and Founder, DecisionPoint.com
Gold broke out of its recent falling wedge pattern, which is the normal expectation for that pattern.
The weekly chart shows price sliding down the declining tops line. Nice that it is staying on top of the line, but it needs to reverse direction.
Despite the breakout, as of 4/...
READ MORE
MEMBERS ONLY
Tracking Down Great Stocks with DP Trackers
Hello Fellow ChartWathcers!
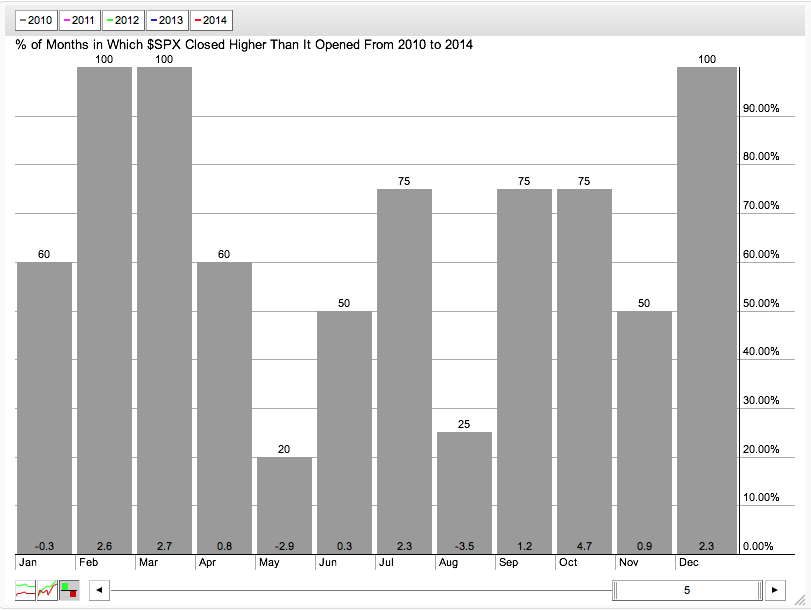
April ended on a fairly positive note with all of the major US average up about 1% for the week. That comes as we head into what has been - at least over the last 5 years - the worst month of the year for the S&...
READ MORE
MEMBERS ONLY
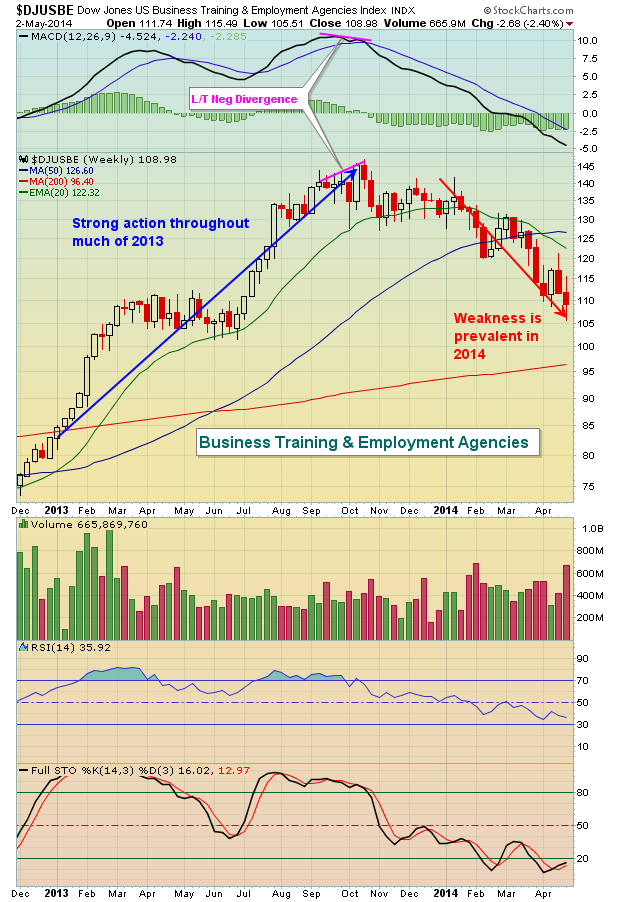
Cyclicals Not Worth The Gamble

by Tom Bowley,
Chief Market Strategist, EarningsBeats.com
In 2013, market participants couldn't get enough of cyclicals, or consumer discretionary stocks. The XLY (ETF that tracks consumer discretionary) rose more than 40% in 2013 to lead all sectors on a relative basis. But things have changed in 2014, with many of the strong industry groups in...
READ MORE
MEMBERS ONLY
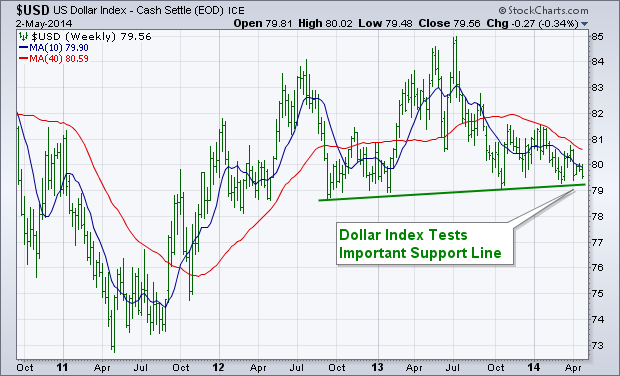
U.S. Dollar is Testing Important Support Line

by John Murphy,
Chief Technical Analyst, StockCharts.com
The dollar has been weakening since the start of the year, and is now in the process of testing some important chart support. The weekly bars in the chart below show the U.S. Dollar Index ($USD) testing a support line drawn under 2012-2013 lows. A decisive close below that...
READ MORE
MEMBERS ONLY

HOMEBUILDERS MAY BE GETTING A LIFT FROM STRONGER LUMBER PRICE AND FALLING BOND YIELDS -- A DOLLAR BREAKDOWN WOULD FAVOR FOREIGN MARKETS RELATIVE TO THE U.S. -- EURO IS TESTING MAJOR TRENDLINE RESISTANCE WHILE THE POUND HITS FIVE-YEAR HIGH
by John Murphy,
Chief Technical Analyst, StockCharts.com
BOUNCE IN LUMBER MAY HELP HOMEBUILDERS... My April 23 message showed the Dow Jones U.S. Home Construction iShares (ITB) testing support at its 200-day moving average. The homebuilding ETF bounced off that support line this week (see circle). A weak housing sector has been a drag on the economy...
READ MORE
MEMBERS ONLY
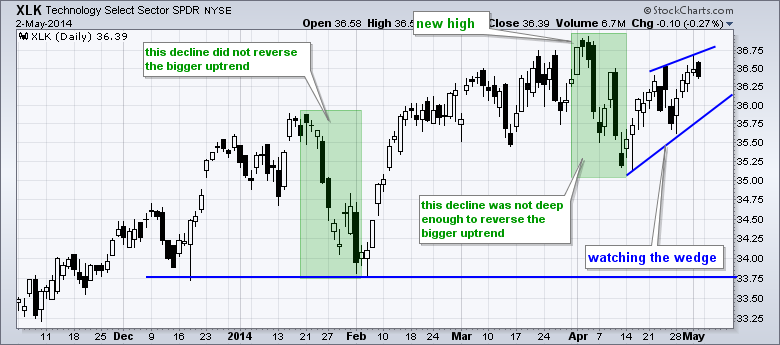
Watching the Wedges in Finance and Technology

by Arthur Hill,
Chief Technical Strategist, TrendInvestorPro.com
The Technology SPDR (XLK) and the Finance SPDR (XLF) remain in uptrends overall, but Friday's intraday reversal could signal a near term peak and result in a bearish wedge. The first chart shows XLK hitting a new high in early April and then declining below 35.25 with...
READ MORE
MEMBERS ONLY

EQUAL-WEIGHT S&P 500 ETF CONSOLIDATES WITHIN UPTREND -- HOME CONSTRUCTION ISHARES BOUNCES WITHIN WEDGE -- DR HORTON, LENNAR AND US GYPSUM LIFT HOMEBUILDER GROUP -- DEFINING THE SECULAR TRENDS FOR THE S&P 500 AND NASDAQ 100
by John Murphy,
Chief Technical Analyst, StockCharts.com
EQUAL-WEIGHT S&P 500 ETF CONSOLIDATES WITHIN UPTREND... Link for today's video. What a boring week. The Fed policy statement came and went. The bulk of earnings have come and gone. A slew of economic reports hit the wires. The employment report has come and gone. We...
READ MORE
MEMBERS ONLY

How the Markets Have Changed Me Over the Past 25 Years: Part I

by Gatis Roze,
Author, "Tensile Trading"
As I’ve revisited my trading journals from many years ago, I’ve come to realize what an unbelievable transformative journey it has been from part-time investor to full-time trader. I am somewhat startled by the personal evolution I’ve undergone with respect to both the markets and my personal...
READ MORE
MEMBERS ONLY
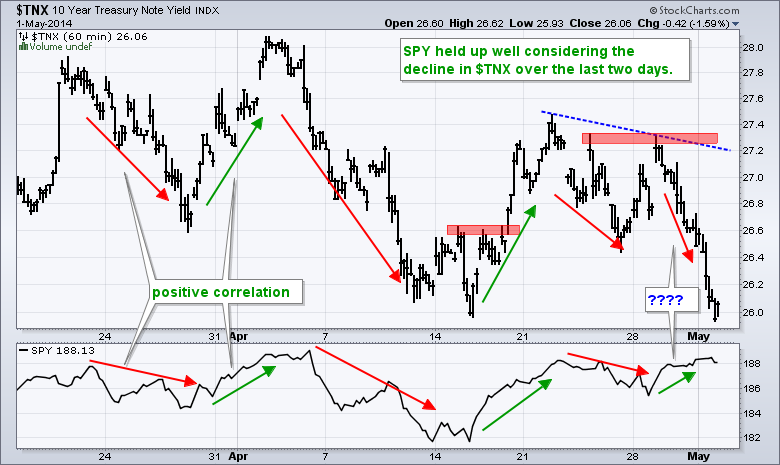
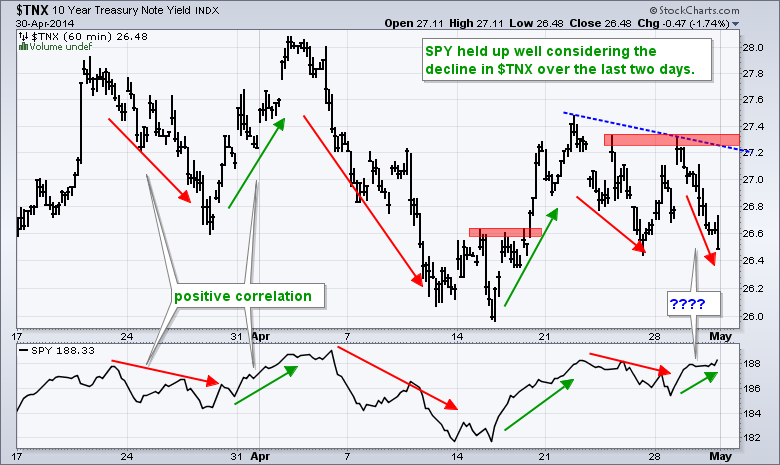
Gold and the 10-Yr T-Yield Test their April Lows
by Arthur Hill,
Chief Technical Strategist, TrendInvestorPro.com
There is no change on the charts as the current patterns held up. SPY and QQQ have flag breakouts, while IWM is bouncing within a downtrend. IWM could be forming a bear flag/wedge over the last few days. Treasuries surged this week as the 10-YR Treasury Yield ($TNX) fell...
READ MORE
MEMBERS ONLY

MARKETS PAUSE AFTER DOWS NEW CLOSING HIGH ON WEDNESDAY -- $SPX CLOSES WITH A SPINNING TOP -- 30 YEAR BOND YIELD CONTINUES TO MOVE LOWER -- THE TEN YEAR YIELD IS STILL IN A TRADING RANGE -- EUROPE TOP 100 CLOSES ON THE HIGH
by John Murphy,
Chief Technical Analyst, StockCharts.com
MARKETS PAUSE AFTER DOWS NEW CLOSING HIGH ON WEDNESDAY... While it is possible to come out of the fed meetings with a quiet market result, today was very quiet on the equity markets. This could be due to many nations having a holiday today, or investors still analyzing their positions....
READ MORE
MEMBERS ONLY
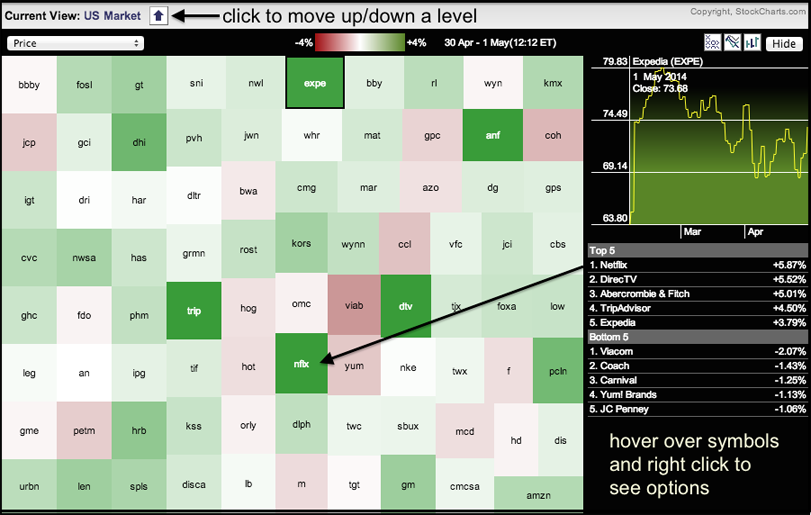
Netflix, DirectTV and Abercrombie Lead Consumer Discretionary Sector
by Arthur Hill,
Chief Technical Strategist, TrendInvestorPro.com
The Consumer Discretionary SPDR (XLY) was leading the sectors at midday on Thursday. Trading in general was rather lackluster, but it is still positive to see some leadership from this economically sensitive sector. The Market Carpet below shows Netflix (NFLX), DirecTV (DTV), Abercrombie (ANF), TripAdvisor (TRIP) and Expedia (EXPE) leading...
READ MORE
MEMBERS ONLY
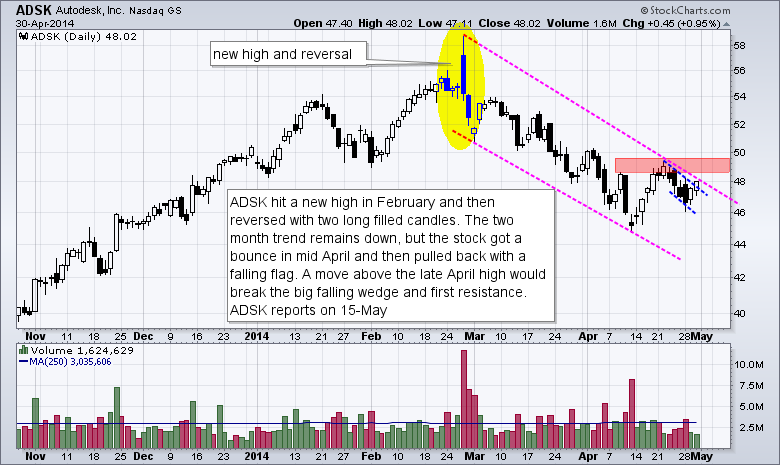
Charts: ADSK, DDD, ISIL, ITRI, PVH
by Arthur Hill,
Chief Technical Strategist, TrendInvestorPro.com
ADSK Corrects after Strong Advance
DDD Firms at long-term Support
ISIL Breaks Out after Earnings
ITRI Tests Island Reversal Zone
PVH Breaks Flag Resistance
Video is not available at the moment because we moved to a new blogging platform over the last few days. We are working on the technical...
READ MORE
MEMBERS ONLY
UUP Tests Support as GLD Stalls at Key Level
by Arthur Hill,
Chief Technical Strategist, TrendInvestorPro.com
Trading remains mixed as the market awaits the employment report on Friday, or perhaps jobless claims today. Despite a mixed market, the S&P 500 SPDR and Dow Diamonds continue to behave and act like they want to move higher. The Nasdaq 100 ETF also has a flag breakout...
READ MORE
MEMBERS ONLY

Bull Kiss

by Erin Swenlin,
Vice President, DecisionPoint.com
I wrote an article a few days ago pointing out that the PMO had a positive crossover generating a PMO crossover BUY signal on the SPX. Indicators were not behind the BUY signal and a day later the PMO turned back down toward its EMA, leaving us wondering whether it...
READ MORE
MEMBERS ONLY

FED CONTINUES ITS TAPERING WITH NO SURPRISES -- DOW AND S&P 500 NEAR RECORD HIGHS -- VALUE STOCKS CONTINUE TO LEAD, BUT GROWTH STOCKS ARE STARTING TO RECOVER -- BIOTECHS, INTERNET, AND DISCRETIONARY INDEXES ARE FINDING SUPPORT NEAR 200-DAY LINES
by John Murphy,
Chief Technical Analyst, StockCharts.com
DOW AND S&P 500 NEAR RECORD HIGHS... Today's Fed announcement slashed another 10 billion from its monthly bond purchases as expected, and contained no surprises. In addition, first quarter GDP growth was basically flat. Despite that, stocks continued their recent bounce. Charts 1 and 2 show...
READ MORE
MEMBERS ONLY
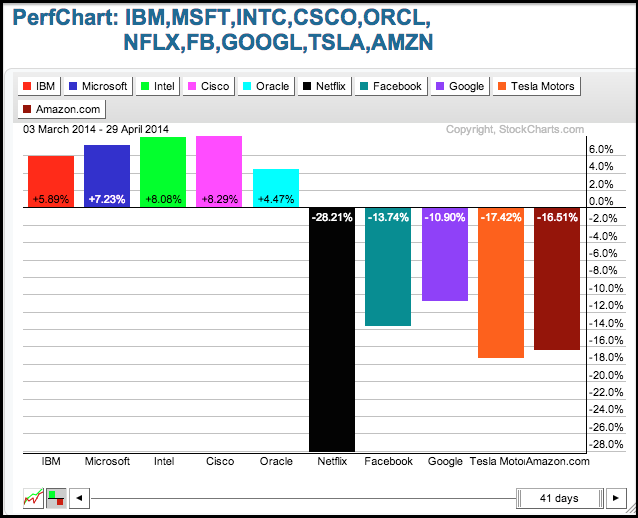
Old Tech Whips Up on New Tech
by Arthur Hill,
Chief Technical Strategist, TrendInvestorPro.com
The S&P 500 is up around 1.75% over the last two months, but the Nasdaq is down around 4%. Part of the reason for this discrepancy can be found in the performance of ten key tech stocks. The PerfChart below shows IBM, Microsoft, Intel, Cisco and Oracle...
READ MORE
MEMBERS ONLY
IWM Continues to Lag - GLD Hits Moment-of-Truth
by Arthur Hill,
Chief Technical Strategist, TrendInvestorPro.com
The major index ETFs closed with small gains as the market treaded water ahead of today's FOMC statement. These gains were enough to produce flag breakouts in QQQ and SPY. IWM remains in a downtrend and small-caps continue to hold the market back. Some of the beaten-down high-beta...
READ MORE
MEMBERS ONLY

American Express (AXP) and PIMCO (PMX) Added To PMO Rising Watch List
by Erin Swenlin,
Vice President, DecisionPoint.com
I hadn't run my favorite PMO Rising scan in about a week so I decided to see if any charts showed up that were worthy of adding to my PMO Watch List. The scan I use is below:
[exchange is NYSE]
AND [Daily SMA(20,Daily Volume) >...
READ MORE
MEMBERS ONLY

SLIGHT BULLISH DIVERGENCE FORMS IN AD LINE FOR XLY -- HOME CONSTRUCTION AND RETAIL HOLD THE KEY TO XLY -- BOLLINGER BAND CONTRACTION HITS COAL ETF -- BTU, CNX AND JOYG LEAD COAL INDUSTRY -- METALS & MINERS SPDR FORMS BULLISH CONTINUATION PATTERN
by John Murphy,
Chief Technical Analyst, StockCharts.com
SLIGHT BULLISH DIVERGENCE FORMS IN AD LINE FOR XLY... Link for today's video. The Consumer Discretionary SPDR (XLY) led the way lower from early March to mid April and underperformed the broader market during this timeframe. Relative weakness in the most economically sensitive sector is negative overall, but...
READ MORE
MEMBERS ONLY
QQQ and SPY Forms Small Bull Flags
by Arthur Hill,
Chief Technical Strategist, TrendInvestorPro.com
It was a volatile and mixed day on Monday. The Dow Diamonds (DIA) closed a half percent higher to lead the major index ETFs, while the Russell 2000 ETF (IWM) closed .58% lower on the day. The sectors were mixed with technology, healthcare and consumer staples leading on the upside....
READ MORE
MEMBERS ONLY
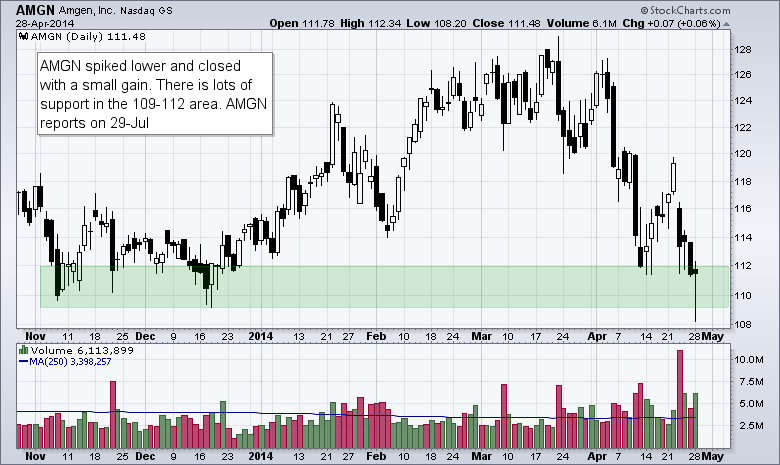
Charts: AMGN, BTU, EXPD, GOOGL, LEN
by Arthur Hill,
Chief Technical Strategist, TrendInvestorPro.com
AMGN Spikes Near Support.
BTU Breaks HS Resistance with Volume.
Plus $EXPD, $GOOGL and $LEN
VIdeo is unavailable while we work on a new interface.
This chart analysis is for educational purposes only, and should notbe
construed as a recommendation to buy, sell or sell-short said securities
This commentary and...
READ MORE
MEMBERS ONLY
Short-Term Indicators Ignore Positive Close
by Erin Swenlin,
Vice President, DecisionPoint.com
The market had a volatile day, swinging up, dipping low and then recovering to close up. Expectation on a rally would be short-term indicators switching direction and maybe even making climactic moves.
Looking at the daily bar chart, price still looks like it is topping out. Yesterday's high...
READ MORE
MEMBERS ONLY

AN INFLECTION POINT FOR TREASURIES (AND MAYBE STOCKS) -- GOLD TRACES OUT A BIG CONTINUATION PATTERN -- SILVER WALLOWS NEAR SUPPORT ZONE -- GOLD AND SILVER MINING ETFS BOUNCE NEAR KEY RETRACEMENTS -- SHANGHAI COMPOSITE EXTENDS SERIES OF LOWER HIGHS
by John Murphy,
Chief Technical Analyst, StockCharts.com
AN INFLECTION POINT FOR TREASURIES (AND MAYBE STOCKS)... Link for today's video. This week could mark an inflection point for Treasury bonds because the Fed makes its policy statement on Wednesday and the economic docket is overflowing with reports. The fundamentals alone do not make for the inflection...
READ MORE
MEMBERS ONLY

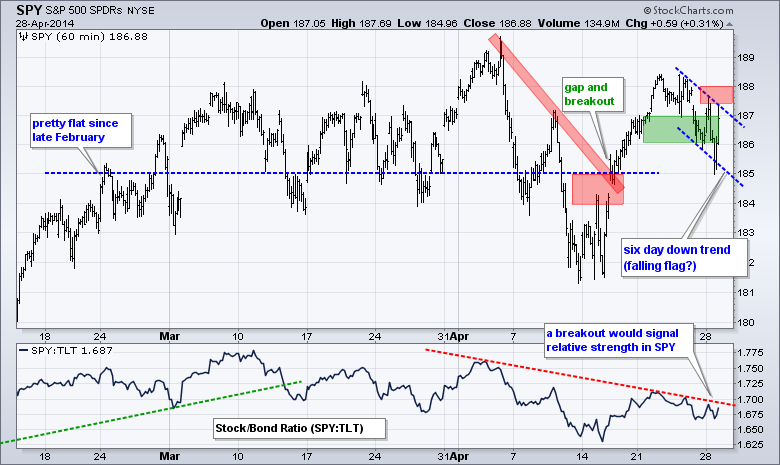
SPY Holds Support - UUP Consolidates after Bounce
by Arthur Hill,
Chief Technical Strategist, TrendInvestorPro.com
Stocks sold off on Friday, but the long-term trends remain up. We cannot forget about the long-term trend because it is the bigger force. In other words, IWM and QQQ may be in downtrends since early March, but these downtrends are still considered corrections within bigger uptrends. Yes, relative weakness...
READ MORE
MEMBERS ONLY

NASDAQ LEADS THE MARKET LOWER -- BIOTECH AND INTERNET STOCKS NEAR TEST OF 200-DAY AVERAGES -- MARKET VECTORS SEMICONDUCTOR ETF PLUNGES 3% ON FRIDAY TO LEAD TECH DECLINE -- SECTOR ALIGNMENT REMAINS DEFENSIVE
by John Murphy,
Chief Technical Analyst, StockCharts.com
NASDAQ RALLY ATTEMPT MAY BE FAILING... The Nasdaq lost -1.75% on Friday to lead the market lower once again. The relative strength line (top of Chart 1) shows the Nasdaq/S&P 500 ratio peaking at the start of March and falling to the lowest level in eight...
READ MORE
MEMBERS ONLY

LOWER HIGHS EXTEND FOR IWM AND QQQ -- HOW IS THE S&P 500 EVEN UP THIS YEAR? -- CHARTING THE RELATIVE BULLISH PERCENT INDEX -- RELATIVE BPI'S FOR UTILITIES AND STAPLES REMAIN STRONG -- RELATIVE BPI'S BREAK DOWN IN TECH AND CONSUMER DISCRETIONARY
by John Murphy,
Chief Technical Analyst, StockCharts.com
LOWER HIGHS EXTEND FOR IWM AND QQQ... Link for today's video. Selling pressure hit small-caps and techs hard in early trading on Friday. With further weakness over the last few days, the Russell 2000 ETF (IWM) and Nasdaq 100 ETF (QQQ) are poised to extend their string of...
READ MORE
MEMBERS ONLY

The Big Split Among Ten Key Industry Group ETFs
by Arthur Hill,
Chief Technical Strategist, TrendInvestorPro.com
The S&P 500 is up 1.64% year-to-date and the Russell 2000 is down 1.66%. This market splits is also reflected in year-to-date performance for ten key industry group ETFs. Notice that five are up and five are down. The Retail SPDR (XRT), Home Construction iShares (ITB)...
READ MORE
MEMBERS ONLY

One Way - My Way!
by Gatis Roze,
Author, "Tensile Trading"
There is only one Albert Einstein and only one Warren Buffett. There is only one race – the human race. There is only one life you can live. There is only one God. Some say there is only one way to avoid criticism – do nothing, say nothing, be nothing. Many claim...
READ MORE
MEMBERS ONLY

IWM and QQQ Hit Key Retracement Levels
by Arthur Hill,
Chief Technical Strategist, TrendInvestorPro.com
Stocks have traded in mixed fashion for several weeks now. DIA, SPY and RSP are flat since early March, but QQQ and IWM are down. Relative weakness in small-caps and large-techs is a concern, but we have yet to see a breakdown in the broader market. Relative weakness in the...
READ MORE
MEMBERS ONLY

PMO Buy Signal Lacks Confirmation
by Erin Swenlin,
Vice President, DecisionPoint.com
After breaking out from a short-term declining trend channel, the market seems to be losing steam. But, is it? The PMO has just had a positive crossover its 10-EMA triggering a PMO Buy signal.
We may be looking at a fake-out PMO Buy signal like we saw in early April....
READ MORE
MEMBERS ONLY

StockCharts Technical Rank Surges for Juniper Networks
by Arthur Hill,
Chief Technical Strategist, TrendInvestorPro.com
Juniper Networks (JNPR) is making waves because its StockCharts Technical Rank (SCTR) surged above 80 with one of the biggest SCTR gains among large-caps. Chartists can access the SCTR tables in the lower half of the home page. Click on "top up" to find the biggest SCTR gainers...
READ MORE
MEMBERS ONLY

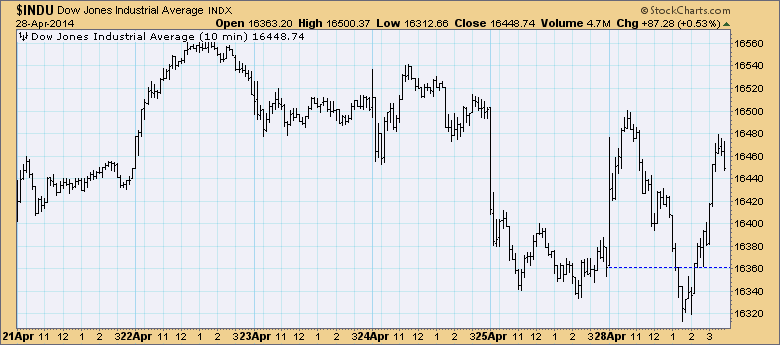
$SPX AND $INDU TEST RESISTANCE AGAIN -- $COMPQ CREATES A GARDEN HOSE PATTERN -- $NIKK AND $TNX CONTINUE TO TRACK -- CONSUMER STAPLES ETF MAKES NEW 52 WEEK HIGHS -- AAPL GRAPPLES WITH CASH MOUNTAIN, SPLITS SHARES -- FB CONTINUES MOBILE AD REVENUE GROWTH
by John Murphy,
Chief Technical Analyst, StockCharts.com
$SPX AND $INDU TEST RESISTANCE AGAIN... The $SPX shown in the 60 minute view on Chart 1 pushed above 1884 this week and settled back on Wednesday. This morning the market surged higher on the back of great numbers from AAPL and FB. This is an extremely important place on...
READ MORE
MEMBERS ONLY
USO Tests Support as TLT Rebounds
by Arthur Hill,
Chief Technical Strategist, TrendInvestorPro.com
Stocks took a breather with techs leading the market lower on Tuesday. Relative weakness in techs may not last long because the Technology SPDR (XLK) and the Nasdaq 100 ETF (QQQ) are poised to open sharply higher on the heels of Facebook and Apple. Elsewhere, the Home Construction iShares (ITB)...
READ MORE
MEMBERS ONLY
Charts: ANF, BAC, C, JPM, SYMC
by Arthur Hill,
Chief Technical Strategist, TrendInvestorPro.com
ANF Follows Up on Hammer.
BAC Firms in Support Zone.
Plus C, JPM, SYMC
Individual charts are below video.
Sorry but your browser doesn't support HTML5 video.
**This chart analysis is for educational purposes only, and should not
be construed as a recommendation to buy, sell or sell-short...
READ MORE
MEMBERS ONLY
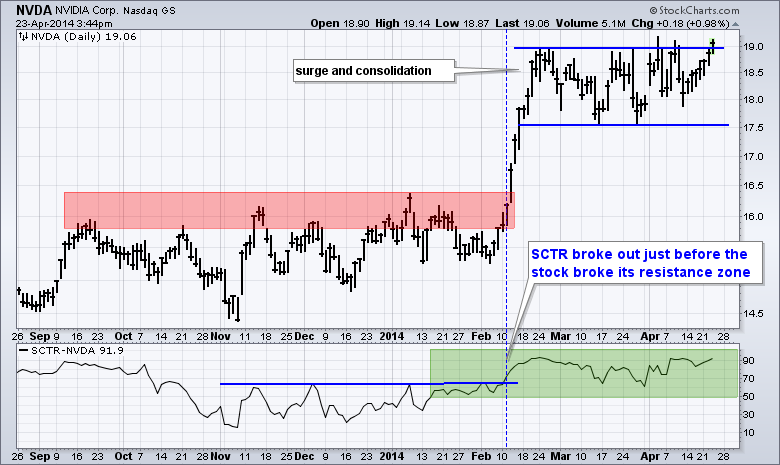
Nvidia Goes for a Flag Breakout
by Arthur Hill,
Chief Technical Strategist, TrendInvestorPro.com
Nvidia (NVDA) is showing relative strength as it breaks above consolidation resistance. The chart below shows the stock surging and then moving into a trading range that looks like a flat flag. A breakout here would signal a continuation higher. The indicator window shows the StockCharts Technical Rank (SCTR) above...
READ MORE
MEMBERS ONLY

FALLING BOND YIELDS ARE BOOSTING REITS, BUT HAVEN'T HELPED HOMEBUILDERS -- FALLING PRICE OF LUMBER SUGGESTS WANING DEMAND FOR NEW HOMES AND MAY EXPLAIN HOMEBUILDER WEAKNESS
by John Murphy,
Chief Technical Analyst, StockCharts.com
REITS BENEFIT FROM FALLING BOND YIELDS... Previous messages have shown falling bond yields benefiting dividend-paying stocks like utilities. REITS fall under the same category, and are getting the same lift from falling bond yields. The brown bars in Chart 1 show the MSCI US REIT Index ($RMX) trading it the...
READ MORE
MEMBERS ONLY

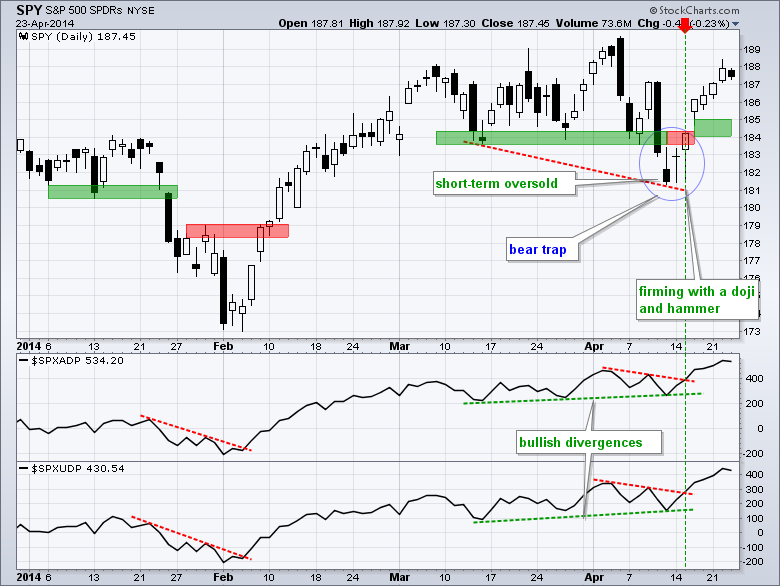
Breadth Indicators Hit New Highs - Gold Follows the Euro
by Arthur Hill,
Chief Technical Strategist, TrendInvestorPro.com
After becoming short-term oversold on 10-11 April, stocks firmed Monday-Tuesday last week and started a rally on Wednesday-Thursday. This short-term upswing continued this week with both QQQ and SPY advancing six days straight. On the breadth charts below, notice that the AD Line and AD Volume Line for the S&...
READ MORE
MEMBERS ONLY

Customizing Gallery View For DecisionPoint (Or Your Personal Style)
by Erin Swenlin,
Vice President, DecisionPoint.com
One of the features that I used frequently on the DecisionPoint.com website was Gallery View in the ChartTool. I was happy to learn that you can not only use Gallery View on Stockcharts.com to get an in depth view on a stock, ETF, etc., but you can customize...
READ MORE
MEMBERS ONLY
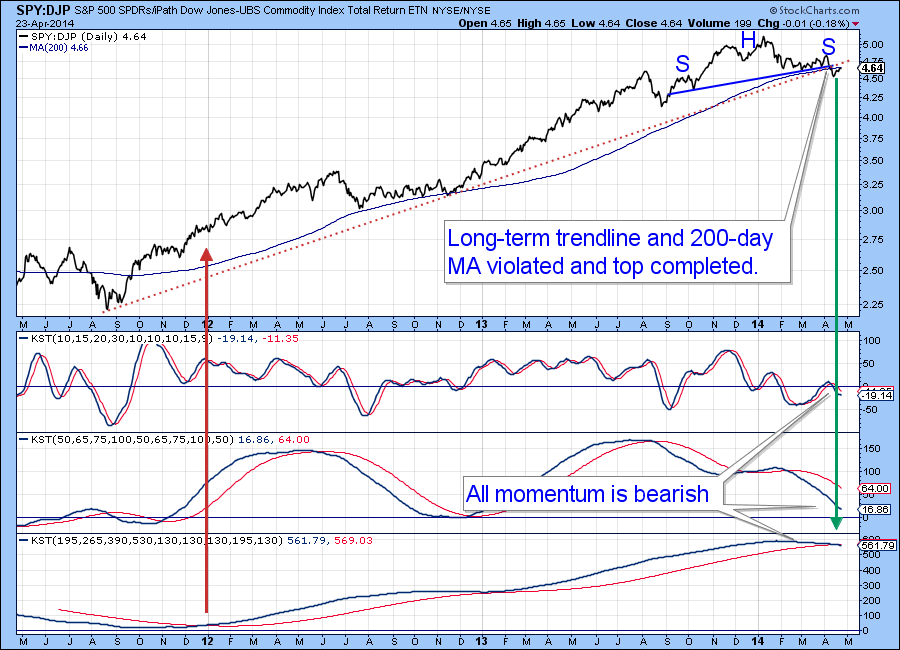
Stocks Breakdown Big Time vs Commodities

by Martin Pring,
President, Pring Research
Today's Market Roundup Headlines:
* Stocks break down big time against commodities
* IGE/XLP (Inflation/deflation ratio) breaks in favor of IGE
* Brent Crude close to a major breakout
* Industrial metals with the exception of copper break to the upside.
* Spider Metals and Mining (XME) close to major upside...
READ MORE
MEMBERS ONLY

DOW INDUSTRIALS TRACES OUT BULLISH CONTINUATION PATTERN -- TRANSPORTS CONFIRM NEW HIGH IN INDUSTRIALS -- FEDEX AND UPS POWER THE TRANSPORTS -- EXPEDITORS BOUNCES OFF VOLUME-BY-PRICE ZONE -- HOME CONSTRUCTION ISHARES HITS SUPPORT AGAIN
by John Murphy,
Chief Technical Analyst, StockCharts.com
DOW INDUSTRIALS TRACES OUT BULLISH CONTINUATION PATTERN... Link for today's video. The Dow Industrials has been quite choppy over the last seven weeks, but the overall pattern looks like a cup-with-handle. Popularized by William O'Neil of Investors Business Daily, the cup-with-handle is a bullish continuation pattern,...
READ MORE
