MEMBERS ONLY

QQQ AND IWM BOUNCE OFF SUPPORT ZONES -- REGIONAL BANK SPDR HITS A REVERSAL ZONE -- RETAIL SPDR FIRMS AT KEY RETRACEMENT -- HIGH-LOW PERCENT TRIGGERS A BULLISH SIGNAL -- 10-YR TREASURY YIELD SURGES OFF SUPPORT

by John Murphy,
Chief Technical Analyst, StockCharts.com
QQQ AND IWM BOUNCE OFF SUPPORT ZONES... Link for today's video. The Nasdaq 100 ETF (QQQ) and Russell 2000 ETF (IWM) started underperforming the S&P 500 SPDR (SPY) in March and led the market lower over the last three-to-four weeks. While relative weakness in large tech...
READ MORE
MEMBERS ONLY
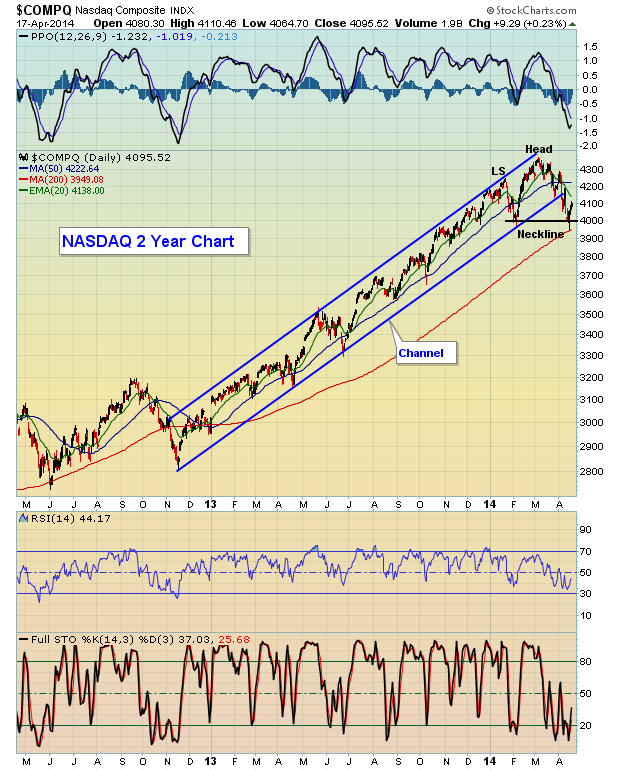
Rising Volatility and Bearish Technical Patterns a Double Negative

by Tom Bowley,
Chief Market Strategist, EarningsBeats.com
Last week's gains may have been more about options expiration and an oversold bounce than anything else. I have my eyes set squarely on the NASDAQ right now, waiting either for a resumption of the five year bull market or a breakdown of its current head & shoulders...
READ MORE
MEMBERS ONLY
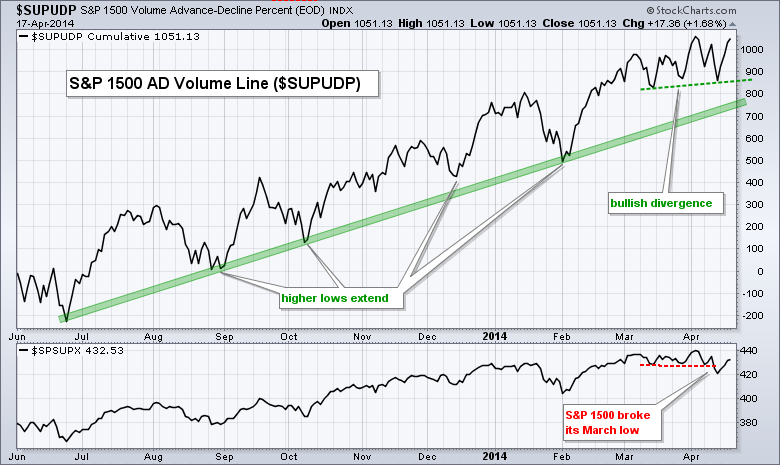
A Key Breadth Indicator Holds Strong During April Dip

by Arthur Hill,
Chief Technical Strategist, TrendInvestorPro.com
The AD Volume Line held strong during the April pullback and formed a small bullish divergence over the last few weeks. The AD Volume Line is a cumulative measure of AD Volume Percent, which is advancing volume less declining volume divided by total volume. In this example, we are looking...
READ MORE
MEMBERS ONLY

Home, Home on the "Ranger" - StockCharts' New Interactive Zoom Control
Hello Fellow ChartWatchers!
After a couple of big down days, the market had 3 nice up days in the middle of the week to retest the 16450 level on the Dow before closing mixed on Thursday just before the Good Friday holiday. After my article, you can see what John,...
READ MORE
MEMBERS ONLY

The Endowment Effect

by Gatis Roze,
Author, "Tensile Trading"
Investors beware or at least be aware. Over the past two years, I’ve had a number of significant relationships, but that’s changed now – in part because I was reminded of Charles Darwin’s famous quote “It is not the strongest of the species that survives, nor the most...
READ MORE
MEMBERS ONLY

DOW BACK TO RESISTANCE -- OPTIONS EXPIRATION BEHAVIOUR -- STOCKS CONTINUED THE DEFENSIVE POSTURE UNTIL TODAY -- ENERGY ENERGY ENERGY ENERGY -- $NATGAS SOARS ON INVENTORY DATA -- $WTIC TESTS RECENT HIGHS -- $BRENT BREAKS ABOVE A DOWN SLOPING TREND LINE
by John Murphy,
Chief Technical Analyst, StockCharts.com
DOW BACK TO RESISTANCE... The Dow continued to move higher but stalled at resistance. This is our first test of resistance since the bounce. We have seen the $INDU become the strongest index which is not abnormal during a correction. We would like to see the $INDU break out to...
READ MORE
MEMBERS ONLY

NASDAQ BOUNCES OFF 200-DAY AVERAGE AND HELPS STABILIZE MARKET -- SO DO SMALL CAPS AND CONSUMER DISCRETIONARY STOCKS -- UTILITY LEADERSHIP IS A CAUTION SIGN -- SO ARE UPSIDE BREAKOUTS IN CONSUMER STAPLES AND ENERGY SHARES
by John Murphy,
Chief Technical Analyst, StockCharts.com
NASDAQ BOUNCES OFF SUPPORT LEVELS... My last message suggested that the direction of the Nasdaq market held the key to overall market direction. That's because it led the spring selloff and was the first to test important support levels. So far those supports have held. Chart 1 shows...
READ MORE
MEMBERS ONLY

NASDAQ BOUNCES SOLIDLY AT 200 DMA -- SOME DRILLERS ROCK, OTHER DRILLERS SINK -- GOLD HOLDS 1300 -- COPPER GAPS DOWN OUT OF CONSOLIDATION -- TWITTER FINALLY MAKES A REVERSAL CANDLE
by John Murphy,
Chief Technical Analyst, StockCharts.com
NASDAQ BOUNCES SOLIDLY AT 200 DMA ... We need to spend some time here on the Nasdaq. The Nasdaq Composite bounced off the 200 DMA. After falling almost 10% exactly, the bounce off the lows was a full 2.3% reversal. For many reasons, this is a strong place to expect...
READ MORE
MEMBERS ONLY

Creating A Workflow ChartList

by Erin Swenlin,
Vice President, DecisionPoint.com
With the release of several DecisionPoint ChartPacks (to learn more about them and how to install them click here), many users have expressed that they are overwhelmed by the quantity of quality indicator charts. This is not news to me, we had the same feedback from new users to the...
READ MORE
MEMBERS ONLY

MARKETS BUILD A SMALL BASE -- COAL STARTS TO LEAD AS $NATGAS RISES -- ARCH COAL STARTS TO HEAD HIGHER -- BEBE STORES BUCKS THE CYCLICAL SECTOR TREND -- EDWARDS LIFE SCIENCES CREATES A GAP BREAKOUT
by John Murphy,
Chief Technical Analyst, StockCharts.com
MARKETS BUILD A SMALL BASE... As I prepared my notes for today's message at 3 PM, the Nasdaq had fallen back into the red and the Dow had lost 120 points from the high. By the time the market closed, the $INDU closed near the highs. That is...
READ MORE
MEMBERS ONLY

NOTES FROM TOP ANALYSTS, TRADERS, PORTFOLIO MANAGERS AND STRATEGISTS -- DEALING WITH OUR BIASES -- FORECASTING VERSUS REACTING -- PECKING ORDER FOR FIVE KEY ECONOMIC INDICATORS
by John Murphy,
Chief Technical Analyst, StockCharts.com
MTA TIDBITS... Today's Market Message will provide tidbits from the Market Technicians Association's annual symposium, which was held in NYC on April 3rd and 4th. The Symposium focused on the fusion of technical analysis with fundamental valuation, behavioral finance, macroeconomics and quantitative methods. It was truly...
READ MORE
MEMBERS ONLY

NASDAQ AND SMALL CAPS LEAD MARKET INTO BEARISH WEEK -- DOW AND S&P 500 TURN DOWN IN HEAVY TRADING -- SECTOR ROTATION REMAINS DEFENSIVE -- CONSUMER CYCLICALS AND FINANCIALS SHOW RELATIVE WEAKNESS
by John Murphy,
Chief Technical Analyst, StockCharts.com
NASDAQ LEADS WEEKLY LOSSES -- DOW HOLDS UP BEST... The relative performance of U.S. stock indexes reflects the bearish tone of the past week's action. Chart 1 shows the two biggest losers since March 1 being the Nasdaq Composite Index (-6.4%) and the Russell 2000 Small...
READ MORE
MEMBERS ONLY

Visa (V) Breaking Down

by Carl Swenlin,
President and Founder, DecisionPoint.com
After a quick review of the charts of Dow 30 Industrial stocks, the worst looking chart, in my opinion, is that of Visa (V). The first and most obvious problem is that price has broken down through a shallow parabolic line that defines the upward trend. The second issue is...
READ MORE
MEMBERS ONLY

PRICE AND VOLUME ACTION PUSH STOCK MARKET DEEPER INTO CORRECTION -- DOW AND S&P 500 BREAK 50-DAY AVERAGES -- NASDAQ BEARS DOWN ON 200-DAY LINE AND MAY DETERMINE DEPTH OF DOWNTURN -- WEEKLY NASDAQ INDICATORS AREN'T ENCOURAGING
by John Murphy,
Chief Technical Analyst, StockCharts.com
DOW AND S&P 500 FALL BELOW 50-DAY LINES... [Note: Although this message was posted earlier this afternoon, charts have been udpated to reflect closing prices]. The week's combination of falling prices in heavy trading is a bad combination. With small caps and the Nasdaq turning down...
READ MORE
MEMBERS ONLY

How Individual Investors Can Use Data Mining to Grow Their Profits
by Gatis Roze,
Author, "Tensile Trading"
Schwab, Fidelity, TD Ameritrade and Google likely know more about most investors and their trading habits than the investors themselves. Have you ever asked yourself why Google offers free gmail accounts? It’s because they are obsessed with collecting data. They now have complex algorithms and unimaginable computing power that...
READ MORE
MEMBERS ONLY

SPECIAL SITUATION -- $COMPQ CONFIRMS TREND LINE BREAK -- THE $SPX CLOSES ON THE LOWER BOLLINGER BAND -- $USB 30 YEAR TREASURY IS BACK ABOVE 200 DMA
by John Murphy,
Chief Technical Analyst, StockCharts.com
$COMPQ CONFIRMS TREND LINE BREAK... The $COMPQ has broken the long trend line off the Dec 2012 low. After yesterdays strong push up, it backtested the trend line from the underside. From there it pushed straight down. A 3% down day is very uncommon over the last few years so...
READ MORE
MEMBERS ONLY

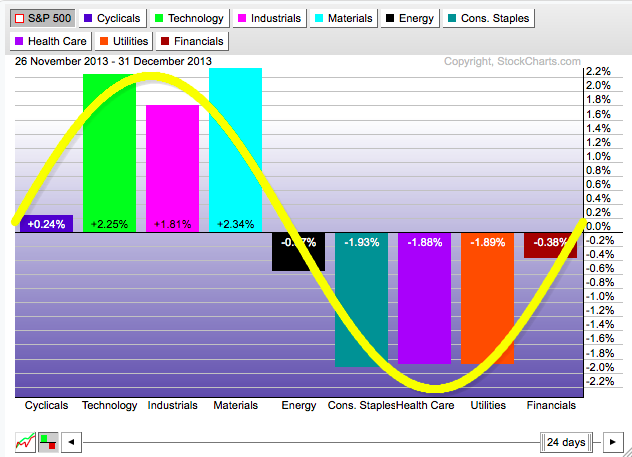
Sector Rotation in a Nutshell $XLK $XLU
Here's a chart that you should definitely not ignore:
(Click on the chart for a live version.)
So this is a chart of the relative strength of the Technology sector (using XLK as a proxy) versus the Utilities sector (XLU). These two sectors are at opposite ends of...
READ MORE
MEMBERS ONLY
Gold Making A Move
by Erin Swenlin,
Vice President, DecisionPoint.com
I pointed out a bullish Reverse Head and Shoulders possibly forming last week on Gold. It's still in play in my opinion, but the longer-term horizontal trading range, being a pattern that has been around longer, holds a bit more weight on what gold's next move...
READ MORE
MEMBERS ONLY

UTILITIES AND CONSUMER STAPLES START THE MORNING -- BANKS DON'T BOUNCE -- PRECIOUS METALS TRY TO MOVE HIGHER -- $WTIC TAKES OFF FROM THE 200 DMA PLATFORM
by John Murphy,
Chief Technical Analyst, StockCharts.com
UTILITIES AND CONSUMER STAPLES START THE MORNING... After a big up day like yesterday, we would like to see follow through in the growth sectors. Unfortunately, Thursday started off with more upside for utilities and consumer staples. Chart 1 from the sector summary page shows the leaders in green.
While...
READ MORE
MEMBERS ONLY

INVESTORS ARE ROTATING FROM GROWTH TO VALUE -- MONEY IS LEAVING SOCIAL MEDIA, CONSUMER DISCRETIONARY, AND BIOTECHS INTO BANKS, ENERGY, STAPLES, TELECOM, AND TECH DIVIDEND-PAYERS
by John Murphy,
Chief Technical Analyst, StockCharts.com
HOW TO DEAL WITH AN OVERBOUGHT MARKET... The stock market rally that started in March 2009 recently passed its fifth anniversary. That makes this a mature bull move in need of a period of consolidation or correction. The market is also in its most overbought region since 2007. Chart 1...
READ MORE
MEMBERS ONLY

A DRILL DOWN OF FINANCIALS -- THE LARGE BANK AND REGIONAL BANK ETFS LOOK STRONG -- JPM & WFC LOOK HIGHER AS BAC BREAKS A BIG TREND LINE -- CITI COMPLETES A ROUNDED TOP -- VISUAL CLUES FROM GOLDMAN SACHS AND MORGAN STANLEY
by John Murphy,
Chief Technical Analyst, StockCharts.com
A DRILL DOWN OF FINANCIALS... The financials are a critical component of the market. Ned Davis uses the phrase that financials will show the trouble before other sectors. So we have now had a 3% correction on the $SPX and it seems to have found support at the very important...
READ MORE
MEMBERS ONLY

Jury Duty, Blackjack and Crystal Balls
by Erin Swenlin,
Vice President, DecisionPoint.com
Today, I decided to pull from my archives of blogs written for Decision Point. In my opinion, this blog article states the simplicity of Decision Point Analysis. I have retooled it to include more up to date charts, as it was originally written in February of 2012. Enjoy!
JURY DUTY,...
READ MORE
MEMBERS ONLY

STOCKS SUFFER ANOTHER BAD CHART DAY -- WEAK RETAILERS WEIGH HEAVILY ON CONSUMER DISCRETIONARY SECTOR -- MONEY FLOWS INTO CONSUMER STAPLES -- DEFENSIVE ROTATONS, AND WEAK CHART ACTION, RAISE RISKS FOR A SPRING TOP
by John Murphy,
Chief Technical Analyst, StockCharts.com
ANOTHER DOWN DAY IN HEAVIER TRADING ... The Nasdaq market continues to lead the rest of the market lower. Chart 1 shows the Power Shares QQQ Trust falling to another two-month low after falling below its 50-day line on Friday. Relative weakness by the Nasdaq (and small caps) is usually bad...
READ MORE
MEMBERS ONLY

$INDU MAKES A DOUBLE TOP (SO FAR) -- COMPARING THE 2000 AND 2007 TOPS -- THE $COMPQ AND $SPX ARE WELL ABOVE THE 200 DMA -- $LUMBER GETS STUCK BELOW 40 WMA -- BUILDING AND CONSTRUCTION TEST THE UPTREND -- $BRENT DIPPED BELOW THE SUPPORT LINE LAST WEEK
by John Murphy,
Chief Technical Analyst, StockCharts.com
$INDU MAKES A DOUBLE TOP (SO FAR)... The Dow has made a double top so far as seen on Chart 1. Does this seem important? Here we sit with a potential $INDU double top and only 3 days from the high. Google, the big market leader is down almost 14%...
READ MORE
MEMBERS ONLY
NOTES FROM TOP ANALYSTS, TRADERS, PORTFOLIO MANAGERS AND STRATEGISTS -- CHINA AND NUCLEAR ENERGY -- RELATIVE PERFORMANCE OF INDUSTRIALS -- MONETARY CONDITIONS MATTER
by John Murphy,
Chief Technical Analyst, StockCharts.com
NOTES FROM TOP ANALYSTS, TRADERS, PORTFOLIO MANAGERS AND STRATEGISTS... I am on vacation the next two weeks, but would like to share my notes from the recent MTA symposium. Today's Market Message will provide tidbits from the Market Technicians Association's annual symposium, which was held in...
READ MORE
MEMBERS ONLY
On Leave for Two Weeks
by Arthur Hill,
Chief Technical Strategist, TrendInvestorPro.com
I am on a family vacation until April 18th and Art's Charts will be on hiatus for the next two weeks. The next Art's Charts will be published on Monday, April 21st. Thanks for your understanding....
READ MORE
MEMBERS ONLY
Sector Rotation Picture Quickly Changes to Defensive Outlook
Hello Fellow ChartWatchers!
If you are looking for lots of near-term optimism, I'm afraid the rest of this newsletter will be very disappointing. There are numerous technical reasons to think the market is overdue for a pull-back. And here they are...
Sector Rotation Points to Defensive Outlook
I&...
READ MORE
MEMBERS ONLY
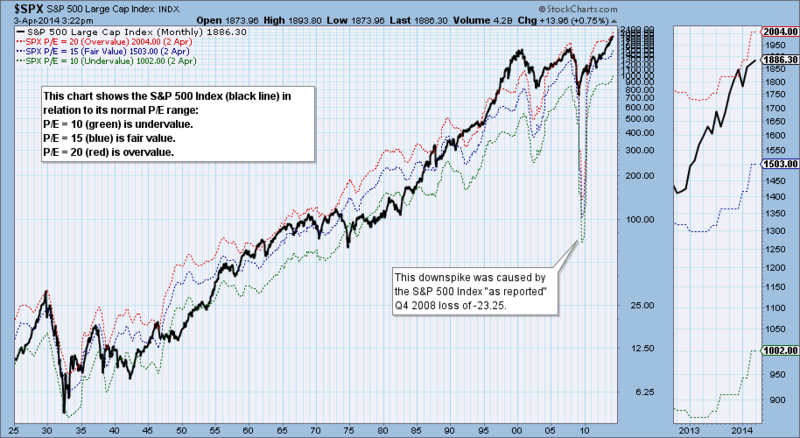
This Market Is Officially Overvalued
by Carl Swenlin,
President and Founder, DecisionPoint.com
On any given day we can find a wide range of opinions as to whether the stock market is undervalued or overvalued, and the bases for these assessments are also wide ranging and sometimes overly optimistic. I think a good starting point for estimating value is to use a price...
READ MORE
MEMBERS ONLY
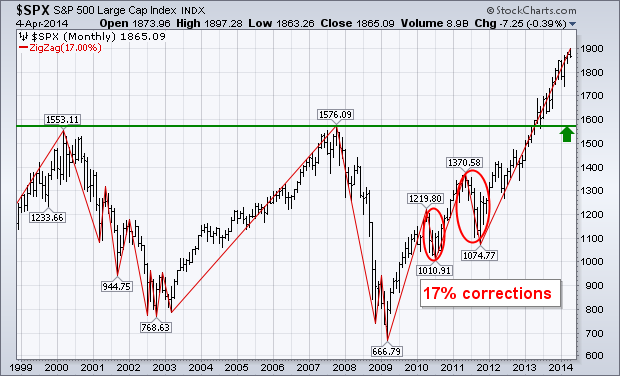
Watching for a Spring Top
by John Murphy,
Chief Technical Analyst, StockCharts.com
Last December 14 I wrote a message warning of the likelihood of a market correction during 2014. Midterm election years are the most dangerous of the four-year presidential cycle. ["The Four Year Presidential Cycle Suggests That 2014 Could Suffer a Major Downside Correction...The Strongest Six Month Period Ends...
READ MORE
MEMBERS ONLY
Warning Signs Piling Up
by Tom Bowley,
Chief Market Strategist, EarningsBeats.com
In earlier 2014 articles, I've discussed warning signs that emerged from Volatility indices, behavior in the treasury market, relative weakness of banks and relative strength of defensive areas of the market like utilities and REITs. In addition, the S&P 500 has shown a propensity to struggle...
READ MORE
MEMBERS ONLY

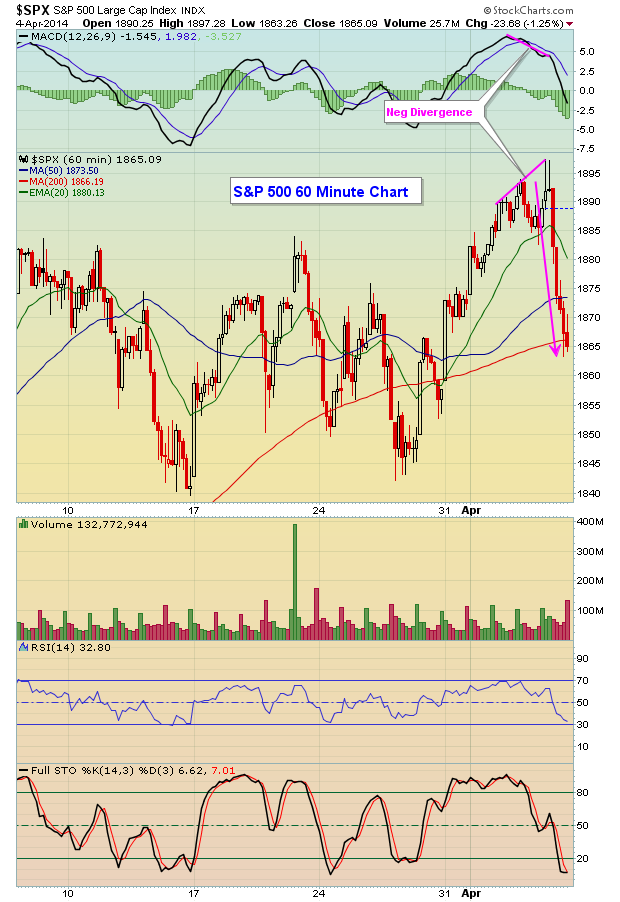
NASDAQ AND SMALL CAP INDEXES FALL BELOW 50-DAY AVERAGES ON BIG VOLUME -- SECTOR ROTATIONS TURN DEFENSIVE -- DOW AND S&P 500 SUFFER DOWNSIDE REVERSAL DAYS -- VOLUME PATTERNS ARE NEGATIVE -- WEEKLY MACD LINES REMAIN NEGATIVE FOR S&P
by John Murphy,
Chief Technical Analyst, StockCharts.com
NASDAQ AND SMALL CAPS LEAD MARKET LOWER... Stocks suffered a bad chart day on Friday. Stock indexes lost more than 1% in heavy trading. Small cap stocks and the Nasdaq market lost more than 2%. Chart 1 shows the Nasdaq Composite Index losing -2.6% on the day in very...
READ MORE
MEMBERS ONLY
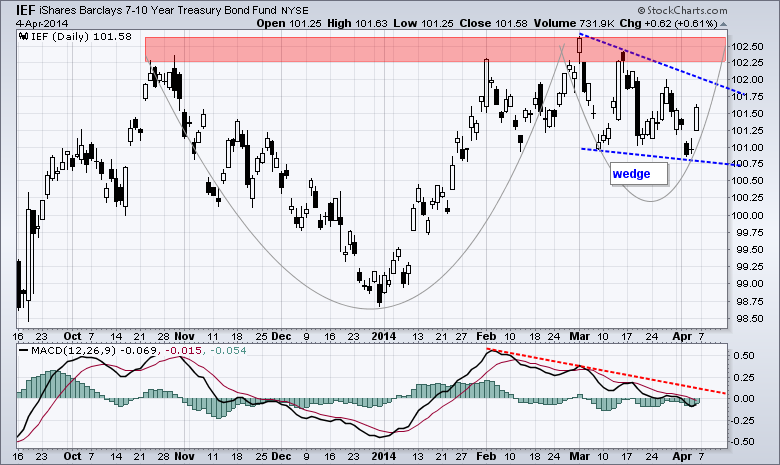
Bullish Bond Patterns Could Foreshadow Stock Market Correction
by Arthur Hill,
Chief Technical Strategist, TrendInvestorPro.com
The 7-10 YR T-Bond ETF (IEF) is tracing out two potentially bullish patterns and chartists should watch these patterns for clues on the stock market. The chart below shows IEF hitting resistance in the 102.25-102.5 area and then correcting with a falling wedge. With Friday's big...
READ MORE
MEMBERS ONLY
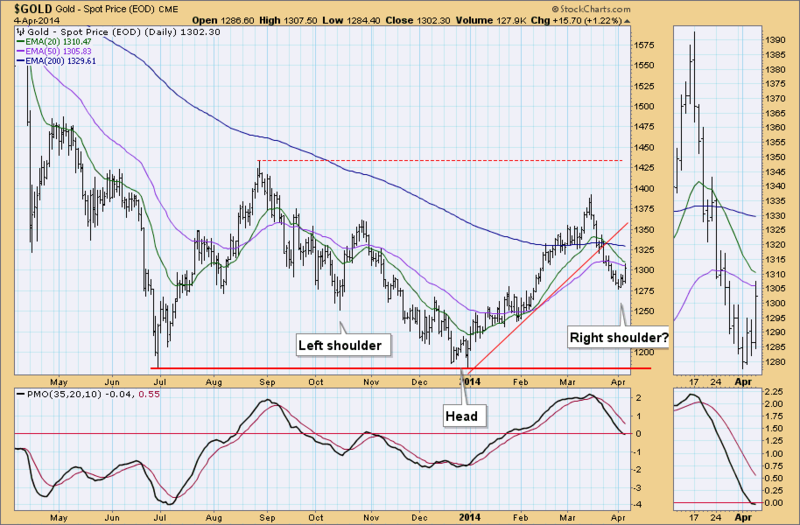
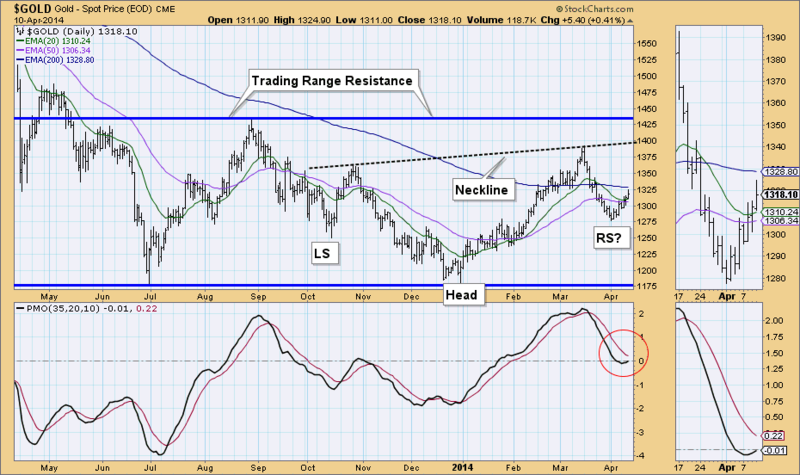
GOLD Reverse Head and Shoulders
by Erin Swenlin,
Vice President, DecisionPoint.com
While I was reviewing the Gold daily 1-year chart, I noticed after Friday's close that we could be looking at a bullish reverse head and shoulders pattern forming up. I've annotated what I view as a left shoulder and head along with where we would look...
READ MORE
MEMBERS ONLY

Apple Fails to Hold Triangle Breakout
by Arthur Hill,
Chief Technical Strategist, TrendInvestorPro.com
Apple (AAPL) appeared to be breaking out with a surge above triangle resistance in late March, but this breakout failed as the stock reversed in the trend line zone and broke back below 535 on Friday. Sometimes a failed signal is as value as a signal. In other words, this...
READ MORE
MEMBERS ONLY

10-YR TREASURY YIELD FAILS AT RESISTANCE -- 7-10 YR T-BOND ETF SURGES OFF WEDGE TREND LINE -- SMALL-CAPS AND TECHS LEAD MARKET LOWER -- RSP AND SPY STILL HOLDING UP -- BREATH INDICATORS SHOW NO DIVERGENCE
by John Murphy,
Chief Technical Analyst, StockCharts.com
10-YR TREASURY YIELD FAILS AT RESISTANCE... Programming Note: Chip, Greg, John and I are at the MTA Symposium on Thursday and Friday. Today's Market Message will not include a video because I am on the road. Also note that I will be taking a family vacation from April...
READ MORE
MEMBERS ONLY

Two Traders Talk: Candid Insights Over Lunch
by Gatis Roze,
Author, "Tensile Trading"
Trading the markets is basically a solo adventure, and since the markets here in Seattle close at 1:00 PM, it’s nice to break bread afterward with other traders and unwind. I thought my readers would enjoy a brief summary of one such spontaneous unscripted discussion at a recent...
READ MORE
MEMBERS ONLY

Gold Miners ETF Hits Critical Juncture near Two Key Moving Averages
by Arthur Hill,
Chief Technical Strategist, TrendInvestorPro.com
After breaking the 200-day and 50-day moving averages with a sharp decline, the Gold Miners ETF (GDX) consolidated with a small pennant. Notice that this consolidation is occurring near the 62% retracement and early February lows. This puts GDX at a critical juncture. A break below support would signal a...
READ MORE
MEMBERS ONLY

Anemic Breakout Through Double-Bottom Neckline
by Erin Swenlin,
Vice President, DecisionPoint.com
On Monday I wrote a blog "Double-Top to Double-Bottom?". I thought a review and update would be a great follow-up today, especially given the story the charts are telling.
We did get a breakout above the neckline of the double-bottom formation and if you look at this formation...
READ MORE
MEMBERS ONLY

$INDU, $SPX AND $TRAN MAKE NEW HIGHS TOGETHER -- TRUCKING INDEX MAKES HIGHER LOWS AND HIGHER HIGHS -- $SPX STOCKS ABOVE 200 DMA AND STOCKS ABOVE 50 DMA STILL HEALTHY -- $SPX IS NOW IN THE SECOND LONGEST RALLY IN 30 YEARS
by John Murphy,
Chief Technical Analyst, StockCharts.com
$INDU $SPX AND $TRAN MAKE NEW HIGHS TOGETHER... The $SPX made a new two day thrust higher this week. The $INDU shown in Chart 1 has made a new high today above the December 31st high. This new high confirms the breakout on the $SPX in Chart 2.
(click to...
READ MORE
MEMBERS ONLY

CONSUMER DISCRETIONARY SPDR LEADS MARKET HIGHER -- RETAIL SPDR CHALLENGES SUPPORT BREAK -- NUTRISYSTEM AND BEST BUY EXTEND CONSOLIDATIONS -- HOME CONSTRUCTION ISHARES SURGES OFF SUPPORT ZONE -- INTERNET ETF BOUNCES OFF SUPPORT
by John Murphy,
Chief Technical Analyst, StockCharts.com
CONSUMER DISCRETIONARY SPDR LEADS MARKET HIGHER... Link for today's video. The Consumer Discretionary SPDR (XLY) weighed on the stock market with a sharp decline in March, but the ETF found support at a key retracement and bounced over the last three days. Chart 1 shows XLY with a...
READ MORE
