MEMBERS ONLY
TLT Fails to Hold Breakout as SPY Hits New High

by Arthur Hill,
Chief Technical Strategist, TrendInvestorPro.com
Programming Note: I will be at the MTA Symposium on Thursday and Friday, and Art's Charts will not be published on those days.
The first trading day of the month lived up to its bullish reputation as stocks surged with a fairly broad-based rally. The Nasdaq 100 ETF...
READ MORE
MEMBERS ONLY
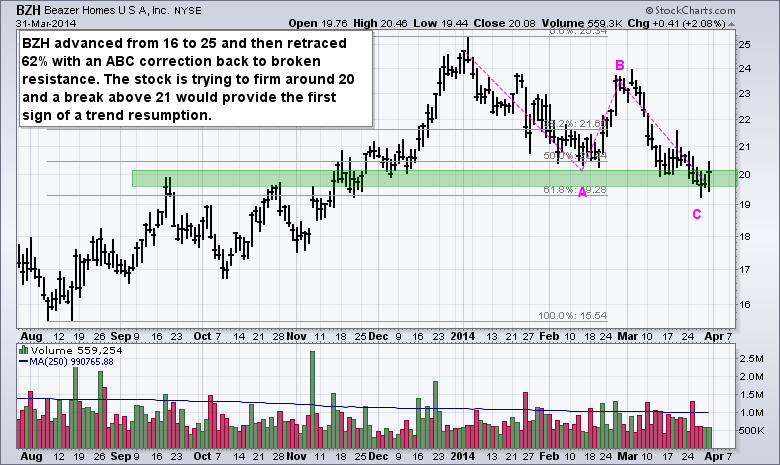
Charts: BZH, CROX, F, JCI, TMUS
by Arthur Hill,
Chief Technical Strategist, TrendInvestorPro.com
BZH Forms Classic Elliott Setup.
CROX Forms Continuation Triangle.
Plus F, JCI and TMUS
Individual charts are below video
**This chart analysis is for educational purposes only, and should not
be construed as a recommendation to buy, sell or sell-short said securities**
Note: I am travelling this week and there...
READ MORE
MEMBERS ONLY
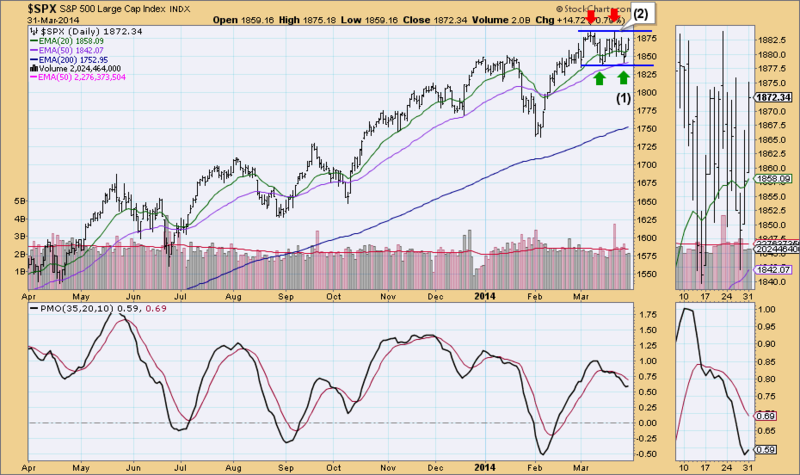
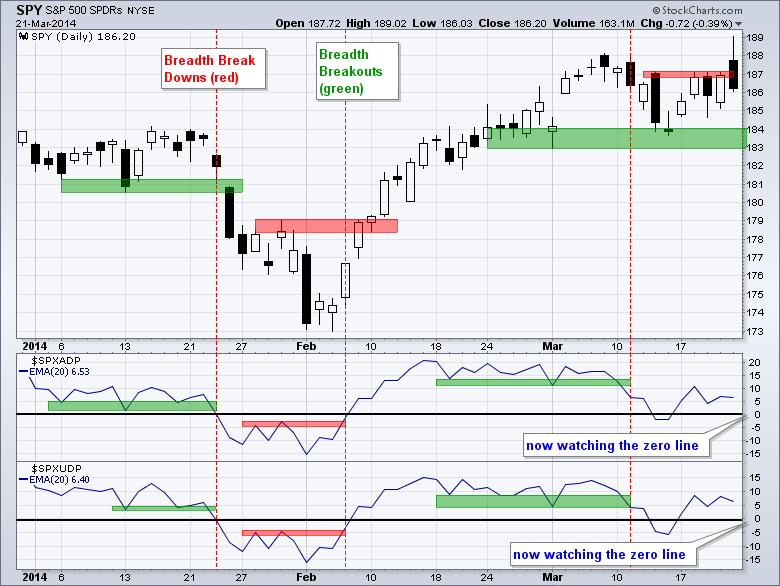
Double-Top To Double-Bottom?

by Erin Swenlin,
Vice President, DecisionPoint.com
Ah, the bull market that wouldn't die. The DP Chart Gallery revealed some interesting charts today, starting with the SP500 Daily Chart. What appeared to be a bearish double-top formation is now looking like a bullish double-bottom. Maybe it is time to chalk it up to being a...
READ MORE
MEMBERS ONLY

DOW INDUSTRIALS AND TRANSPORTS CHALLENGE RESISTANCE -- MMM, TRV, CNW AND KSU GO FOR BREAKOUTS -- GLOBAL AUTO ETF SURGES TO NEW HIGH -- FIAT HITS NEW HIGH, FORD CONSOLIDATES AND GM TESTS SUPPORT -- FINANCE ETF FORMS FLAG AS BANKING SPDR BOUNCES OFF SUPPORT

by John Murphy,
Chief Technical Analyst, StockCharts.com
DOW INDUSTRIALS AND TRANSPORTS CHALLENGE RESISTANCE ... Link for today's video. With a surge the last two days, the Dow Industrials and Dow Transports are challenging consolidation resistance and poised for breakouts. Chart 1 shows the Dow surging above 16000 in February and then moving into a consolidation pattern....
READ MORE
MEMBERS ONLY
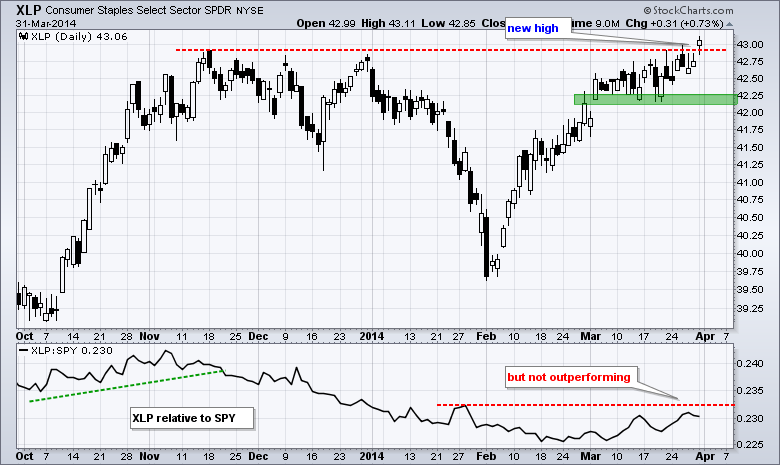
XLP Hits New High, but Still Lags - SPY Gaps Higher
by Arthur Hill,
Chief Technical Strategist, TrendInvestorPro.com
Programming Note: I will be at the MTA Symposium on Thursday and Friday, and Art's Charts will not be published on those days. https://symposium.mta.org/ Stocks put in a pretty solid performance on the last day of the quarter as small-caps and healthcare led the way...
READ MORE
MEMBERS ONLY
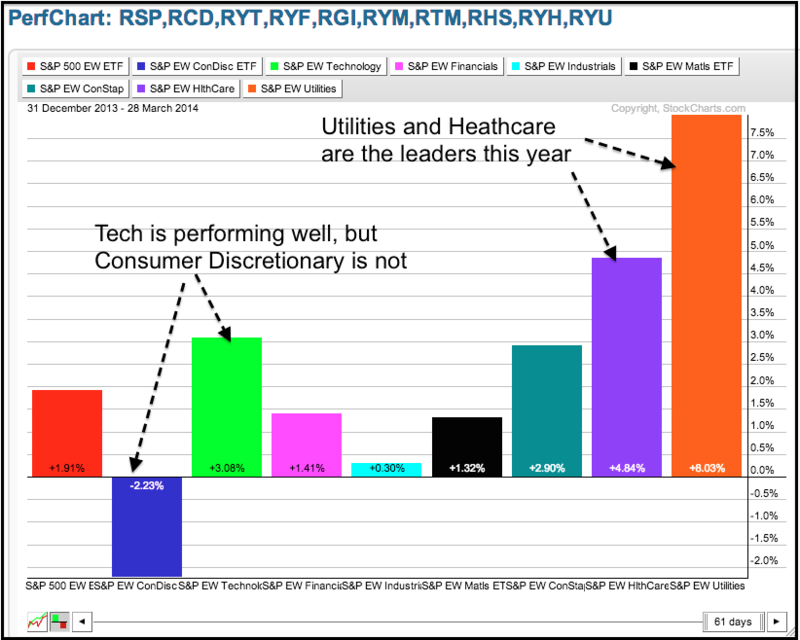
Utilities Lead on Equal-Weight Sector PerfChart
by Arthur Hill,
Chief Technical Strategist, TrendInvestorPro.com
The Equal-weight Utilities ETF (RYU) is the best performing sector year-to-date with an 8% gain. The Equal-Weight Consumer Discretionary ETF (RCD) is the only sector in the red with a 2.23% loss. Absolute weakness in RCD and relative weakness in the Equal-weight Industrials ETF (RGI) are the main reason...
READ MORE
MEMBERS ONLY

ENERGY SECTOR SHOWS NEW MARKET LEADERSHIP -- ENERGY SPDR HITS NEW RECORD -- OIL SERVICE STOCKS ALSO SEE BIG GAINS -- HALLIBURTON AND SCHLUMBERGER ACHIEVE MAJOR BULLISH BREAKOUTS -- CRUDE OIL MAY BE FORMING BULLISH TRIANGLE
by John Murphy,
Chief Technical Analyst, StockCharts.com
ENERGY IS WEEK'S STRONGEST SECTOR... Energy stocks had a very good week. In fact, they were the strongest part of the stock market. Chart 1 shows the Energy Sector SPDR (XLE) breaking out to a new record. Even more impressive is the big jump in the XLE/SPX...
READ MORE
MEMBERS ONLY
SPY Tests Support, but Underperforms TLT
by Arthur Hill,
Chief Technical Strategist, TrendInvestorPro.com
Programming Note: I will be at the MTA Symposium on Thursday and Friday, and Art's Charts will not be published on those days.
Stocks did the old pop-and-drop on Friday and finished the day mostly higher. Overall, it was a tale of two markets with the S&...
READ MORE
MEMBERS ONLY
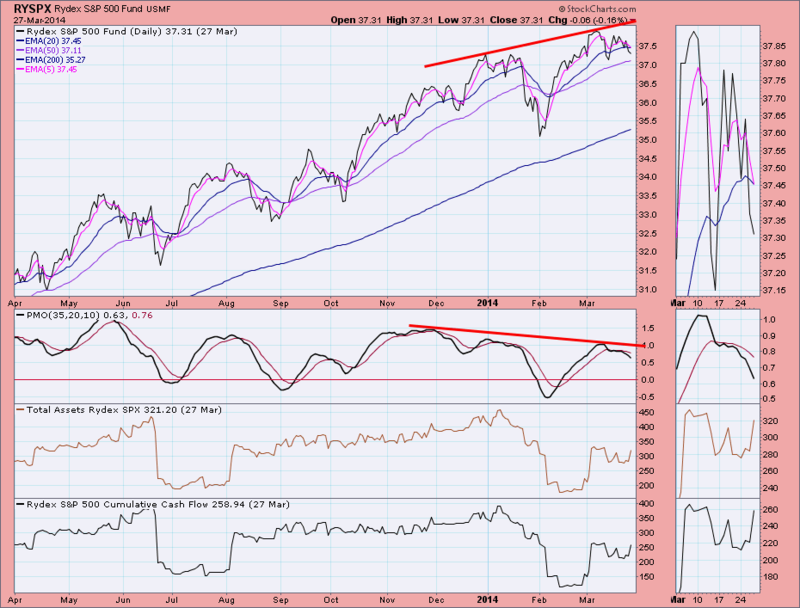
Numerous Negative PMO Divergences On Rydex Funds
by Erin Swenlin,
Vice President, DecisionPoint.com
I noticed a number of PMO negative divergences appearing on the Rydex Funds while clicking through the assets and cashflow charts in the DecisionPoint Rydex ChartPack. Not only are there negative divergences, many of these funds are still showing a large amount of assets and cashflow into them.
Take a...
READ MORE
MEMBERS ONLY

Reading Sentiment Using ICI Monthly Mutual Fund Statistics
by Erin Swenlin,
Vice President, DecisionPoint.com
The Investment Company Institute (ici.org) compiles statistics on mutual funds and publishes them monthly. There is a one month delay between the end of the month being reported and publication, so the data on the charts below, while being updated this week goes through Feburary. Amounts shown on the...
READ MORE
MEMBERS ONLY

RSP AND SPY BOUNCE OFF CONSOLIDATION SUPPORT -- QQQ AND IWM BREAK 50-DAY LINES -- XLI, XLK AND XLF HOLD UP THE MARKET -- RUSSELL 2000 AND NASDAQ SERIOUSLY UNDERPERFORM -- TREASURIES START OUTPERFORMING STOCKS
by John Murphy,
Chief Technical Analyst, StockCharts.com
RSP AND SPY BOUNCE OFF CONSOLIDATION SUPPORT... Link for today's video. Even though selling pressure hit small-caps and momentum names over the last few weeks, the S&P 500 SPDR (SPY) and the Equal-Weight S&P 500 ETF (RSP) held up quite well and did not...
READ MORE
MEMBERS ONLY

The Paralysis of Perfection: The Investor's Ongoing Challenge

by Gatis Roze,
Author, "Tensile Trading"
The brilliant novelist Isabel Allende once wrote, “Fear is inevitable, I have to accept that, but I cannot allow it to paralyze me.” Similarly, far too many investors are reluctant to trade because they believe every puzzle piece of their complex methodology must be in place before they can act....
READ MORE
MEMBERS ONLY

100 Hammers Hit the Pre-defined Scans Page
by Arthur Hill,
Chief Technical Strategist, TrendInvestorPro.com
Chartists looking for specific candlestick reversal patterns should check out the predefined scans page, which is updated intraday and end-of-day. Thursday's end-of-day results show a surge in the number of hammers (from 42 to 100 for a +58 gain). This indicates that many stocks dipped after the open...
READ MORE
MEMBERS ONLY

SPY Toys with Support - UUP Forms Bullish Pennant
by Arthur Hill,
Chief Technical Strategist, TrendInvestorPro.com
Stocks remained under selling pressure on Thursday, but selling pressure was not that strong and the major index ETFs closed with small losses. Seven of the nine sectors were down with the Finance SPDR (XLF) leading the decline (-.54%). The Energy SPDR (XLE) and Utilities SPDR (XLU) gained. The...
READ MORE
MEMBERS ONLY

Thrust and Parry
by Erin Swenlin,
Vice President, DecisionPoint.com
While considered a fencing term, "thrust" is an excellent allusion to one of my favorite DecisionPoint analysis tools. It was developed by Carl Swenlin as a component of one of the DecisionPoint timing models. It adds an extra dimension to straight trend analysis. What Carl found was that...
READ MORE
MEMBERS ONLY
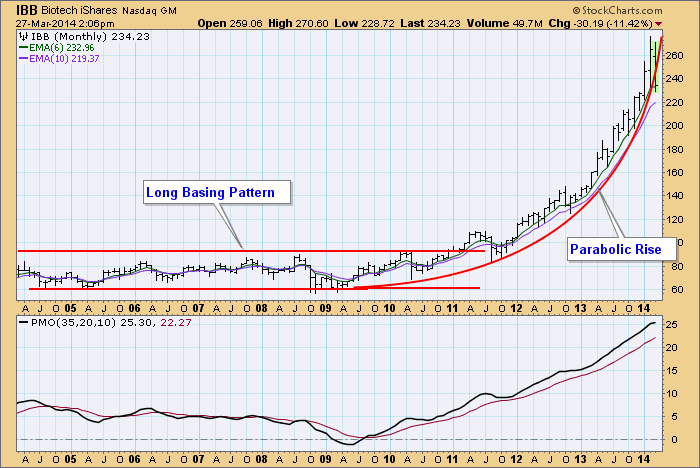
Biotech Bubble?

by Carl Swenlin,
President and Founder, DecisionPoint.com
This morning on one of the business channels the moderator was asking guests if there was a bubble the Biotech Sector, and at the same time a three-week line chart was displayed on the screen. Pretty frustrating, but it did tickle my curiosity, so I made a 10-year monthly bar...
READ MORE
MEMBERS ONLY

A LOOK AT THE QQQ 5 YEAR RALLY -- QQQ BOUNCES OFF TREND LINE SUPPORT -- GOOG LOSES $100 IN 6 TRADING DAYS -- S&P SECTOR PERF CHARTS SHIFT TO DEFENSIVE SECTORS -- TOBACCO INDUSTRY IS #1 CONSUMER STAPLES INDUSTRY GROUP
by John Murphy,
Chief Technical Analyst, StockCharts.com
QQQ � A LOOK AT THE 5 YEAR RALLY ... QQQ has recently touched the top of the channel trend line as shown in Chart 1. We have been rubbing it for 4 months now. We have not visited the lower channel line since the 2011 October lows. I want to show...
READ MORE
MEMBERS ONLY
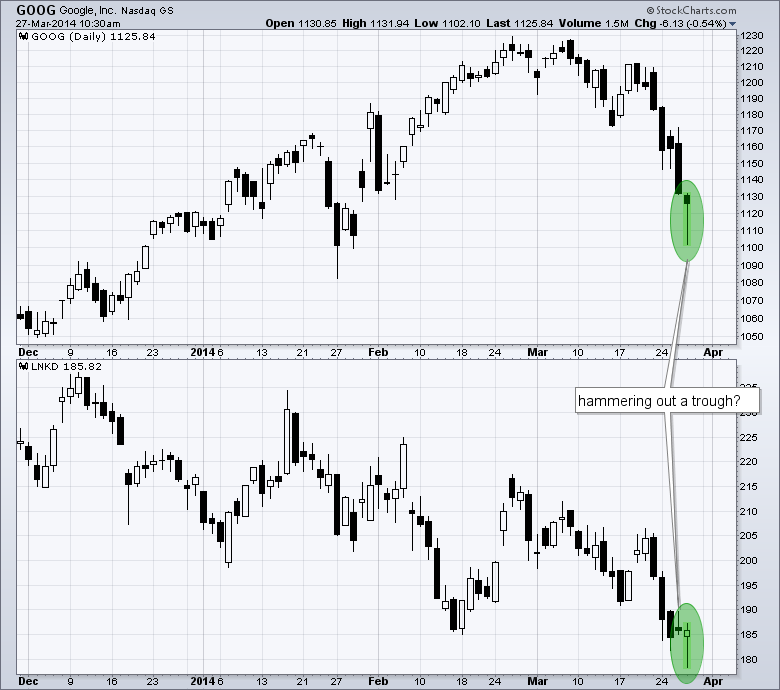
Google and LinkedIn Try to Hammer Out Short-Term Bottoms
by Arthur Hill,
Chief Technical Strategist, TrendInvestorPro.com
Google, LinkedIn and other momentum stocks fell sharply this month and became short-term oversold this week. Signs of a short-term low are emerging early Thursday as Google (GOOG) and LinkedIn (LNKD) trace out hammer patterns. Keep in mind that it is still early and these hammers are subject to change...
READ MORE
MEMBERS ONLY
Charts: BAC, CQP, CTB, HCA, PFE, WHR
by Arthur Hill,
Chief Technical Strategist, TrendInvestorPro.com
BAC Zigzags Higher.
CQP Holds Support with a Bad Tape.
Plus CTB, HCA, PFE, WHR
Individual charts are below video.
Sorry but your browser doesn't support HTML5 video.
**This chart analysis is for educational purposes only, and should not
be construed as a recommendation to buy, sell or...
READ MORE
MEMBERS ONLY
SPY Tests Support Again - TLT Breaks Resistance
by Arthur Hill,
Chief Technical Strategist, TrendInvestorPro.com
Stocks fell on Wednesday with relatively broad-based selling pressure. The Russell 2000 ETF (IWM) and Russell MicroCap iShares (IWC) led the way lower as money moved out of the riskiest stocks. Eight of nine sector SPDRs were down three of the four offensive sectors falling over 1%. The materials sector...
READ MORE
MEMBERS ONLY

Cree Breaks Down with Expanding Volume CREE
by Arthur Hill,
Chief Technical Strategist, TrendInvestorPro.com
After lagging the market and the semiconductor group this year, CREE finally succumbed to selling pressure with a triangle break the last few days. Note that the S&P 500 SPDR and Semiconductor SPDR hit new highs in March, but CREE fell well short of its January high. The...
READ MORE
MEMBERS ONLY

EAFE AND EEM ISHARES EARLY BOUNCE FADES -- EMERGING MARKET BONDS AND CURRENCIES ARE BOUNCING -- THE EURO RALLY HAS RUN INTO A MAJOR RESISTANCE LINE -- A STRONGER EURO HAS BOOSTED THE RELATIVE PERFORMANCE OF EUROZONE STOCKS OVER LAST TWO YEARS
by John Murphy,
Chief Technical Analyst, StockCharts.com
FOREIGN STOCK ETFS EARLY GAINS FADE... Foreign stock markets turned in a stronger performance earlier today, but their gains faded by day's end. Chart 1 shows EAFE iShares (which measures developed markets) trading above its 50-day moving average for most of the day. An afternoon fade, however, erased...
READ MORE
MEMBERS ONLY

SPY Bounces off Support, but IWM and QQQ Lag
by Arthur Hill,
Chief Technical Strategist, TrendInvestorPro.com
Stocks put in a mixed performance on Tuesday with the S&P 500 SPDR (SPY) edging higher and the Russell 2000 ETF (IWM) closing fractionally lower. Seven of the nine sector SPDRs were up with industrials and energy leading. The consumer discretionary and finance sectors lost ground. While I...
READ MORE
MEMBERS ONLY

Oversold Readings On Health Care ETF (XLV) PMO Analysis Chart
by Erin Swenlin,
Vice President, DecisionPoint.com
While clicking through the PMO Analysis ChartList in the DecisionPoint Market Indicators ChartPack, I noticed that the PMO Analysis chart for the Health Care ETF (XLV) showed oversold readings. Previous oversold bottoms have lined up pretty closely with past short-term price bottoms.
On a PMO Analysis chart, besides the PMO...
READ MORE
MEMBERS ONLY

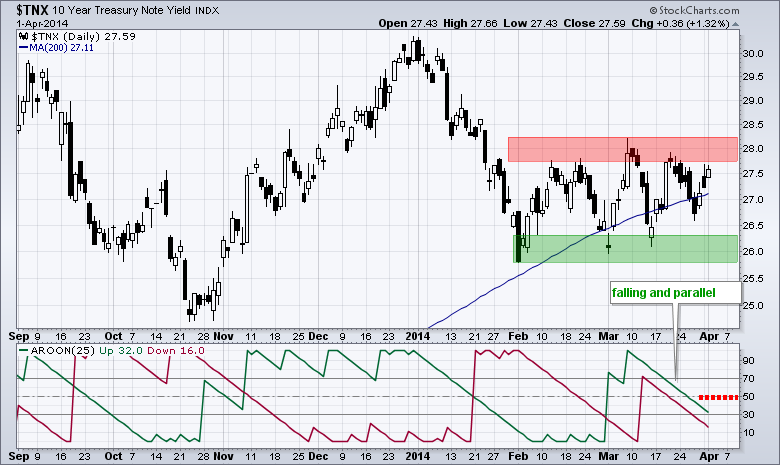
WATCHING THE 10-YR YIELD FOR CLUES ON STOCKS -- TLT BOUNCES OFF GOLDEN CROSS (AGAIN) -- MINING AND RELATED STOCKS HOLD STRONG -- AA CHALLENGES RESISTANCE AS BHP BOUNCES -- APPAREL RETAILERS INDEX BREAKS SHORT-TERM SUPPORT
by John Murphy,
Chief Technical Analyst, StockCharts.com
WATCHING THE 10-YR YIELD FOR CLUES ON STOCKS... Programming note: We are having some technical issues and cannot produce a video at the moment. The 10-YR Treasury Yield ($TNX) continues to muddle along and trade above the October low. Chartists should watch Treasury yields because they are positively correlated with...
READ MORE
MEMBERS ONLY
Charts: BBRY, CMCSA, IDCC, JBLU, JOY
by Arthur Hill,
Chief Technical Strategist, TrendInvestorPro.com
BBRY Firms at Support.
CMCSA Forms Big Doji at Support.
Plus IDCC, JBLU, JOY
Individual charts are below video.
Sorry but your browser doesn't support HTML5 video.
**This chart analysis is for educational purposes only, and should not
be construed as a recommendation to buy, sell or sell-short...
READ MORE
MEMBERS ONLY

SPY Tests Support as TLT Challenges Resistance
by Arthur Hill,
Chief Technical Strategist, TrendInvestorPro.com
Stocks came under selling pressure with the Russell 2000 ETF (IWM) and Nasdaq 100 ETF (QQQ) leading the way lower. The losses, however, were still relatively modest. IWM lost 1.14%, QQQ declined .88% and SPY was down just .41%. Eight of the nine sectors were down with XLU providing...
READ MORE
MEMBERS ONLY
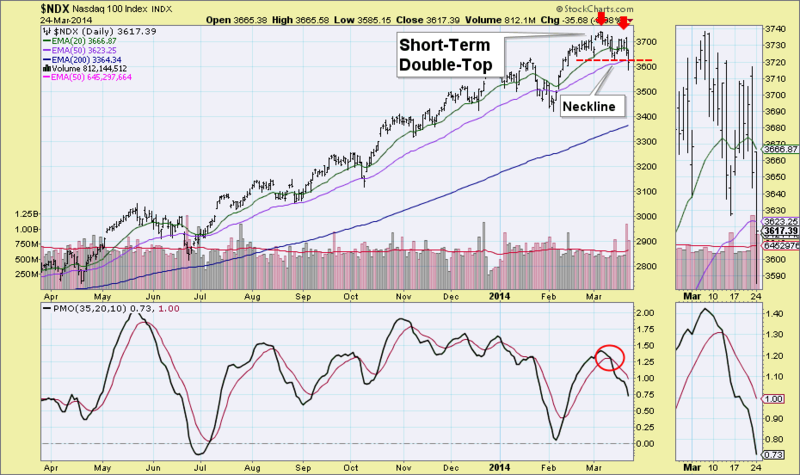
NDX Double-Top Neckline Penetrated
by Erin Swenlin,
Vice President, DecisionPoint.com
When I reviewed the DP Chart Gallery today, one chart caught my eye. The daily bar chart for the NDX had a clear short-term double-top formation that executed today. While I have seen possible double-tops shaping up on the other indexes, this one stood out because the neckline had been...
READ MORE
MEMBERS ONLY

BEARISH DIVERGENCE EXTENDS IN $NDX BREADTH INDICATOR -- AMAZON, FACEBOOK AND GOOGLE, WEIGH ON THE NASDAQ -- MOMENTUM AND INTERNET STOCKS GET HAMMERED -- APPLE BUCKS THE TREND WITH RESISTANCE CHALLENGE -- XLY LAGS AND TESTS SUPPORT AS XRT FALLS
by John Murphy,
Chief Technical Analyst, StockCharts.com
BEARISH DIVERGENCE EXTENDS IN $NDX BREADTH INDICATOR... After forming two big outside days the prior two weeks, the Nasdaq 100 ETF (QQQ) is falling on Monday and breaking its first support level. Chart 1 shows QQQ opening strong and closing weak on March 13th and 21st (red arrows). Basically, these...
READ MORE
MEMBERS ONLY
QQQ Underperforms and Tests First Support
by Arthur Hill,
Chief Technical Strategist, TrendInvestorPro.com
Stocks worked their way higher last week with volatile trading. SPY started the week strong with a surge on Monday-Tuesday, but then got hit with selling pressure after the FOMC policy statement and conference call. Stocks rebounded on Thursday and continued higher on Friday morning, but selling pressure appeared in...
READ MORE
MEMBERS ONLY

GILEAD AND BIOGEN LEAD BIOTECH SELLOFF WHICH PULLS NASDAQ LOWER -- MARKET SUFFERS DOWNSIDE REVERSAL DAY ON FRIDAY -- BIG JUMP IN 2-YEAR YIELD MAY HAVE ALSO UNSETTLED MARKET -- DOLLAR BOUNCE MAY CAP GOLD RALLY
by John Murphy,
Chief Technical Analyst, StockCharts.com
BIOTECHS TUMBLE ON FRIDAY... Biotech stocks, which have been market leaders for months, took a big hit on Friday. The catalyst for the heavy selling was a letter by a group of House Democrats asking Gilead Sciences to justify the high price of its hepatitis drug. That query caused the...
READ MORE
MEMBERS ONLY

Top Five Things All DecisionPoint Subscribers Should Do NOW!
by Erin Swenlin,
Vice President, DecisionPoint.com
The DecisionPoint.com merge with StockCharts.com is coming along and we've gotten lots of important feedback from DP and SCC subscribers alike. As I've reviewed the mail that has been flowing into our Customer Support area, I decided I should write an article directed mainly...
READ MORE
MEMBERS ONLY

THE FAB FIVE HOLD THEIR BREAKOUTS -- BULLISH HIGHLIGHTS OUTWEIGH CONCERNS -- THREE KEY INDUSTRY-GROUP ETFS CONSOLIDATE IN MARCH -- FINANCE SPDR AND BANK ETF SURGE TO NEW HIGHS -- AN INDEX DOES NOT ALWAYS TELL THE WHOLE STORY
by John Murphy,
Chief Technical Analyst, StockCharts.com
THE FAB FIVE HOLD THEIR BREAKOUTS... Link for today's video. It was a wild trading week as stocks dipped sharply on Wednesday and recovered with an equally sharp advance on Thursday. The Fed, of course, got the blame for this week's volatility. Despite the dip and...
READ MORE
MEMBERS ONLY

How Life Hacking Applies To Us As Individual Investors
by Gatis Roze,
Author, "Tensile Trading"
Life hacking was a term first tossed around by computer programmers in the ‘80s as the label they used trying to get things done better and faster. These days, it has a wider definition incorporating improved productivity and personal enrichment. Wikipedia defines it this way: “Life hacking refers to any...
READ MORE
MEMBERS ONLY

SPY Holds Breakout and Gap - UUP Surges
by Arthur Hill,
Chief Technical Strategist, TrendInvestorPro.com
Stocks moved higher on Thursday with the finance sector leading the charge. The Finance SPDR (XLF) gained 1.58% and the Regional Bank SPDR (KRE) advanced 2.04%. The finance sector and banks clearly like what they heard from the Fed. The Home Construction iShares (ITB) fell back with a...
READ MORE
MEMBERS ONLY
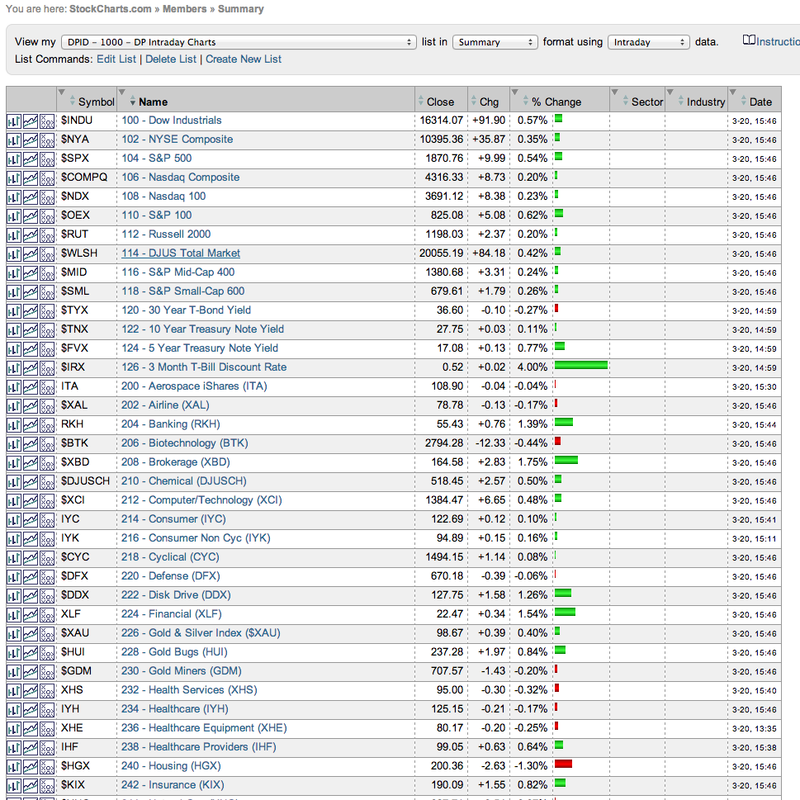
DecisionPoint Intraday ChartPack - A "Must-Have"
by Erin Swenlin,
Vice President, DecisionPoint.com
I use this ChartPack during every trading day. It is absolutely invaluable and a "must-have" for any of you who tend to find yourself glued to StockCharts when the market is open. The beauty of this ChartPack, it is only one ChartList, so for any of you that...
READ MORE
MEMBERS ONLY

$USD SNAPS OUT OF A DOWNTREND -- THE CURRENCY PITS WERE YELLING YESTERDAY -- $XEU THE EURO HEADS LOWER AFTER A FAILED BREAKOUT -- $COPPER PRINTS A BULLISH OUTSIDE DAY -- $GOLD PULLS BACK LOOKING FOR SUPPORT -- THE BONDS WERE QUIET THROUGH THE FED MEETING
by John Murphy,
Chief Technical Analyst, StockCharts.com
$USD SNAPS OUT OF A DOWNTREND ... The $USD started falling the week after the last Fed meeting. Chart 1 shows a 2 hour chart of the UUP which gives us intraday data for the $USD. The six-week downtrend was relatively smooth and consistent. Two weeks ago, the dollar dropped below...
READ MORE
MEMBERS ONLY
IWM Tests Breakout - GLD Breaks Channel Trend Line
by Arthur Hill,
Chief Technical Strategist, TrendInvestorPro.com
Stock market action was quite volatile around the Fed policy statement and the major index ETFs closed modestly lower by the time the dust settled. Weakness was pretty much across the board with IWM losing .57%, QQQ falling .54% and SPY declining .53%. Notice, though, that these declines are modest...
READ MORE
MEMBERS ONLY
Charts: AMD, CSCO, DRI, EL, MRVL
by Arthur Hill,
Chief Technical Strategist, TrendInvestorPro.com
AMD Breaks Pennant Pattern.
CSCO Firms at Key Retracement.
Plus $DRI, $EL, $MRVL
Individual charts are below video.
Sorry but your browser doesn't support HTML5 video.
**This chart analysis is for educational purposes only, and should not
be construed as a recommendation to buy, sell or sell-short said...
READ MORE
MEMBERS ONLY
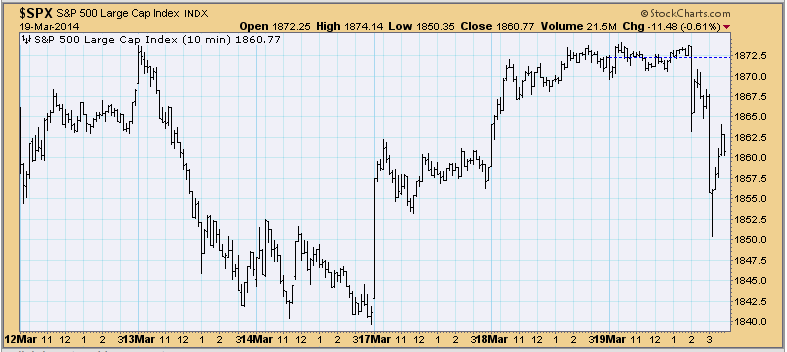
Fed Fall Not Fatal - DP Chart Gallery Analysis
by Erin Swenlin,
Vice President, DecisionPoint.com
Today saw a sell-off after the Fed announced that it would likely be raising interest rates sooner rather than later. Looking at the 10-minute bar chart below from the DP Intraday ChartPack, we see that while price dropped fairly far, it rebounded to make up almost half of the loss....
READ MORE