MEMBERS ONLY
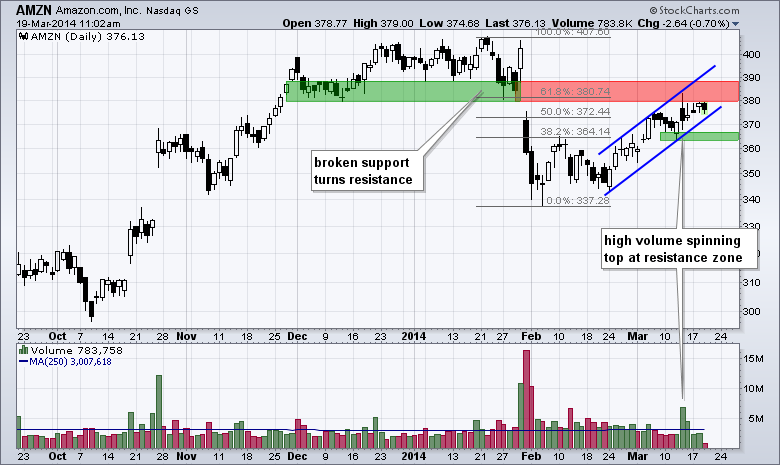
Amazon Forms Big Spinning Top at Key Retracement

by Arthur Hill,
Chief Technical Strategist, TrendInvestorPro.com
Amazon (AMZN) remains in a short-term uptrend, but the stock is nearing a potential reversal zone. First, notice that the stock broke down with high volume in late January. After some bouncing in February, AMZN mounted an advance the last four weeks and retraced around 62% of the prior decline....
READ MORE
MEMBERS ONLY

Small-Caps and Techs Lead Flag Breakouts
by Arthur Hill,
Chief Technical Strategist, TrendInvestorPro.com
Stocks extended their gains ahead of today's Fed meeting. The Russell 2000 ETF (IWM) led the charge with a 1.5% advance. Techs were also strong as the Technology SPDR (XLK) led the sectors with a 1.3% gain. Strength in the Semiconductor SPDR (XSD), Internet ETF (FDN)...
READ MORE
MEMBERS ONLY
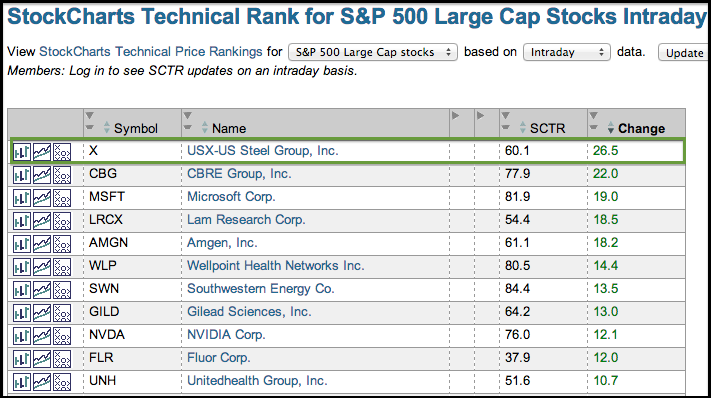
US Steel Tops the List of SCTR Movers
by Arthur Hill,
Chief Technical Strategist, TrendInvestorPro.com
US Steel (X) is getting a bounce off support on the price chart and its SCTR is breaking above 50 with a big move. This list below shows eleven S&P 500 stocks with the biggest changes in their StockCharts Technical Rank (SCTR). Two are HMO stocks (UNH, WLP)...
READ MORE
MEMBERS ONLY

Gold Sentiment Still Negative

by Carl Swenlin,
President and Founder, DecisionPoint.com
Central Gold Trust (GTU) is a closed-end mutual fund, which means that it trades like a stock on the NYSE. The fund owns only gold -- the metal, not stocks. Closed-end funds trade based upon the bid and ask, without regard to their net asset value (NAV). Because of this,...
READ MORE
MEMBERS ONLY

SPY SUCCESSFULLY TESTS FIRST SUPPORT LEVEL -- XLI AND XLY BOUNCE OFF EARLY MARCH LOWS -- XLK LEADS MARKET HIGHER -- MSFT LEADS TECHS HIGHER -- INTEL EXTENDS CONSOLIDATION -- BIOTECH ISHARES BOUNCES OFF SUPPORT ZONE

by John Murphy,
Chief Technical Analyst, StockCharts.com
SPY SUCCESSFULLY TESTS FIRST SUPPORT LEVEL... Link for today's video. The S&P 500 SPDR (SPY) fell sharply last week, but firmed on Friday and bounced off support this week. Chart 1 shows SPY breaking out to a new high with a gap in early March. This...
READ MORE
MEMBERS ONLY

Breadth Indicators Bounce - QQQ Gaps off Feb Lows
by Arthur Hill,
Chief Technical Strategist, TrendInvestorPro.com
Stocks surged on Monday with the Dow Diamonds (DIA) leading the way (+1.07%). All sectors were higher with the industrials, finance and technology sectors gaining over 1%. The consumer discretionary sector lagged a bit with a .67% gain. Housing stocks will be in focus today and the FOMC will...
READ MORE
MEMBERS ONLY
Charts: AAPL, ADP, COP, CTXS, CY
by Arthur Hill,
Chief Technical Strategist, TrendInvestorPro.com
AAPL Breaks Wedge after Engulfing Pattern.
ADP Breaks Out of Flag on Good Volume.
Plus COP, CTXS, CY
Individual charts are below video.
Sorry but your browser doesn't support HTML5 video.
**This chart analysis is for educational purposes only, and should not
be construed as a recommendation to...
READ MORE
MEMBERS ONLY

DP ChartStyles Made Easy

by Erin Swenlin,
Vice President, DecisionPoint.com
Having basically "grown up" using the DecisionPoint.com website charts, it was critical to me to create these ChartStyles on Stockcharts.com as soon as I could. If you really like these DP ChartStyles, you can copy them from this blog and I'll show you how...
READ MORE
MEMBERS ONLY
QQQ Tests Support - TLT Challenges Resistance
by Arthur Hill,
Chief Technical Strategist, TrendInvestorPro.com
Stocks were hit with selling pressure last week as the major index ETFs declined 1.75-2.25 percent. The declines were relatively modest and came the week after most major index ETFs and sector SPDRs hit new highs. This means the long-term trend is still up and any short-term weakness...
READ MORE
MEMBERS ONLY
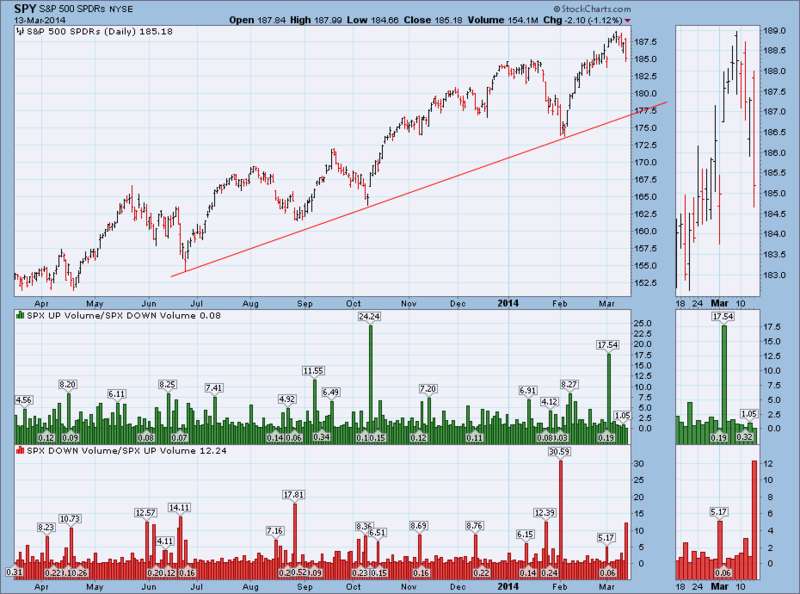
Volume Ratios Turn Bearish
by Carl Swenlin,
President and Founder, DecisionPoint.com
In his book "Winning on Wall Street", the late Marty Zweig showed us the value of volume ratios. A ratio of 9:1 or greater of up/down volume is considered to be very bullish and 9:1 down/up volume is considered to be very bearish. We...
READ MORE
MEMBERS ONLY

Don't Forget To Login!
by Erin Swenlin,
Vice President, DecisionPoint.com
The DecisionPoint.com Daily Blog on the old website is now using Stockcharts.com generated charts. Many subscribers to the Blog are clicking on the charts to open them in the SharpCharts Workbench which is fantastic! Unfortunately, when they get there, the workbench has limited features and time frames available....
READ MORE
MEMBERS ONLY
March Madness Underway

by Tom Bowley,
Chief Market Strategist, EarningsBeats.com
Nope, I'm not referring to college basketball. Instead, it's this wacky stock market. In my last article, I discussed several reasons why the 2014 advance is on shaky ground. Since then, we've seen increased volatility and lots of whipsaw action. Earlier in March, our...
READ MORE
MEMBERS ONLY
U.S. Stocks Have a Bad Week
by John Murphy,
Chief Technical Analyst, StockCharts.com
My Wednesday message warned that the Dow Industrials could run into profit-taking near its January highs, and that weekly indicators for the S&P 500 were giving "negative divergences" which also warned of a market pullback. Combined with increased tensions in the Ukraine and increased concerns about...
READ MORE
MEMBERS ONLY
Using StockCharts' "Golden Line"
Hello Fellow ChartWatchers!
There's been a sea-change in the markets with the recent uncertainty about Russia and the Ukraine. Almost instantly the bullishness on the Sector Rotation charts turned into bearish concern with defensive sectors like Utilities taking off. John Murphy, Art Hill and the rest of our...
READ MORE
MEMBERS ONLY
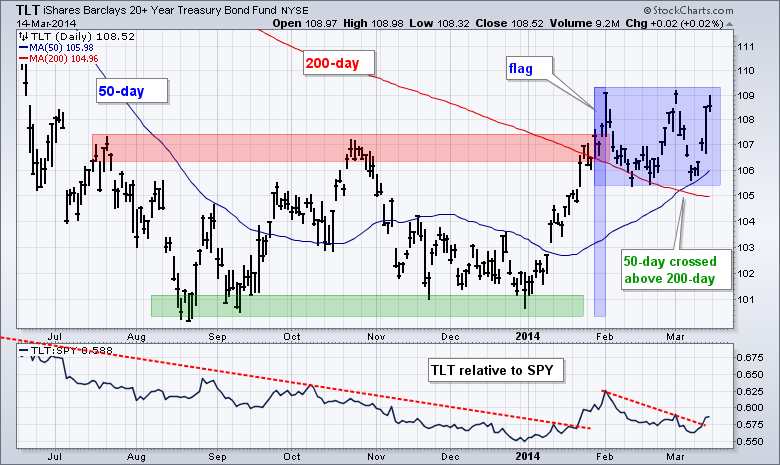
Treasury Bond ETFs Surge off Golden Crosses
by Arthur Hill,
Chief Technical Strategist, TrendInvestorPro.com
Stocks and bonds have been inversely correlated for most of the last four years, which means they tend to move in opposite directions. This inverse correlation showed up in January as stocks swooned and Treasuries surged. February was mixed because stocks surged and Treasuries traded flat. The inverse correlation reasserted...
READ MORE
MEMBERS ONLY

FOREIGN STOCKS LEAD US MARKET LOWER -- SHORT-TERM MARKET CHARTS SHOW DETERIORATION -- UKRAINE TENSIONS WEIGH ON GERMANY -- CHINA WEAKNESS AND RISING YEN WEIGH ON JAPAN -- FALLING BOND YIELDS ALSO HINT AT STOCK WEAKNESS
by John Murphy,
Chief Technical Analyst, StockCharts.com
U.S. STOCKS HAVE A BAD WEEK ... My Wednesday message warned that the Dow Industrials could run into profit-taking near its January highs, and that weekly indicators for the S&P 500 were giving "negative divergences" which also warned of a market pullback. Combined with increased tensions...
READ MORE
MEMBERS ONLY

SPY FILLS THE GAP AND TESTS FIRST SUPPORT -- XLY, XLI AND XLK TEST FIRST SUPPORT LEVELS -- XRT IS STILL AN UNDERPERFORMER -- ITB NEARS IMPORTANT SUPPORT ZONE -- XME FORMS CUP-WITH-HANDLE PATTERN -- TLT AND IEF SURGE OFF KEY MOVING AVERAGES
by John Murphy,
Chief Technical Analyst, StockCharts.com
SPY FILLS THE GAP AND TESTS FIRST SUPPORT... Link for today's video. Stocks fell back this week and finally alleviated some of the short-term oversold conditions that built up in early March. The bulk of the evidence remains bullish for stocks, but the list of concerns grew this...
READ MORE
MEMBERS ONLY

Mr. Market Wizard: Jack Schwager Speaks Part II

by Gatis Roze,
Author, "Tensile Trading"
President Harry Truman once said “We must have strong minds, ready to accept facts as they are.” He must have been addressing a convention of individual investors.
Let me pick-up this week where I left off last week. If you missed last week’s blog, I suggest you visit that...
READ MORE
MEMBERS ONLY

Breadth Breaks Down - TLT Surges - SPY Fills Gap
by Arthur Hill,
Chief Technical Strategist, TrendInvestorPro.com
Stocks came under broad selling pressure with the Nasdaq 100 ETF (QQQ) leading the way lower. The major index ETFs fell with losses ranges from 1% to 1.5%. These losses are relatively modest. Eight of the nine sectors were down. The Utilities SPDR (XLU) bucked the trend and posted...
READ MORE
MEMBERS ONLY

Climactic TRIN Reading
by Erin Swenlin,
Vice President, DecisionPoint.com
On a day with plenty of selling, you will often see a downward spike in the TRIN reading. Readings of over 2.0 are frequently followed by a price rebound the following day.
Indeed, many of these high readings actually precede price bottoms. It is most likely too early to...
READ MORE
MEMBERS ONLY
Volume Ratios
by Carl Swenlin,
President and Founder, DecisionPoint.com
In his book "Winning on Wall Street", the late Marty Zweig showed us the value of volume ratios. A ratio of 9:1 or greater of up/down volume is considered to be very bullish and 9:1 down/up volume is considered to be very bearish. We...
READ MORE
MEMBERS ONLY

GOLD MINER ETFS ARE ALL THE RAGE -- JUNIOR MINERS ARE NOT CONFIRMING THE $XEU MOVE -- PRECIOUS METAL CHARTS ARE ALL STRONG EXCEPT COPPER -- ENERGY CHARTS ARE WEAKENING � SOFT COMMODITY CHARTS ARE SOARING
by John Murphy,
Chief Technical Analyst, StockCharts.com
GOLD MINER ETFS ARE ALL THE RAGE... On the Top 10 Up ETF tab, the gold miners look particularly strong. The list that is shown in Chart 1 was dominated by precious metal ETF's today. GDXJ represents a flag pattern. It is trying to break out to the...
READ MORE
MEMBERS ONLY

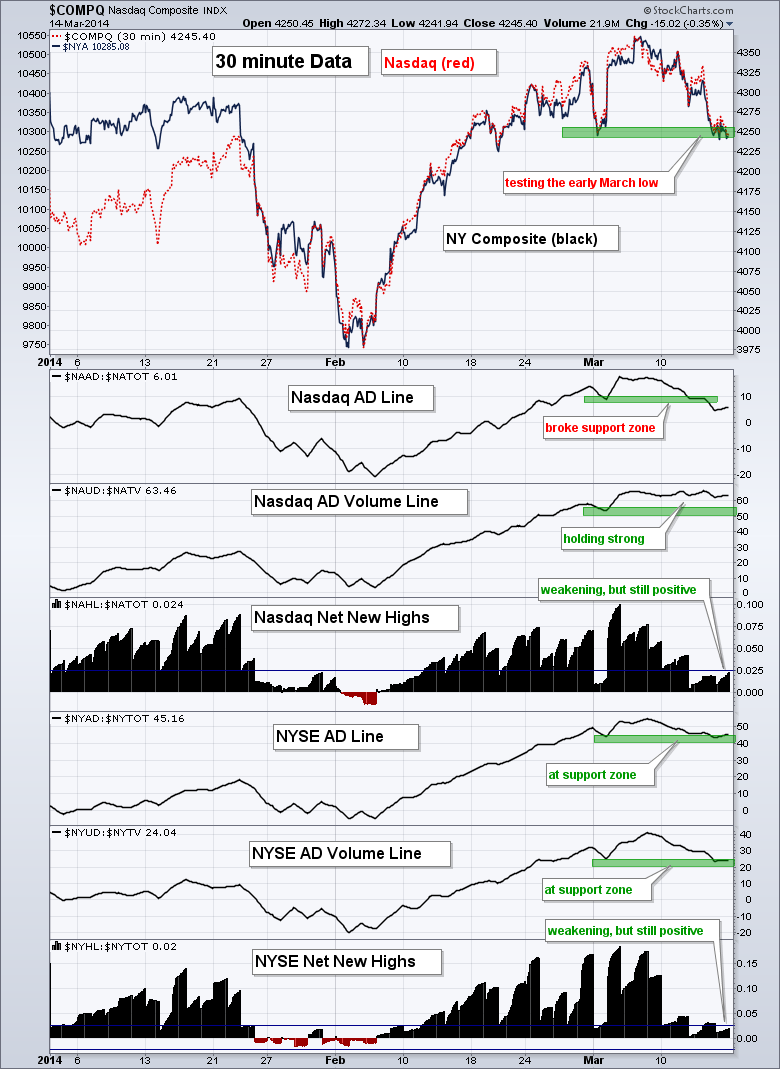
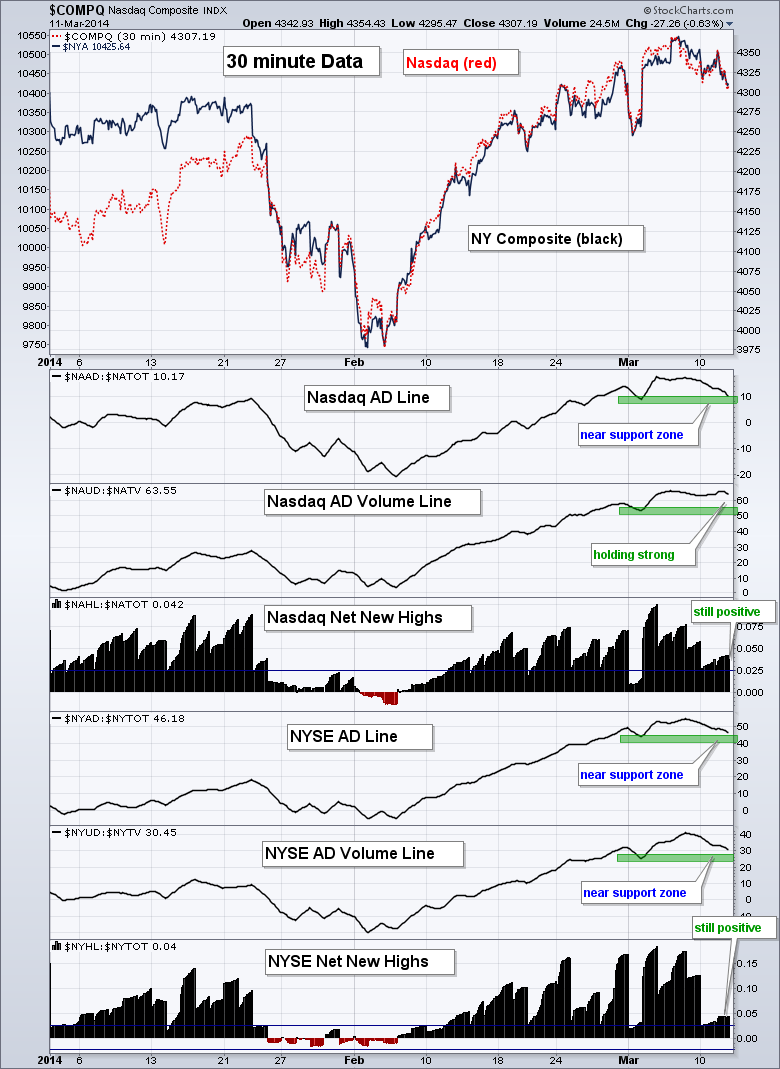
AD Lines Tests Support - QQQ Forms Bull Flag
by Arthur Hill,
Chief Technical Strategist, TrendInvestorPro.com
Programming note: Charts of Interest will not be posted today and return next Tuesday. Stocks were mixed on Wednesday and the major index ETFs have edged lower over the past week. The Nasdaq and NYSE AD Lines are near support zones, as is the NYSE AD Volume Line. The Nasdaq...
READ MORE
MEMBERS ONLY

Utilities Light up the Sector MarketCarpet
by Arthur Hill,
Chief Technical Strategist, TrendInvestorPro.com
Stocks in the utilities sector stood out on Wednesday. As the Sector MarketCarpet below shows, the utilities sector has the most, and darkest, green of the nine sectors (blue outline). Only one square (ED) was red. This showed broad strength within the sector and it was enough to power the...
READ MORE
MEMBERS ONLY

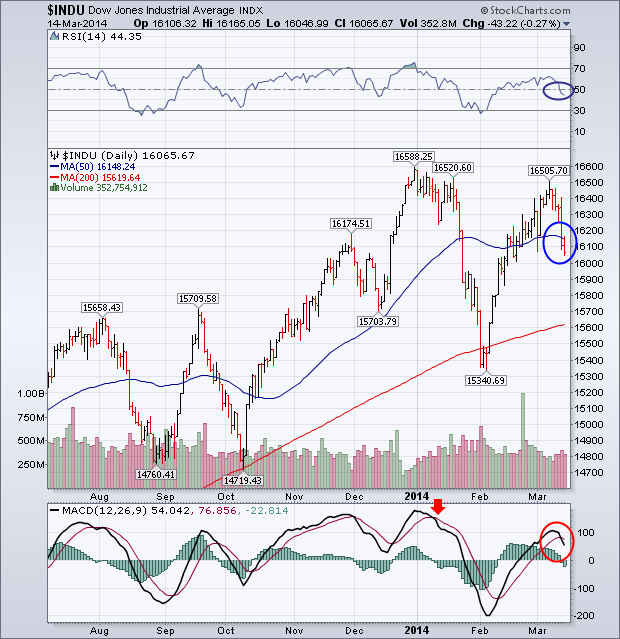
INDUSTRIAL COMMODITIES DON'T PARTICIPATE IN WEATHER-RELATED COMMODITY RALLY -- PLUNGE IN COPPER HINTS AT PROBLEMS IN CHINA -- NEW SELLING IN EMERGING MARKETS BEARS WATCHING -- DOW NEARS A TEST OF JANUARY HIGH -- WEEKLY S&P 500 INDICATORS RAISE CONCERNS
by John Murphy,
Chief Technical Analyst, StockCharts.com
MAJOR DIVERGENCE IN COMMODITY RALLY... I've written several messages about the recent rise in commodity prices. I've also pointed out, however, that most of the commodity gains were in weather-related agricultural markets (and natural gas). From an intermarket perspective, however, weather-related markets have much less impact...
READ MORE
MEMBERS ONLY
IWM Leads Correction - Oil Breaks Down - Gold Holds Up
by Arthur Hill,
Chief Technical Strategist, TrendInvestorPro.com
Stocks extended their correction with small-caps leading the way lower. The Russell 2000 ETF (IWM) and the Russell MicroCap iShares (IWC) led the major index ETFs lower with declines around 1%. All sectors were down with the Materials SPDR (XLB) and Energy SPDR (XLE) getting hit the hardest. Spot Copper...
READ MORE
MEMBERS ONLY
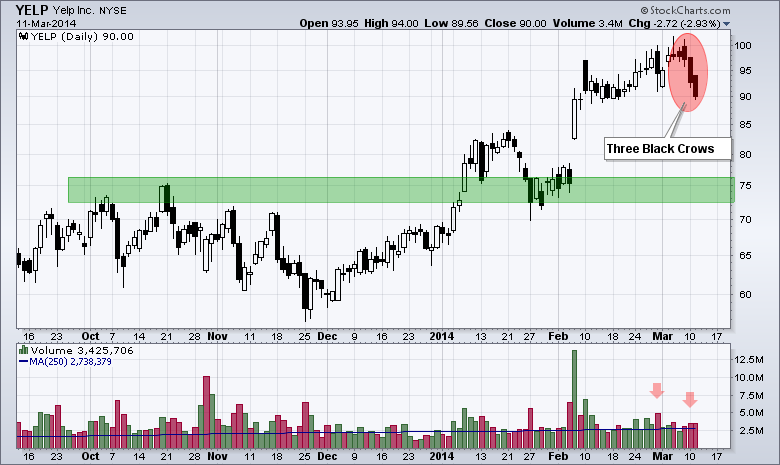
Yelp Traces out a Rare Three Black Crows Pattern
by Arthur Hill,
Chief Technical Strategist, TrendInvestorPro.com
Yelp ($YELP) came across the Three Black Crows scan on Tuesday. It all started with a black candlestick three days ago (Friday). The stock then opened above the Friday's close on Monday and sold off to form another black candlestick. The stock opened above Monday's close...
READ MORE
MEMBERS ONLY

Announcing the DecisionPoint Market Indicator ChartPack! All of Our Key Charts in One Easy-to-Use Package
Good news DecisionPoint.com transplants and StockCharts technical analysts - the DecisionPoint Market Indicator ChartPack has been released! This ChartPack includes the market indicators that made Carl Swenlin and DecisionPoint famous. If you are a DecisionPoint users, you really should install this ChartPack! Instructions for doing that are below.
The...
READ MORE
MEMBERS ONLY

CONSUMER STAPLES SPDR MINDS THE GAP -- EQUAL-WEIGHT CONSUMER STAPLES ETF HITS NEW HIGH -- TECHNOLOGY SPDR LAGS ITS EQUAL-WEIGHT COUNTERPART -- PG CHALLENGES RESISTANCE ZONE -- ENERGY SPDR CONSOLIDATES NEAR HIGHS -- XOM AND CVX HIT RESISTANCE ZONES
by John Murphy,
Chief Technical Analyst, StockCharts.com
CONSUMER STAPLES SPDR MINDS THE GAP ... Link for today's video. The Consumer Staples SPDR (XLP) extended its advance with a gap up in early March and an approach to the 2013 highs. Chart 1 shows XLP plunging below support in late January and rebounding sharply in February to...
READ MORE
MEMBERS ONLY
Charts: AKS, DGX, DNR, FNSR, HLF, INTC
by Arthur Hill,
Chief Technical Strategist, TrendInvestorPro.com
AKS Finds Support with Good Volume.
DGX Forms Bullish Hammer.
Plus DNR, FNSR, HLF, INTC
Individual charts are below video.
Sorry but your browser doesn't support HTML5 video.
**This chart analysis is for educational purposes only, and should not
be construed as a recommendation to buy, sell or...
READ MORE
MEMBERS ONLY

Intraday Breadth Indicators Remain Bullish
by Arthur Hill,
Chief Technical Strategist, TrendInvestorPro.com
Stocks took a breather on Monday as the major index ETFs traded mixed. The Nasdaq 100 ETF (QQQ) closed with a miniscule gain, while the S&P 500 SPDR (SPY) closed with a fractional loss. The sectors were also mixed with the five down and four up. The HealthCare...
READ MORE
MEMBERS ONLY

Nasdaq 100 Intermediate-Term Weakness
by Erin Swenlin,
Vice President, DecisionPoint.com
While the other major indexes in the DP Chart Gallery (SPX, OEX and DJIA) continue to show positive momentum with rising Price Momentum Oscillator (PMO) readings, I noticed the Nasdaq 100 intermediate-term indicators including the PMO reveal weakness.
In the chart below note that the PMO has topped and both...
READ MORE
MEMBERS ONLY

SHANGHAI COMPOSITE FORMS YET ANOTHER LOWER HIGH -- COAL ETF AND INDEX TURN SHARPLY LOWER -- COPPER MINERS ETF BREAKS SUPPORT -- STEEL ETF COMPLETES THREE-POINT REVERSAL -- US STEEL AND NUCOR FORGE LOWER HIGHS
by John Murphy,
Chief Technical Analyst, StockCharts.com
SHANGHAI COMPOSITE FORMS YET ANOTHER LOWER HIGH... Link for today's video. It is tempting to suggest that the Shanghai Composite ($SSEC) is testing a major support zone, but the trend is clearly down and support levels are not expected to hold in downtrends. Chart 1 shows the index...
READ MORE
MEMBERS ONLY

New Highs Affirm Uptrend, But the Run is Extended
by Arthur Hill,
Chief Technical Strategist, TrendInvestorPro.com
The major index ETFs extended their uptrends with new highs last week. These advances are getting extended with the Russell 2000 ETF (IWM) and S&P MidCap SPDR (MDY) up around 10% in the last five weeks. Nevertheless, the short-term trends are up and we have yet to see...
READ MORE
MEMBERS ONLY

Climactic Activity On Volatile Short-Term Indicators
by Carl Swenlin,
President and Founder, DecisionPoint.com
Yes! It's Carl. I thought it was about time that I contribute to the new DecisionPoint blog on StockCharts.com. I plan to periodically blog here when I find something of particular interest that I'd like to share, similar to the Chart Spotlight on DecisionPoint.com....
READ MORE
MEMBERS ONLY

Adding DecisionPoint.com's Chart Collections to Your StockCharts Account
by Erin Swenlin,
Vice President, DecisionPoint.com
I am thrilled to announce that StockCharts members - including all DecisionPoint.com members - can now install two new DecisionPoint ChartPacks for free! We've just released our popular "Straight Shots" charts and our Rydex Asset Analysis charts as installable ChartPacks for your StockCharts account.
But...
READ MORE
MEMBERS ONLY

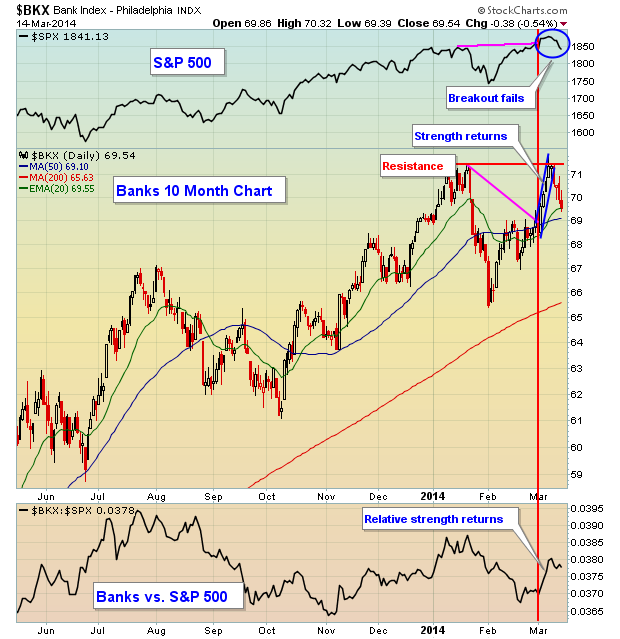
COPPER FOLLOWS THE DOLLAR LOWER -- SLOW AND STEADY WINS THE RACE FOR STOCKS -- 10-YR TREASURY YIELD BREAKS FEBRUARY HIGH -- IEF FORGES OUTSIDE REVERSAL WEEK -- KEY BREADTH INDICATORS CONFIRM STOCK MARKET STRENGTH
by John Murphy,
Chief Technical Analyst, StockCharts.com
COPPER FOLLOWS THE DOLLAR LOWER... Link for today's video. Stocks extended their winning days as most of the major stock indices hit new highs again this week. A new high in the Finance SPDR (XLF) and renewed relative strength in the finance sector is perhaps the most significant...
READ MORE
MEMBERS ONLY

Mr. Market Wizard: Jack Schwager Speaks Part I
by Gatis Roze,
Author, "Tensile Trading"
A quick survey of the Amazon website lists over a dozen books written by Jack Schwager, but that is not what impresses me the most. What I find worthy for some sort of listing in the Guiness Book of World Records is that in writing these volumes, he has gained...
READ MORE
MEMBERS ONLY

Identifying Fund Leaders with the Fidelity MarketCarpet (video)
by Arthur Hill,
Chief Technical Strategist, TrendInvestorPro.com
Chartists can identify mutual fund leaders and laggards using the Rydex, Fidelity and Profunds MarketCarpets. Note that these are updated after the market close. As the MarketCarpet below shows, the Gold Fund, Leisure Fund, Latin America Fund, Japan Fund and Nordic Fund led on Thursday. Funds associated with Biotechs, Healthcare,...
READ MORE
MEMBERS ONLY

SPX AD Line Hits New High to Show Broad Strength
by Arthur Hill,
Chief Technical Strategist, TrendInvestorPro.com
Stocks finished mixed again with some strength coming into the S&P 500 SPDR (SPY) and some weakness in the Russell 2000 ETF (IWM). The moves, however, were fractional and insignificant. Six of the nine sectors were up with the three defensive sectors moving lower (healthcare, utilities and consumer...
READ MORE
