MEMBERS ONLY
Bullish Sentiment Continues To Increase - DP Gallery Sentiment Review

by Erin Swenlin,
Vice President, DecisionPoint.com
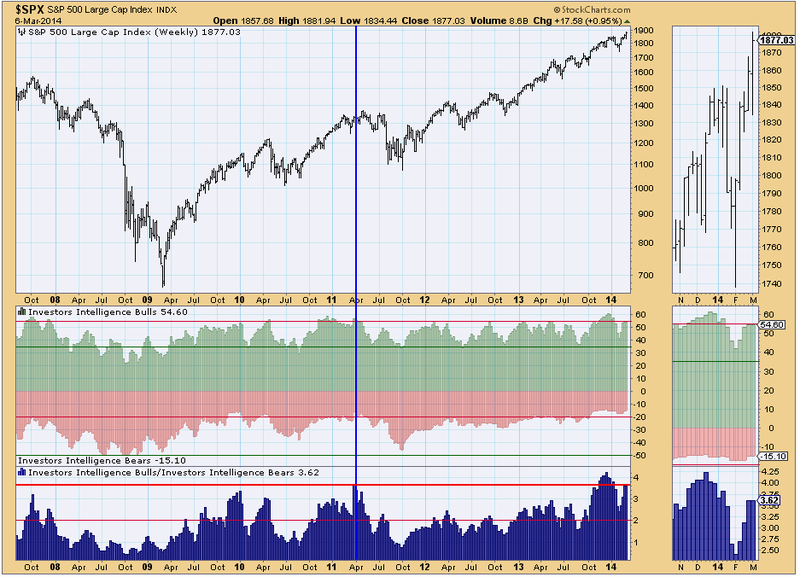
In my ChartWatchers article last weekend, I reviewed the sentiment charts in the DP Gallery. I thought it would be interesting to see what's happened since then. Bullish sentiment continues to rise.
Investor's Intelligence surveys over a hundred independent market newsletters and assesses each author'...
READ MORE
MEMBERS ONLY
Boeing Turns Down Right Dull

by Arthur Hill,
Chief Technical Strategist, TrendInvestorPro.com
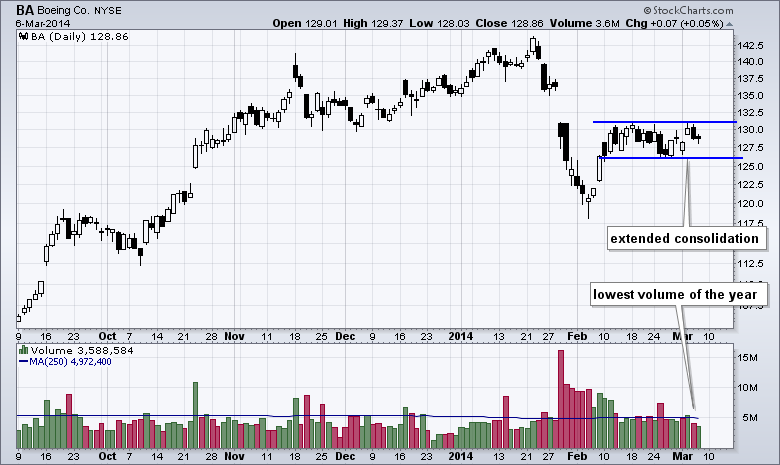
Boeing (BA) took a hit in January, rebounded in early February and then moved into a tight consolidation. Volatility has slowed to a crawl as the stock traded between 126 and 131 since February 11th. Trading volume is also slowing because Thursday's volume was the lowest of the...
READ MORE
MEMBERS ONLY

$RUT UP 12% IN ONE MONTH, UP 254% IN 5 YEARS -- CAT, JOY, DE HAVE STRONG DAY -- FINANCIALS HAVE ANOTHER BIG DAY -- SOME LARGE MARKET ANNIVERSARIES -- A LOOK AT AN INTERESTING CYCLE

by John Murphy,
Chief Technical Analyst, StockCharts.com
$RUT UP 12% IN ONE MONTH, 254 % IN 5 YEARS... The $SPX has obviously been on a serious run since the 3 digit lows of 2009. The rise since those lows has been staggering.
From February 2014 lows:
$SPX 8 %
$COMPQ 10 %
$RUT 12 %
From March 2009 lows:
$SPX 182...
READ MORE
MEMBERS ONLY

Charts: AMD, IMAX, LRCX, NEM, PBCT, WY
by Arthur Hill,
Chief Technical Strategist, TrendInvestorPro.com
AMD Forms Tight Consolidation after Surge.
IMAX Bounces off Support Again.
Plus LRCX, NEM, PBCT, WY
Individual charts are below video.
Sorry but your browser doesn't support HTML5 video.
**This chart analysis is for educational purposes only, and should not
be construed as a recommendation to buy, sell...
READ MORE
MEMBERS ONLY

Intraday AD Lines Surge to New Highs
by Arthur Hill,
Chief Technical Strategist, TrendInvestorPro.com
Stocks meandered on Wednesday and the major index ETFs finished mixed. The Russell 2000 ETF (IWM) edged lower as the S&P 500 SPDR (SPY) closed slightly higher. The sectors were also mixed, but we saw relative strength from the Consumer Discretionary SPDR (XLY) and the Finance SPDR (XLF)...
READ MORE
MEMBERS ONLY

Price Momentum Shifts - Creating A Watch List Using the PMO
by Erin Swenlin,
Vice President, DecisionPoint.com
The DecisionPoint.com merge with StockCharts.com brought a new indicator, the Price Momentum Oscillator (PMO). The PMO is highly versatile and quite good at identifying momentum shifts early. To read more about the PMO, click here for the ChartSchool article.
One of the ways I like to use the...
READ MORE
MEMBERS ONLY

AUTOS, BANKS, AND RAILS HAVE A STRONG DAY -- LEADERS INCLUDE BAC, GM, AND CSX -- AUTO STRENGTH MAY BE BOOSTING PALLADIUM AND PLATINUM ISHARES -- MOVING AVERAGE TRENDS SHOW IMPROVEMENT
by John Murphy,
Chief Technical Analyst, StockCharts.com
MORE STOCKS ARE TRADING ABOVE MOVING AVERAGE LINES... One of my recent concerns about the stock market rally was the fact that a smaller percentage of stocks were trading above moving average lines. That situation, however, has shown noticeable improvement. The blue line in Chart 1 plots the NYSE Percent...
READ MORE
MEMBERS ONLY
IWM Leads with Big Gap, but Overbought Conditions Remain
by Arthur Hill,
Chief Technical Strategist, TrendInvestorPro.com
Stocks surged on the open with the major index ETFs gapping substantially higher. There was some, but not much follow through after the gap, which suggest that most of the buying pressure occurred in the first twenty minutes. As noted in yesterday's Market Message, there are some pretty...
READ MORE
MEMBERS ONLY

Help! Here's How To Find It On StockCharts!
by Erin Swenlin,
Vice President, DecisionPoint.com
Let's face it,whether you're new to the StockCharts.com website or you've been with us for years, one day you will likely need some help. I know I need help regularly and I've learned (as most of you) that you should...
READ MORE
MEMBERS ONLY

SMALL-CAPS LEAD MARKET HIGHER WITH BIG MOVES -- AN OVERBOUGHT STUDY FOR IWM -- EQUAL-WEIGHT FINANCE ETF HITS NEW HIGH -- GOLDMAN AND MORGAN BREAK FEBRUARY HIGHS AS JPM PULLS A REVERSAL -- MONSANTO LEADS MATERIALS SPDR TO NEW HIGH
by John Murphy,
Chief Technical Analyst, StockCharts.com
SMALL-CAPS LEAD MARKET HIGHER WITH BIG MOVES... Link for today's video. Turnaround Tuesday lived up to its reputation as stocks surged with a broad-based rally. The Russell 2000 ETF (IWM) and S&P SmallCap iShares (IJR) led the major index ETFs with sharp gains. Chart 1 shows...
READ MORE
MEMBERS ONLY

International PerfChart Shows Strength in Developed Markets
by Arthur Hill,
Chief Technical Strategist, TrendInvestorPro.com
The PerfChart below shows the year-to-date performance for ten country indices. Notice that US, European and Australian stocks are up this year. Asia shows some weakness because the Shanghai Composite, Hang Seng Composite and Nikkei 225 are down. The Bovespa, a big emerging market, is also down sharply this year....
READ MORE
MEMBERS ONLY
Charts: BBRY, CTXS, DE, FTI, HLF, PMCS
by Arthur Hill,
Chief Technical Strategist, TrendInvestorPro.com
BBRY Forms Flag after High Volume Gap.
CTXS Surges and Forms Tight Consolidation.
Plus DE, FTI, HLF, PMCS
Individual charts are below video.
Sorry but your browser doesn't support HTML5 video.
**This chart analysis is for educational purposes only, and should not
be construed as a recommendation to...
READ MORE
MEMBERS ONLY

SPY and IMW Affirm Support with Bounces
by Arthur Hill,
Chief Technical Strategist, TrendInvestorPro.com
Stocks started the day under selling pressure, but firmed around midday and bounced in the afternoon. Even though the bounce was not that strong, it was positive to see stocks recover after the initial decline. Stock futures are sharply higher this morning and it looks like the situation in Ukraine...
READ MORE
MEMBERS ONLY

SPY FOLLOWS SPINNING TOP WITH GAP DOWN -- THREE SUPPORTS FOR THREE KEY SECTORS -- INTC WEIGHS ON SEMICONDUCTOR ETF -- GOLD SURGES TO NEW HIGH FOR 2014 -- GERMAN DAX FAILS TO CONFIRM OTHER EU INDICES
by John Murphy,
Chief Technical Analyst, StockCharts.com
SPY FOLLOWS SPINNING TOP WITH GAP DOWN... Link for today's video. Last week I wrote about Monday's shooting star pattern in the S&P 500 SPDR (SPY). This bearish candlestick pattern was never confirmed because the ETF closed above the shooting star high on Friday...
READ MORE
MEMBERS ONLY

A Rounding Bottom Takes Shape for CORN
by Arthur Hill,
Chief Technical Strategist, TrendInvestorPro.com
The Corn Trust ETF (CORN) sports a rounding bottom and breakout over the last few months. The rounding bottom extends from mid November to the end of February with a big bullish engulfing in the middle. The breakout is still a work in progress as CORN stalls with a flat...
READ MORE
MEMBERS ONLY
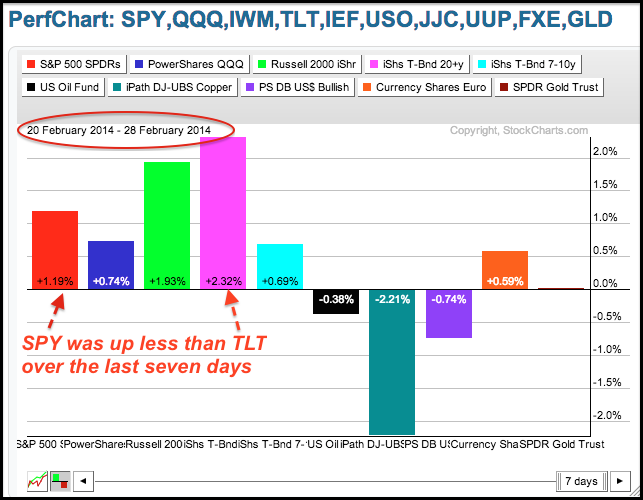
Bonds Start Outperforming Stocks
by Arthur Hill,
Chief Technical Strategist, TrendInvestorPro.com
The Russian-Ukraine situation is affecting the markets this morning. Stocks are down in pre-market, the Euro is down and the Yen is down. Even though the Dollar is up, gold and oil are trading sharply higher, as is Natural Gas. European supply disruptions are likely because around half of Russian...
READ MORE
MEMBERS ONLY
I Didn't Know StockCharts.com Did That! v.2.0
Hello Fellow ChartWatchers!
Last year, I had an article dedicated to things that many people didn't know about StockCharts.com. The list was based on our customer support questions and the feedback we get from our live seminars. I thought now would be a good time to revisit...
READ MORE
MEMBERS ONLY
Schlumberger and Halliburton Lead Oil Service Rally
by John Murphy,
Chief Technical Analyst, StockCharts.com
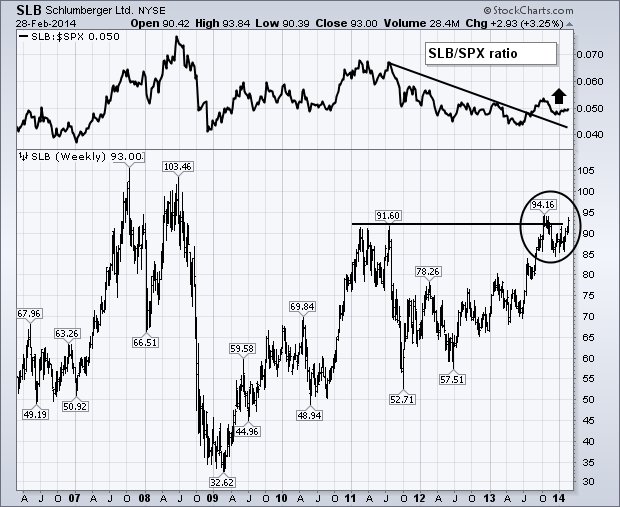
The two biggest stocks in the OIH also happen to be two of the strongest. The weekly bars in Chart 4 show Schlumberger (SLB) nearing a test of its fourth quarter high near 94. A close above that level would put the oil service leader at the highest level in...
READ MORE
MEMBERS ONLY
Pardon The Interruption

by Tom Bowley,
Chief Market Strategist, EarningsBeats.com
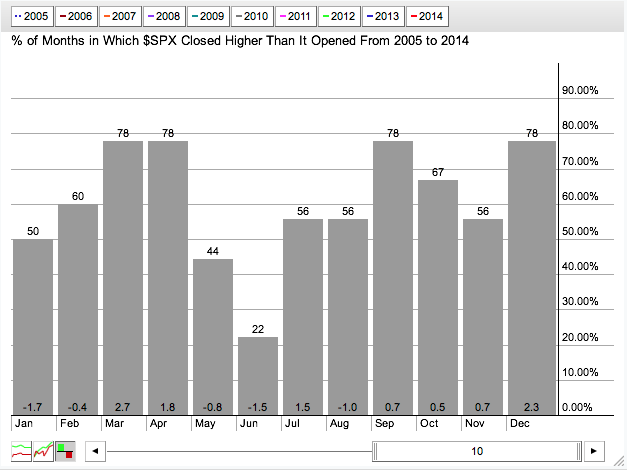
Make no mistake about it, I prefer to be bullish. History supports this notion because the stock market has always tended to move higher more than it moves lower. Dating back to 1950, the S&P 500 has moved higher over 53% of trading days. Did you know that...
READ MORE
MEMBERS ONLY

APRIL CRUDE OIL IS TESTING AUGUST HIGHS -- THAT'S GIVING A BOOST TO ENERGY ETFS -- MARKET VECTORS OIL SERVICE ETF IS BIGGEST PERCENTAGE GAINER -- HALLIBURTON AND SCHLUMBERGER ARE OIL SERVICE LEADERS
by John Murphy,
Chief Technical Analyst, StockCharts.com
APRIL CRUDE OIL IS TESTING AUGUST HIGH ... My last two messages dealt with the recent upturn in commodity markets. During February, the CRB Index reached the highest level in a year. Most of those gains came in natural gas and agricultural markets owing mainly to weather concerns. This week saw...
READ MORE
MEMBERS ONLY

Analyzing the Recent Rise in Investor Sentiment using the DP Chart Gallery

by Carl Swenlin,
President and Founder, DecisionPoint.com
The bulls had been dropping out of the ring during the recent correction, but they're baaaaack.
The DecisionPoint Chart Gallery has a section devoted to sentiment. There is the Investor's Intelligence Survey chart with not only the percentage of bulls and bears, but also a bull-bear...
READ MORE
MEMBERS ONLY
Finance Sector Lags as Consumer Discretionary Catches Up
by Arthur Hill,
Chief Technical Strategist, TrendInvestorPro.com
The market can be divided into nine sectors using the S&P Sector SPDRs and the Rydex Equal-weight Sector ETFs. These sectors can be subsequently divided into three groups: offensive, defensive and other. Technology, finance, consumer discretionary and industrials make up the offensive group, which is key to a...
READ MORE
MEMBERS ONLY

National Oilwell Varco and Two Others Make Big Moves in Relative Strength
by Arthur Hill,
Chief Technical Strategist, TrendInvestorPro.com
The first image shows a screen shot from the StockCharts Technical Rank (SCTR) sorted by change to highlight the biggest movers. Three of these show big moves from relatively low levels (TGT,EW,NOV). Big moves mean something is happening and we should check the charts. The second image shows...
READ MORE
MEMBERS ONLY

Amp Up Your Analysis With Overlays and Annotations
by Erin Swenlin,
Vice President, DecisionPoint.com
The ability to add numerous overlays and annotations has added a new dimension to my charting. It wasn't possible to annotate charts from the DecisionPoint.com website without first putting them in another software program and then using the annotation tools there. After annotating, I'd have...
READ MORE
MEMBERS ONLY

ANOTHER WEEK AND ANOTHER SET OF NEW HIGHS -- DEFINING OVERBOUGHT FOR THE S&P 500 SPDR -- TREASURIES RALLY ALONG WITH STOCKS -- PIMCO BOND ETF HITS NEW HIGH -- AD LINE AND AD VOLUME LINE GET EXTENDED -- NEW HOME SALES COULD HAVE FURTHER ROOM TO RUN
by John Murphy,
Chief Technical Analyst, StockCharts.com
ANOTHER WEEK AND ANOTHER SET OF NEW HIGHS... Link for today's video. Even though stocks are getting overbought again, the bulk of the evidence remains bullish for the stock market. In fact, I should refer to the "bearish" indications as mere "concerns" because they...
READ MORE
MEMBERS ONLY

Tensile Trading ChartPack v2.0: 60 Upgrades to Help You Invest Smarter with Less Effort

by Gatis Roze,
Author, "Tensile Trading"
To the over 500 investors who are presently using my ChartPack, I’ve been sincerely humbled by your many emails and wonderful personal comments. When you are happy, making money and saving time, I’m happy too! My objective is to help you step up your investing another tier with...
READ MORE
MEMBERS ONLY

Stocks, and Bonds, Have A Good Week
by Arthur Hill,
Chief Technical Strategist, TrendInvestorPro.com
Buying pressure continues to outpace selling pressure as the major index ETFs moved higher on Thursday. The Russell MicroCap iShares (IWC) led the way with a .88% gain. The Russell 2000 ETF (IWM) is leading the major index ETFs with a 2.33% gain over the past week. Among the...
READ MORE
MEMBERS ONLY

BONDS ARE TESTING HEAD/SHOULDERS NECKLINE ON YIELDS -- SPX CONTINUES TO TEST WITHIN THE 1830/1860 RANGE -- XLY,XLK,XLI,XLB,XLV ALL HAVE SCTR'S HIGHER THAN 70 -- XLP,XLF,XLE ALL HAVE SCTR'S BELOW 50 -- XLU,XLP, XLV, XLY ARE TRENDING UP THIS MONTH
by John Murphy,
Chief Technical Analyst, StockCharts.com
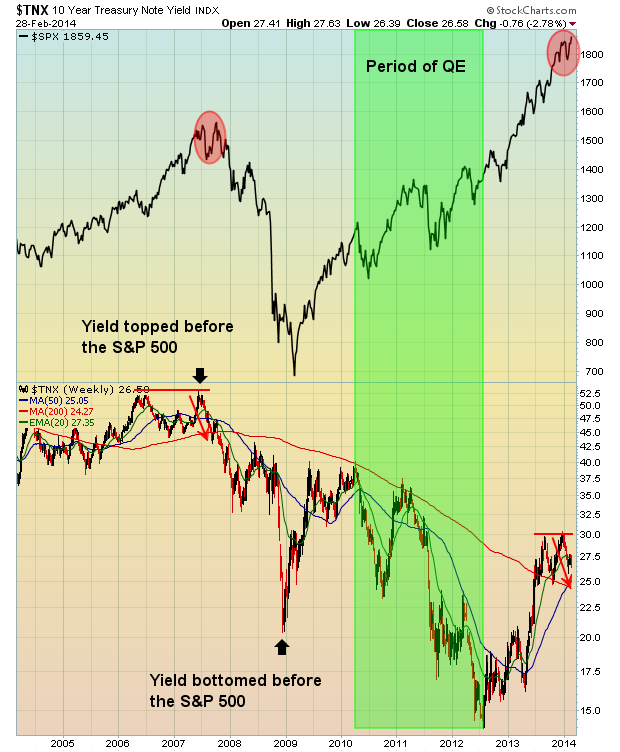
BONDS ARE TESTING HEAD/SHOULDERS NECKLINE ON YIELDS... The $TNX represents the 10 year bond yield as shown in Chart 1. This chart portrays a potential head/shoulders top. As yields go lower, bond prices go higher. This chart needs to be followed as it disagrees with the price action...
READ MORE
MEMBERS ONLY
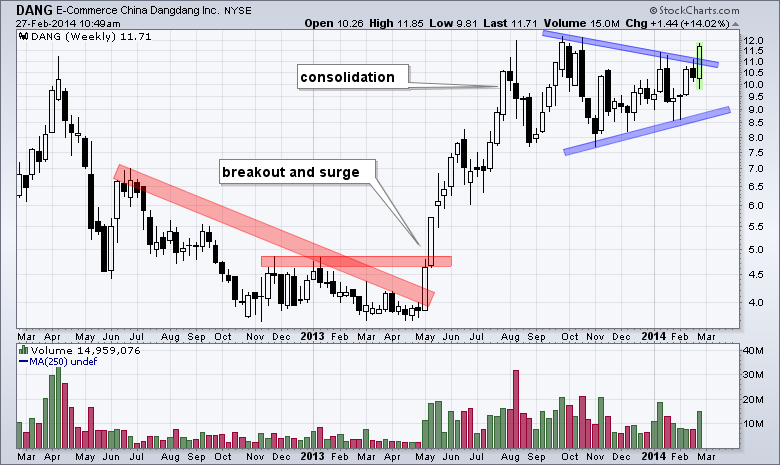
Chinese E-Commerce Stock Goes for a Breakout
by Arthur Hill,
Chief Technical Strategist, TrendInvestorPro.com
Shares of Dangdang ($DANG) are making a big move this month with a triangle breakout on expanding volume. First, notice how the stock surged from ~4 to ~12. Second, the triangle consolidation worked off overbought conditions. Third, the high volume breakout signals a continuation of this advance. Careful with this...
READ MORE
MEMBERS ONLY
Charts: AOL, FDX, JDSU, PAYX, UPS
by Arthur Hill,
Chief Technical Strategist, TrendInvestorPro.com
AOL Firms at Support.
FDX Extends Flag.
Plus JDSU, PAYX, UPS
Individual charts are below video.
Sorry but your browser doesn't support HTML5 video.
**This chart analysis is for educational purposes only, and should not
be construed as a recommendation to buy, sell or sell-short said securities**
This...
READ MORE
MEMBERS ONLY
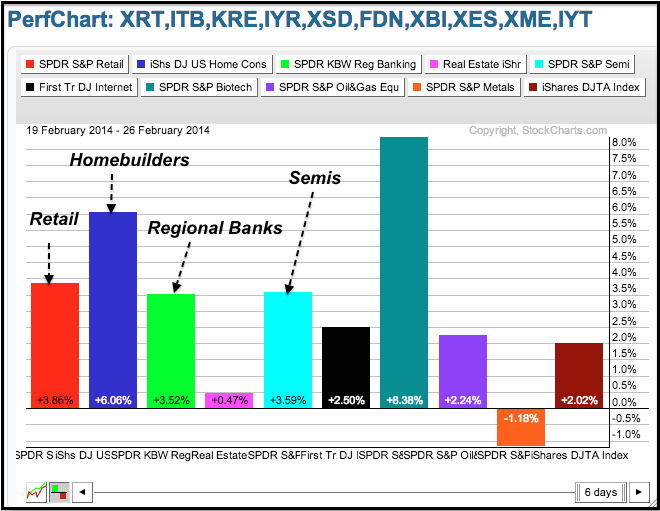
Small-caps, Homebuilders and Retailers Lead - As Do Treasuries
by Arthur Hill,
Chief Technical Strategist, TrendInvestorPro.com
Stocks continued their meandering ways with the Nasdaq 100 ETF (QQQ) edging lower and the Russell 2000 ETF (IWM) edging higher. There were, however, some significant movers that support overall market strength. IWM hit a new high and led the market (small-caps). The Retail SPDR (XRT) extended its run and...
READ MORE
MEMBERS ONLY
A Walk Through the New DecisionPoint Gallery
by Erin Swenlin,
Vice President, DecisionPoint.com
The new DecisionPoint Gallery on StockCharts.com offers you the ability to quickly assess market trends and conditions. I look at the Gallery every afternoon after the indicators have updated. DecisionPoint.com subscribers should recognize the charts on Gallery page as the same ones that are reviewed daily in the...
READ MORE
MEMBERS ONLY

Creating a DecisionPoint ChartStyle
by Erin Swenlin,
Vice President, DecisionPoint.com
For many of us who have migrated to the Stockcharts.com SharpCharts workbench, there is a major difference between the SharpCharts "default" chart style and the DecisionPoint.com ChartTool style. One of the first things I did when I opened my Stockcharts.com account was set-up my own...
READ MORE
MEMBERS ONLY

BIG JUMP IN NEW HOME SALES SENDS HOMEBUILDERS SHARPY HIGHER -- LENNAR AND TOLL BROTHERS LEAD RALLY WHILE SEVERAL OTHERS ARE AT HIGHEST LEVELS SINCE MIDYEAR -- LOWES LEADS SHARP RALLY IN HOME IMPROVEMENT RETAILERS
by John Murphy,
Chief Technical Analyst, StockCharts.com
DJ HOME CONSTRUCTION ISHARES HIT MULTI-YEAR HIGH ... A report that new home sales climbed to the highest level in more than five years has given a big boost to homebuilders and other stocks tied to housing. Chart 1 shows the Dow Jones U.S Home Construction iShares (ITB) surging more...
READ MORE
MEMBERS ONLY

Treasuries Bounce, but Stocks Remain Strong
by Arthur Hill,
Chief Technical Strategist, TrendInvestorPro.com
Stocks meandered on Tuesday with some buying interest in the morning and selling pressure in the afternoon. The major index ETFs finished mixed with the Russell 2000 ETF (IWM) edging higher (.10%) and the S&P 500 SPDR (SPY) closing fractionally lower (-.04%). The sectors were also mixed...
READ MORE
MEMBERS ONLY

20+ YR T-Bond ETF Bounces off 200-day Moving Average
by Arthur Hill,
Chief Technical Strategist, TrendInvestorPro.com
Treasuries caught a bid as the 20+ YR T-Bond ETF (TLT) surged almost 1% and the 10-YR Treasury Yield ($TNX) fell back to 2.7%. Both are above their 200-day moving averages, but TLT is bouncing off the 200-day and $TNX falling towards the 200-day. Put another way, TLT successfully...
READ MORE
MEMBERS ONLY

APPLYING THE CONFIRMATION PRINCIPLE TO $SPX AND OTHER INDICES -- DOW TRANSPORTS AND INDUSTRIALS LAG -- GOLDMAN, 3M, FEDEX AND UPS WEIGH -- SHOOTING STARS TAKE SHAPE IN SPY AND MDY -- XLY, XLI AND XLF PLAY CATCH UP TO CONFIRM
by John Murphy,
Chief Technical Analyst, StockCharts.com
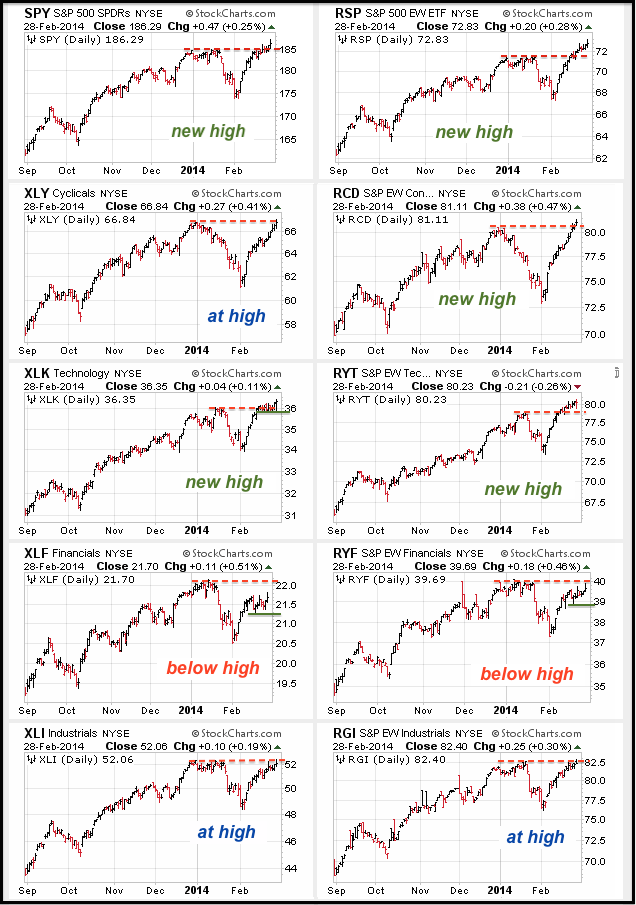
APPLYING THE CONFIRMATION PRINCIPLE TO $SPX AND OTHER INDICES ... Link for today's video. The long-term trends are clearly up for the major stock indices, but some non-confirmations could be taking shape because not all indices hit new highs. The term "non-confirmation" comes from Dow Theory. Charles...
READ MORE
MEMBERS ONLY

Small-Caps Continue to Lead - Dollar Gets a Bounce
by Arthur Hill,
Chief Technical Strategist, TrendInvestorPro.com
Stocks started strong and remained strong most of the day, but selling pressure hit in the afternoon and stocks gave up some of their gains. The Russell 2000 ETF (IWM) led the way with a .73% gain and the Nasdaq 100 ETF (QQQ) advanced .64%. Seven of the nine sectors...
READ MORE
MEMBERS ONLY
Charts: BA, BZ, CYH, DSX, MED
by Arthur Hill,
Chief Technical Strategist, TrendInvestorPro.com
BA Hits Moment of Truth.
BZH Bounces off Key Retracement.
Plus CYH, DSX, MED
Individual charts are below video.
Sorry but your browser doesn't support HTML5 video.
**This chart analysis is for educational purposes only, and should not
be construed as a recommendation to buy, sell or sell-short...
READ MORE
MEMBERS ONLY

Asset Managers, Investment Services and Banks Lead Finance Sector
by Arthur Hill,
Chief Technical Strategist, TrendInvestorPro.com
The bulls lifted the Finance SPDR (XLF) with the DJ US Asset Managers Index, the DJ US Investment Services Index ($DJUSSB) and the DJ US Bank Index ($DJUSBK) leading the charge. All three were up more than 1%. Users can click on the industry names to see the stocks in...
READ MORE
