MEMBERS ONLY

FINANCE SECTOR CATCHES A BID -- THREE KEY BANKING STOCKS BOUNCE OFF SUPPORT -- AIRLINE INDUSTRY GROUP LEADS AGAIN IN 2014 -- AIRLINES, RAILS AND TRANSPORTS LEAD INDUSTRIALS SECTOR -- MARINE TRANSPORT STOCKS OUTPERFORM -- AIRLINE INDEX NEARS 52-WEEK HIGH

by John Murphy,
Chief Technical Analyst, StockCharts.com
FINANCE SECTOR CATCHES A BID ... Link for today's video. That did not take long. I wrote about relative weakness in the Finance SPDR (XLF) and the Regional Bank SPDR (KRE) on Friday. Even though their price relatives have yet to breakout and signal a return to relative strength,...
READ MORE
MEMBERS ONLY
Small-Caps, Midcaps and Techs Lead the Way

by Arthur Hill,
Chief Technical Strategist, TrendInvestorPro.com
The major index ETFs dipped in the first half of the week and rebounded in the second half to extend their short-term uptrends. Even though these short-term uptrends look extended after sharp advances, there are no signs of weakness and the market is seeing strength in the right places. Also...
READ MORE
MEMBERS ONLY

COMMODITY PRICES ARE RISING FOR FIRST TIME IN TWO YEARS -- THAT'S GOOD FOR COUNTRIES LIKE CANADA THAT PRODUCE COMMODITIES -- BUT POTENTIALLY BAD FOR BONDS -- WHILE WEATHER IS BOOSTING SOME COMMODITIES, COPPER IS LAGGING BEHIND
by John Murphy,
Chief Technical Analyst, StockCharts.com
COMMODITY INDEX IS TURNING UP ... With the stock market running into a little resistance around its old high, and bond yields stuck in the middle of a trading range, the biggest intermarket story this past week was the 2014 climb in commodity prices. I wrote about this on Wednesday, but...
READ MORE
MEMBERS ONLY

Rydex Funds Highlight Industry Group Winners and Losers
by Arthur Hill,
Chief Technical Strategist, TrendInvestorPro.com
Stocks moved higher this week, but not all groups participated. As the Rydex industry fund MarketCarpet shows, the Financial Servives Fund (RYFIX) and the Banking Fund (RYKIX) declined and underperformed the market. On the leadership and relative strength side, the Biotech Fund (RYOIX) and the Healthcare Fund (RYHIX) show the...
READ MORE
MEMBERS ONLY

What's Where on StockCharts.com? A Quick Tour of the Site

by Erin Swenlin,
Vice President, DecisionPoint.com
Users from DecisionPoint.com or anyone new to Stockcharts.com may intially have trouble finding what they are looking for. So here is a quick tour to help you get around.
First is the "Your Account" page where you can accomplish most anything regarding your paid subscription. This...
READ MORE
MEMBERS ONLY

NEW HIGHS ABOUND AND AFFIRM BULL MARKET -- SPY CHALLENGES HIGH AS QQQ RECORDS NEW HIGH -- EQUAL-WEIGHT S&P 500 OUTPERFORMS, BUT RUSSELL 2000 LAGS -- REGIONAL BANKS WEIGH ON FINANCE SECTOR -- RETAIL REMAINS A DRAG ON THE CONSUMER DISCRETIONARY SECTOR
by John Murphy,
Chief Technical Analyst, StockCharts.com
NEW HIGHS ABOUND AND AFFIRM BULL MARKET... Link for today's video. Despite relative weakness in a few key groups, the bulk of the evidence remains bullish for the stock market. Several key ETFs and indicators recorded 52-week highs this week. Except for retail, the bearish points are mostly...
READ MORE
MEMBERS ONLY

We Investors Lose At Times: You Are Not Alone

by Gatis Roze,
Author, "Tensile Trading"
We investors are imperfect creatures living in a complex world. We are destined to stumble and fall. It’s part and parcel of the probability game that is the stock market. One day in the near future, you will find yourself here amongst “the investing losers”, just as surely as...
READ MORE
MEMBERS ONLY

Key Tech Groups Hit New Highs - Small-Caps Perk Up
by Arthur Hill,
Chief Technical Strategist, TrendInvestorPro.com
Stocks pulled back for a day and then rebounded on Thursday with small-caps leading the way. All sectors were up, but the gains in three of the four offensive sectors were relatively muted. XLI led with a .94% gain, while XLK gained just .33%, XLY advanced .54% and XLF added...
READ MORE
MEMBERS ONLY

The Squeeze is on for Emcore Group $EMKR
by Arthur Hill,
Chief Technical Strategist, TrendInvestorPro.com
The Bollinger Bands are narrowing for Emcore (EMKR) as the stock moves into a tight consolidation. The indicator window confirms as BandWidth dipped to its lowest level in over six months. This volatility contraction could give way to a volatility expansion. A move above 5.05 would trigger an upside...
READ MORE
MEMBERS ONLY

THE INDEXES HAVE A WEAK DAY WHILE TESTING NEW HIGHS -- CHECKING FOR A SHORT TERM TOP ON THE INDEXES -- $SPXA50R COULD BE POINTING TO A SHORT TERM TOP -- $SPXA200R POINTS TO A MORE SIGNIFICANT CORRECTION -- XLF WORKING TO STAY ABOVE THE 50 DMA
by John Murphy,
Chief Technical Analyst, StockCharts.com
THE INDEXES HAVE A WEAK DAY WHILE TESTING NEW HIGHS - ... Chart 1 shows a tight 4 day view of the indexes in a 30 minute time frame. The $SPX tried to take out the yearend high close of 1848.38 on Wednesday. It could not quite make it back...
READ MORE
MEMBERS ONLY

Stocks, Gold and Bonds Decline after Fed Minutes
by Arthur Hill,
Chief Technical Strategist, TrendInvestorPro.com
Stocks started the week in strong uptrends, but were overbought after big moves in the first half of February. The release of the FOMC Minutes provided the trigger for some profit taking as stocks turned south in the afternoon. The declines, however, were relatively modest with the Nasdaq 100 ETF...
READ MORE
MEMBERS ONLY
Charts: AMZN, BTU, FDX, FIO, ITUB
by Arthur Hill,
Chief Technical Strategist, TrendInvestorPro.com
AMZN Underperforms with Pennant.
BTU Bounces with Good Volume.
Plus FDX, FIO, ITUB
Individual charts are below video.
Sorry but your browser doesn't support HTML5 video.
**This chart analysis is for educational purposes only, and should not
be construed as a recommendation to buy, sell or sell-short said...
READ MORE
MEMBERS ONLY

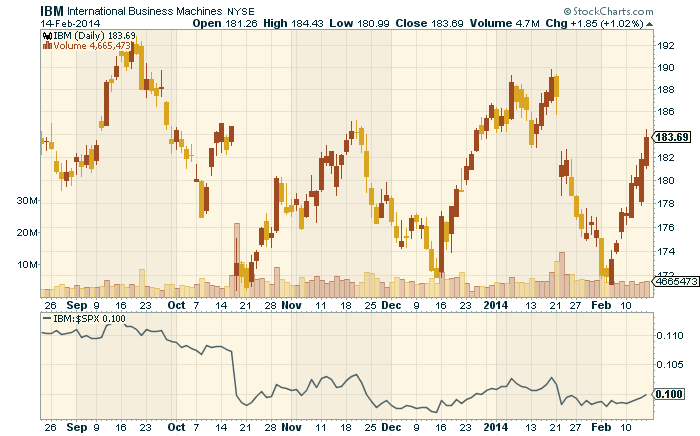
Intel Bounces on Low Volume and Underperforms
by Arthur Hill,
Chief Technical Strategist, TrendInvestorPro.com
The stock market surged over the last few weeks with the Nasdaq 100 leading the way. Intel also moved higher, but lagged as the price relative (INTC:$SPX ratio) hit a new low for the year this week. Also notice that the bounce occurred on very low volume and Intel...
READ MORE
MEMBERS ONLY

WEAKER DOLLAR AND WEATHER GIVE COMMODITIES A BOOST -- NATURAL GAS AND COFFEE ARE BIGGEST GAINERS -- BUT UPTURNS ALSO SEEN IN ECONOMICALLY-SENSITIVE COPPER, OIL, AND SILVER -- BASIC MATERIAL AND ENERGY STOCKS ARE ALSO STRONG
by John Murphy,
Chief Technical Analyst, StockCharts.com
COMMODITIES TRACKING FUND CLEARS 200-DAY AVERAGE... After lying dormant for the last year, commodity prices are finally showing some life. Chart 1 shows the DB Commodities Tracking Fund (DBC) surging to the highest level in four months and clearing its 200-day moving average. [The DBC includes 14 actively traded commodities]...
READ MORE
MEMBERS ONLY

AD Line Hits New High as Small-Caps Perk Up
by Arthur Hill,
Chief Technical Strategist, TrendInvestorPro.com
Directional changes seem to be more important than magnitude indicators these days. It is not the first time, nor will it be the last. The advance over the last two weeks started with a seemingly meek reversal. Volume was low and breadth was not that impressive when the stock market...
READ MORE
MEMBERS ONLY

Google, Apple and Microsoft Power QQQ in February (video)
by Arthur Hill,
Chief Technical Strategist, TrendInvestorPro.com
The CandleGlance charts show the Nasdaq 100 ETF (QQQ) and its top five components (the video shows the top ten components). It is easy to see why QQQ is so strong. Google hit a new high above 1200 today, Apple is up 10% from its January low and Microsoft hit...
READ MORE
MEMBERS ONLY

HEALTHCARE PROVIDERS INDEX SPRINGS INTO ACTION -- AETNA, HUMANA AND UNITEDHEALTH LEAD HMO REBOUND -- ITB SHOWS UPSIDE LEADERSHIP AHEAD OF KEY DATA -- SILVER GETS A BREAKOUT AND RESISTANCE TARGET -- BASE METALS FAIL TO FOLLOW PRECIOUS METALS
by John Murphy,
Chief Technical Analyst, StockCharts.com
HEALTHCARE PROVIDERS INDEX SPRINGS INTO ACTION... Link for today's video. The HealthCare SPDR is the strongest of the nine sectors in the stock market right now. Despite being in the strongest sector, healthcare providers lagged the market and underperformed this year. This may be changing as the DJ...
READ MORE
MEMBERS ONLY

QQQ Hits New High Even as TLT Bounces
by Arthur Hill,
Chief Technical Strategist, TrendInvestorPro.com
Stocks begin a four-day week in strong short-term uptrends that are quite extended. In just two weeks, SPY is up over 5.66%, QQQ is up 6.55% and IWM is up around 5%. Even though stocks are ripe for a short-term pullback or consolidation, the medium-term trends are up...
READ MORE
MEMBERS ONLY
Charts: APOL, BAC GES, MDR, RRD
by Arthur Hill,
Chief Technical Strategist, TrendInvestorPro.com
APOL Stalls after High Volume Decline.
BAC Holds Flag Break.
Plus GES, MDR, RRD
Individual charts are below video.
Sorry but your browser doesn't support HTML5 video.
**This chart analysis is for educational purposes only, and should not
be construed as a recommendation to buy, sell or sell-short...
READ MORE
MEMBERS ONLY
An Introduction to SharpCharts for DecisionPoint.com Users

by Carl Swenlin,
President and Founder, DecisionPoint.com
The StockCharts charting tools are very powerful but can be a little confusing at first, especially if you are used to the simpler charting tool on DecisionPoint.com. So I wanted to take time today and talk a little bit about the differences between those two tools.
First off, I&...
READ MORE
MEMBERS ONLY
DecisionPoint Market Analysis Chart Gallery Now on StockCharts.com
Hello Fellow ChartWatchers!
Just in time for the ongoing February rally, I'm thrilled to announce the launch of the DecisionPoint Market Analysis Chart Gallery!
As you probably know, we have recently acquired DecisionPoint.com and are currently in the process of merging their terrific charting tools and datasets...
READ MORE
MEMBERS ONLY
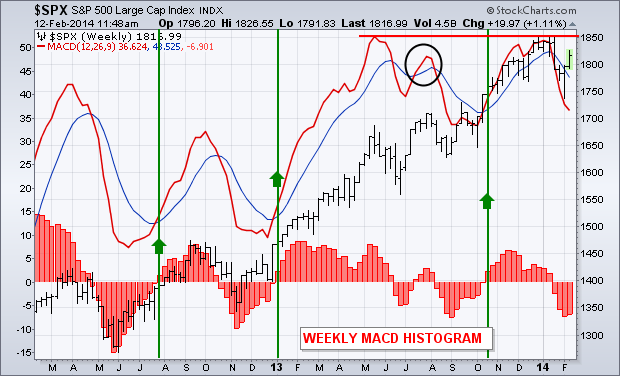
WEEKLY MACD LINES ARE STILL NEGATIVE
by John Murphy,
Chief Technical Analyst, StockCharts.com
The daily MACD for QQQ, SPY and DIA have turned positive. Weekly MACD lines, however, are still negative. That's not unusual since weekly lines are slower to turn. Weekly lines, however, measure the stock market's longer trend. A strong stock market rally requires the weekly lines...
READ MORE
MEMBERS ONLY
Mixed Signals Abound

by Tom Bowley,
Chief Market Strategist, EarningsBeats.com
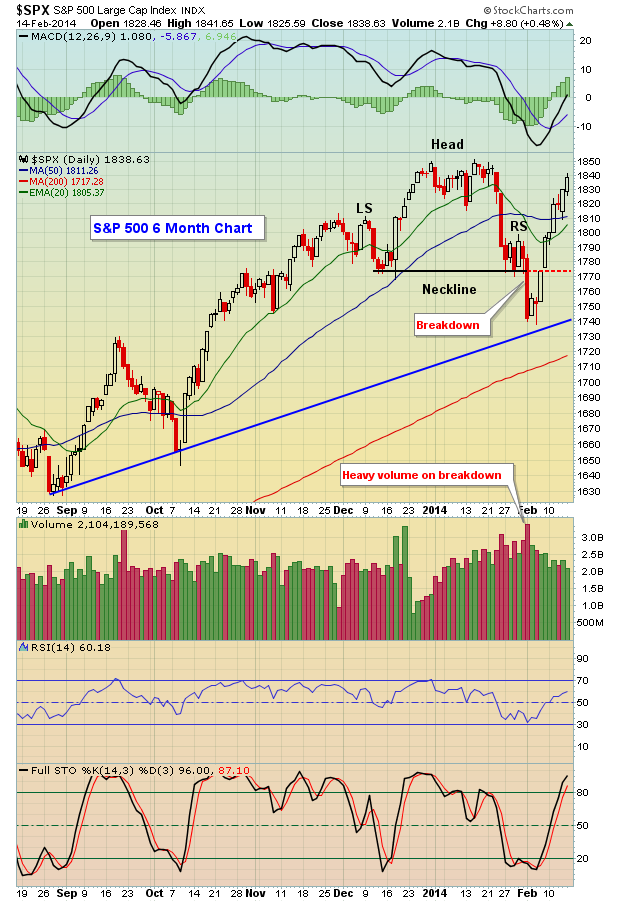
Just two weeks ago, the stock market seemed on the verge of its first correction in a long time - all within the confines of a long-term bull market that began in March 2009. Then came the breakdown I was looking for to confirm it. Check out the head &...
READ MORE
MEMBERS ONLY
Taking Your Charts To A New Level - SharpCharts vs. The DP ChartTool
by Erin Swenlin,
Vice President, DecisionPoint.com
OK DecisionPoint users, are you ready for the power that is SharpCharts? I think you are! In the past, I was often asked by DecisionPoint subscribers, "Can I save my charts to a list?" and "How do I annotate my charts?", etc. I used to have...
READ MORE
MEMBERS ONLY
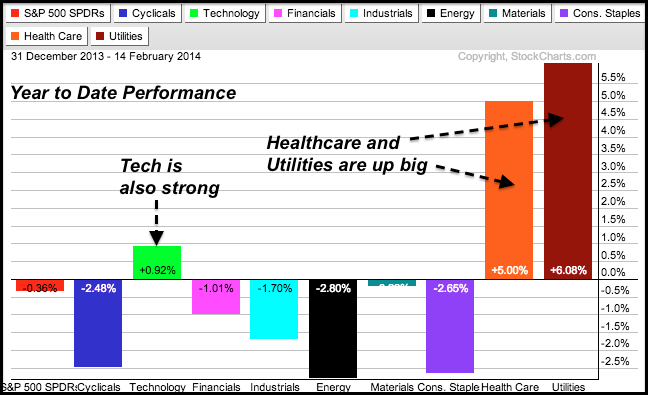
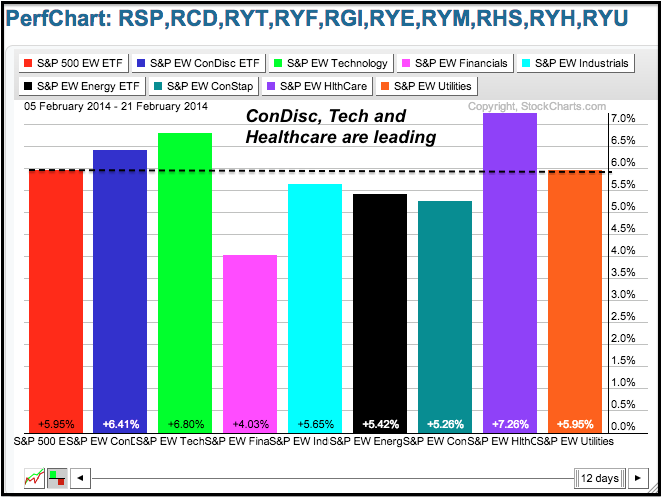
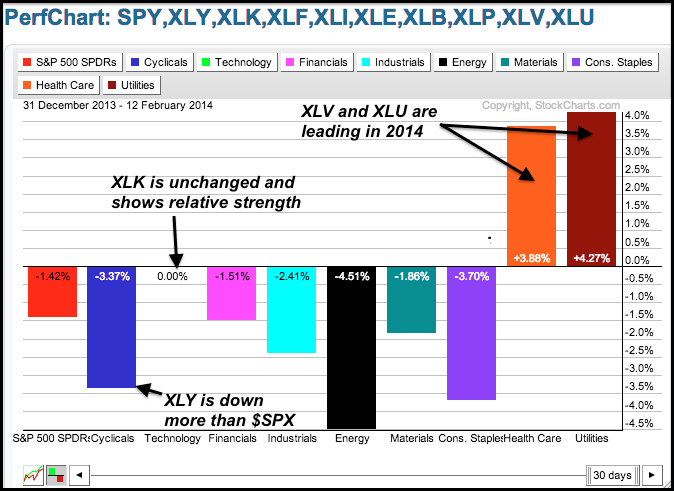
The S&P 500 is Flat this Year, but Three Sectors Rise Above
by Arthur Hill,
Chief Technical Strategist, TrendInvestorPro.com
Chartists can find sectors with consistent performance by analyzing PerfCharts across different timeframes. The three PerfCharts show different performance periods for the S&P 500 and the nine sector SPDRs. I am looking at year-to-date performance and then dividing 2014 into two parts. The first part covers the period...
READ MORE
MEMBERS ONLY

SCTRs Surge for HMO Stocks
by Arthur Hill,
Chief Technical Strategist, TrendInvestorPro.com
The StockCharts Technical Rank (SCTR) shows relative performance for the S&P 500 stocks, S&P SmallCap 600 and S&P MidCap 400. Stocks with the highest values show the most relative strength. The screenshot below shows the S&P 500 stocks with the biggest positive...
READ MORE
MEMBERS ONLY

TECH LEADERSHIP IS BULLISH OVERALL -- SPY APPROACHES NEW HIGH AS QQQ HITS NEW HIGH -- TWO STOCKS MAKING MOVES WITH BIG VOLUME -- AD AND AD VOLUME LINES NEAR NEW HIGHS -- NET NEW HIGHS SURGE ABOVE +2% -- RETAIL SPDR LAGS LIKE IT'S 2007
by John Murphy,
Chief Technical Analyst, StockCharts.com
TECH LEADERSHIP IS BULLISH OVERALL... Link for today's video. After a strong finish to 2013, stocks started the year flat and then fell sharply in the second half of January. Selling pressure continued on the first day of February, but stocks soon firmed and mounted a pretty strong...
READ MORE
MEMBERS ONLY

Monitoring Your Investments is a Sisyphean Task
by Gatis Roze,
Author, "Tensile Trading"
When Google’s co-founder, Larry Page, famously asked Steve Jobs for advice, Job’s reply was “Don’t get distracted. Focus.” From what I’ve seen with hundreds of investors, this is possibly the number one reason institutional investment managers outperform individual investors. The power of disciplined focus cannot be...
READ MORE
MEMBERS ONLY

QQQ Hits New High - Dollar Breaks Down
by Arthur Hill,
Chief Technical Strategist, TrendInvestorPro.com
Stocks opened weak after a decline in retail sales, but soon caught a bid and closed strong. Buying pressure in the face of negative news is positive for the stock market. Also note that stocks advanced even as the 20+ YR T-Bond ETF (TLT) moved higher. These two have been...
READ MORE
MEMBERS ONLY

Utilities are Leading the Market in 2014
by Arthur Hill,
Chief Technical Strategist, TrendInvestorPro.com
The screen shot below comes from a ChartList viewed in "summary" format using a one month price change. Overall, the market is quite mixed with five of the sector SPDRs down over the past month and only four up. The Utilities SPDR (XLU) and the Utilities Equal-Weight ETF...
READ MORE
MEMBERS ONLY

THE BOND AND EQUITY MARKETS HIT KEY FIB LEVELS -- THE NASDAQ COMPOSITE MAINTAINS ITS CHANNEL -- THE MARKET SECTOR LEADERSHIP IS CHANGING -- THE SCTR RANKINGS SHOW MARKET LEADERSHIP CHANGES AS WELL MFL -- CHW RNP NKX JPI PUSH TO BECOME TOP QUARTILE
by John Murphy,
Chief Technical Analyst, StockCharts.com
THE BOND AND EQUITY MARKETS HIT KEY FIB LEVELS... After the market has worked to get back above most of our common retracement levels, it hovers in one crucial spot today. I have opened the chart John posted yesterday and added Fibonacci retracements. In Chart 1 the bonds have retraced...
READ MORE
MEMBERS ONLY
XLY Underperforms - IWM Hits Potential Reversal Zone
by Arthur Hill,
Chief Technical Strategist, TrendInvestorPro.com
Stocks turned a bit mixed on Wednesday. The Dow Diamonds (DIA) edged lower, while the Russell 2000 ETF (IWM) edged higher. The price movements in the sector SPDRs were quite small. Tech stocks were strong again as the Semiconductor SPDR (XSD) surged 1.77% to lead the way and record...
READ MORE
MEMBERS ONLY
Charts: ARUN, ASEI, BOOM, EMKR, FNSR, JBHT, MS, S
by Arthur Hill,
Chief Technical Strategist, TrendInvestorPro.com
ARUN Tests the Breakout Zone.
ASEI Forms Wedge near Key Retracement.
Plus BOOM, EMKR, FNSR, JBHT, MS, S
Individual charts are below video.
Sorry but your browser doesn't support HTML5 video.
**This chart analysis is for educational purposes only, and should not
be construed as a recommendation to...
READ MORE
MEMBERS ONLY

Accessing DecisionPoint Indicators Now
by Erin Swenlin,
Vice President, DecisionPoint.com
Since the news of the DecisionPoint.com/StockCharts.com merger, a common question coming into our Support area is, "How do I access DecisionPoint indicators?". In addition, DecisionPoint subscribers want to know how to recreate their favorite DecisionPoint indicators on the SharpCharts workbench.
Let's look at...
READ MORE
MEMBERS ONLY
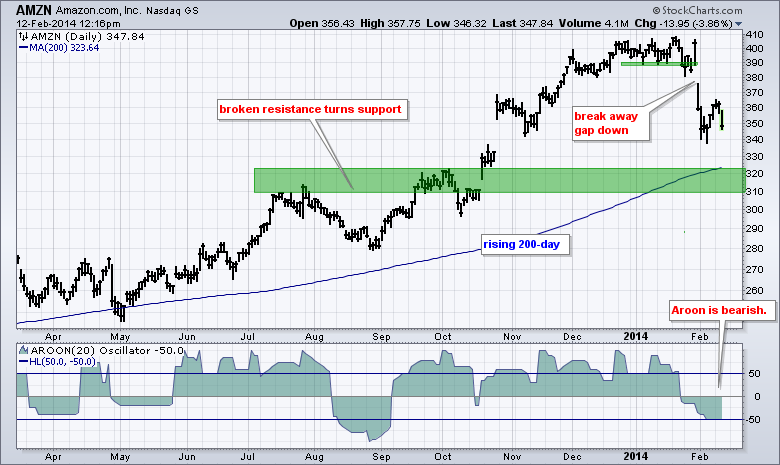
Amazon Starts Acting like a Retail Stock (video)
by Arthur Hill,
Chief Technical Strategist, TrendInvestorPro.com
Amazon (AMZN), the biggest internet retailer in the world, was immune to weakness in the retail group for most of January, but finally broke down with a break away gap. After an oversold bounce above 360, the stock is continuing lower today with a move below 350. The rising 200-day...
READ MORE
MEMBERS ONLY

BOUNCE IN BOND YIELD SUPPORTS STOCK REBOUND -- BOLLINGER BANDS TURN POSITIVE AND S&P 500 CLEARS 50-DAY LINE -- BUT DECLINING VOLUME HASN'T CONFIRMED PRICE RISE -- WEEKLY MACD LINES REMAIN NEGATIVE
by John Murphy,
Chief Technical Analyst, StockCharts.com
RISING BOND YIELDS SUPPORT STOCK REBOUND... Last Wednesday's message showed how action in the bond market offered clues to stock market direction. It showed the 10-Year Treasury Note Yield ($TNX) bouncing off its 200-day average (and staying above chart support at its October low). The message suggested that...
READ MORE
MEMBERS ONLY

QQQ Challenges Jan High - UUP Tests Support
by Arthur Hill,
Chief Technical Strategist, TrendInvestorPro.com
Stocks extended the rally with the major index ETFs gaining around 1%. The rally seemed big because the Dow gained almost 200 points, but it was actually modest in percentage terms. DIA did lead the way with a 1.27% advance. The Russell 2000 ETF (IWM) lagged again with a...
READ MORE
MEMBERS ONLY

View RSI on Steroids in the Market Carpet
by Arthur Hill,
Chief Technical Strategist, TrendInvestorPro.com
Looking for the big momentum movers? Check out the MarketCarpet using StochRSI in change mode. StochRSI is the Stochastic Oscillator applied to RSI, which makes it RSI on steroids. Clicking the change icon at the top shows the big movers. Today, we are seeing NE, CNX and GS with upside...
READ MORE
MEMBERS ONLY

NASDAQ 100 EQUAL-WEIGHT ETF HITS NEW HIGH -- FOUR STOCKS SHOWING RELATIVE STRENGTH IN THE ENERGY SECTOR -- BIG DATA STOCKS MAKING BIG MOVES -- SEAGATE HITS KEY LEVEL AS WESTERN DIGITAL PULLS BACK
by John Murphy,
Chief Technical Analyst, StockCharts.com
NASDAQ 100 EQUAL-WEIGHT ETF HITS NEW HIGH... Link for today's video. Technology remains one of the strongest groups in the stock market. We can see this because the Nasdaq 100 Equal-Weight ETF (QQEW) is already above its January high. Not many index or group ETFs are trading at...
READ MORE
MEMBERS ONLY

TLT and UUP Test Support as GLD Surges
by Arthur Hill,
Chief Technical Strategist, TrendInvestorPro.com
Stocks extended their bounce with small gains in the major index ETFs on Monday. The Nasdaq 100 ETF (QQQ) led the way with a .57% gain and the S&P 500 SPDR (SPY) gained .18% on the day. The sectors were mixed with the Consumer Discretionary SPDR (XLY), Industrials...
READ MORE
