MEMBERS ONLY
Charts: COST, FDX, GERN, GS, JBL, X

by Arthur Hill,
Chief Technical Strategist, TrendInvestorPro.com
COST Holds the Gap
FDX Breaks a Flag Line.
Pus GERN, GS, JBL, X
Individual charts are below video.
Sorry but your browser doesn't support HTML5 video.
**This chart analysis is for educational purposes only, and should not
be construed as a recommendation to buy, sell or sell-short...
READ MORE
MEMBERS ONLY

Altera Leads with New High for 2014
by Arthur Hill,
Chief Technical Strategist, TrendInvestorPro.com
Altera, which is part of the semiconductor group, is showing relative strength this year with a price breakout and new high for the year (2014). The stock established support from mid November to mid January and broke out with a gap in January. After some backing and filling, the stock...
READ MORE
MEMBERS ONLY

HEALTHCARE SPDR BOUNCES OFF TREND LINE ZONE -- PFIZER, GILEAD AND ABBVIE LOOK TO EXTEND UPTRENDS -- SHANGHAI COMPOSITE BOUNCES OFF LONG-TERM SUPPORT -- GOLD SPDR CHALLENGES UPPER BOLLINGER BAND -- SILVER CONSOLIDATES WITHIN DOWNTREND

by John Murphy,
Chief Technical Analyst, StockCharts.com
HEALTHCARE SPDR BOUNCES OFF TREND LINE ZONE... Link for today's video. The HealthCare SPDR (XLV) has been one of the strongest sectors in the stock market this year, and shows no signs of letting up. Chart 1 shows the XLV hitting a new high in mid January, pulling...
READ MORE
MEMBERS ONLY
SPY Surges to Key Retracement - GLD Breaks Triangle
by Arthur Hill,
Chief Technical Strategist, TrendInvestorPro.com
Stocks rebounded at the end of the week with the S&P 500 SPDR (SPY) and Nasdaq 100 ETF (QQQ) posting modest gains (+.84% and +1.19%). The Russell 2000 ETF (IWM) and the Russell MicroCap iShares (IWC), however, posted weekly losses of 1.26% and 1.91%, respectively....
READ MORE
MEMBERS ONLY
A Mini-ChartWatchers Newsletter (includes a free Murphy eBook)
Hello Fellow ChartWatchers!
I've got just a short, mini-version of our newsletter for you this week with some important information on a couple of topics:
1. John Murphy's latest market outlook
2. A new, free(!) online book from John Murphy
3. ChartCon 2014 - our upcoming...
READ MORE
MEMBERS ONLY

The Road to DecisionPoint on StockCharts.com

by Erin Swenlin,
Vice President, DecisionPoint.com
Hello again everyone!
Since the announcement of the DecisionPoint/StockCharts merger, I have had numerous questions and concerns from DP members about when and how DP features and charts will be transitioned to the StockCharts.com platform.
First and foremost, please remember that DP features will be added to StockCharts...
READ MORE
MEMBERS ONLY

MARKET BOUNCES OFF 200-DAY AVERAGE, BUT ON LOWER VOLUME -- INDEXES WILL NOW HAVE TO CLEAR 50-DAY LINES TO SIGNAL END OF CORRECTION -- EAFE ISHARES ALSO BOUNCES OFF 200-DAY AVERAGE WHILE EMERGING MARKETS REBOUND FROM IMPORTANT SUPPORT LEVELS
by John Murphy,
Chief Technical Analyst, StockCharts.com
200-DAY AVERAGES HOLD... Despite a weak jobs report on Friday, stocks had an impressive price rebound on Thursday and Friday. That was partially due to a short-term oversold condition. Chart 1 shows the 14-day RSI line for the Dow Industrials bouncing from oversold territory near 30 (although its daily MACD...
READ MORE
MEMBERS ONLY

SPY GETS OVERSOLD BOUNCE -- SMALL-CAPS LAG ON OVERSOLD BOUNCE -- BREADTH SHOWS MATERIAL SELLING PRESSURE -- NET NEW HIGHS DO THE DOUBLE DIP -- ECONOMIC INDICATORS TURN MIXED -- MANUFACTURING WEAKENS, BUT SERVICES REMAIN STRONG -- AUTO SALES STALL
by John Murphy,
Chief Technical Analyst, StockCharts.com
SPY GETS OVERSOLD BOUNCE... Link for today's video. Stocks started the week under selling pressure as the S&P 500 SPDR (SPY) plunged below 175 on Monday to create a short-term oversold condition. Chart 1 shows the ETF with a support zone marked by the November low,...
READ MORE
MEMBERS ONLY

Bullish Candlesticks Line up for a Reversal in XRT
by Arthur Hill,
Chief Technical Strategist, TrendInvestorPro.com
After a plunge below 78 to start the week, the Retail SPDR (XRT) firmed with a harami on Monday-Tuesday and then formed a hammer on Wednesday. These are bullish candlestick reversal patterns that require confirmation, which came with a gap and surge to 80. Even though the short-term reversal is...
READ MORE
MEMBERS ONLY

Super Bowl Lessons for Investors

by Gatis Roze,
Author, "Tensile Trading"
“We envisioned this from day one. We prepared for this.
We expected this. We deserve this.”
—Pete Carroll, Coach of the Seattle Seahawks
2014 Super Bowl Champions
Pete Carroll’s statement may sound cocky, but it’s preceded by a great deal of preparation and hard work. The cocky mentality...
READ MORE
MEMBERS ONLY
Stocks Surge, but Breadth Falls Short as Small Caps Lag
by Arthur Hill,
Chief Technical Strategist, TrendInvestorPro.com
Stocks got their oversold bounce with a decent advance, but small-caps lagged and breadth could have been stronger. SPY fell sharply on Monday and was down over 5% year-to-date at the time. The ETF firmed for two days and then bounced with its biggest 1-day advance of the year, which...
READ MORE
MEMBERS ONLY

Palo Alto Networks Resumes Uptrend with High Volume Signal
by Arthur Hill,
Chief Technical Strategist, TrendInvestorPro.com
Network security company Palo Alto Networks is resuming its uptrend with a flag breakout on twice its average volume. PANW surged to a new high earlier this year and pulled back with a flag the last few weeks. Notice that broken resistance turned into support in the 58 area. The...
READ MORE
MEMBERS ONLY

EURO STROKES A REVERSAL CANDLE BOND YIELDS MOVE HIGHER $WTIC TESTS THE 200 DMA UNG BREAKS THE UP TREND -- CAT RISES WHILE THE MARKET FALLS -- THE SCTR ON CAT HITS A SWEET SPOT A QUICK VIEW OF MAJOR MINING COMPANIES
by John Murphy,
Chief Technical Analyst, StockCharts.com
EURO STROKES A REVERSAL CANDLE ... The Euro has a slow negative slope to it as shown in Chart 1. We can also see the recent trend line break has been cancelled by the move today. The Euro now resides above the trend line, but below the down sloping 50 DMA....
READ MORE
MEMBERS ONLY

SPY Forms Extended Harami - UUP and GLD Hold Uptrends
by Arthur Hill,
Chief Technical Strategist, TrendInvestorPro.com
Stocks remained under pressure with the Russell 2000 ETF (IWM) falling .75% and the S&P 500 SPDR (SPY) losing .12%. Selling pressure, however, was contained as the Dow Diamonds (DIA) ended the day with a small gain. The sectors were mixed with the Energy SPDR (XLE) falling .98%...
READ MORE
MEMBERS ONLY
Three Stocks with a Selling Climax - Plus Three Firming at Support $ARG $TWX
by Arthur Hill,
Chief Technical Strategist, TrendInvestorPro.com
Three Stocks with a Selling Climax
Plus Three Firming at Support
Individual charts are below video.
Sorry but your browser doesn't support HTML5 video.
**This chart analysis is for educational purposes only, and should not
be construed as a recommendation to buy, sell or sell-short said securities**
This...
READ MORE
MEMBERS ONLY

WATCHING BOND YIELD AND PRICE FOR CLUES TO STOCK MARKET DIRECTION -- APPLYING BOLLINGER BANDS TO THE S&P 500 -- EMERGING MARKET CURRENCIES AND STOCKS ARE TESTING CRITICAL CHART SUPPORTS -- VIX INDEX IS TESTING RESISTANCE ALONG 2013 HIGHS
by John Murphy,
Chief Technical Analyst, StockCharts.com
BOND YIELD TEST NEARS CHART SUPPORT ... The downturn on bond yields at the start of the year forewarned of a pullback in stocks. Both have fallen together as some money left stocks for the relative safety of Treasury bonds. Chart 1, however, shows the 10-Year Treasury Note Yield ($TNX) very...
READ MORE
MEMBERS ONLY
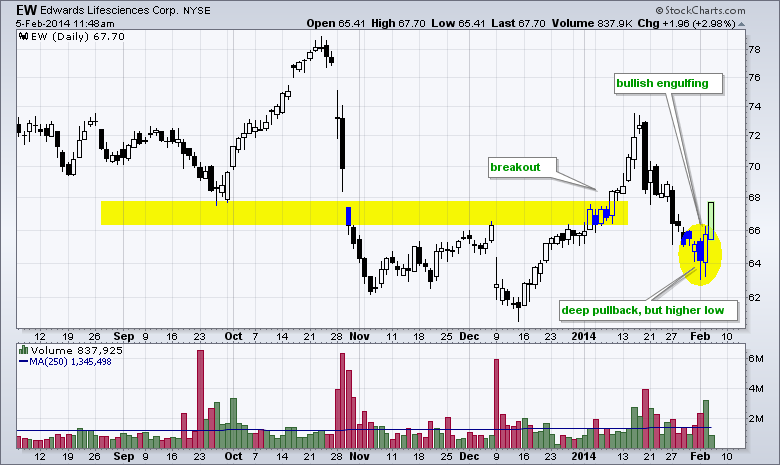
Edwards Follows through on Candlestick Reversal Pattern
by Arthur Hill,
Chief Technical Strategist, TrendInvestorPro.com
Edwards Life Sciences (EW) has been underperforming the biotech group for over a year, but the stock showed signs of buying interest with a bullish engulfing on high volume and follow through surge on Wednesday. Also note that support in the 65 area extends back to May and the stock...
READ MORE
MEMBERS ONLY
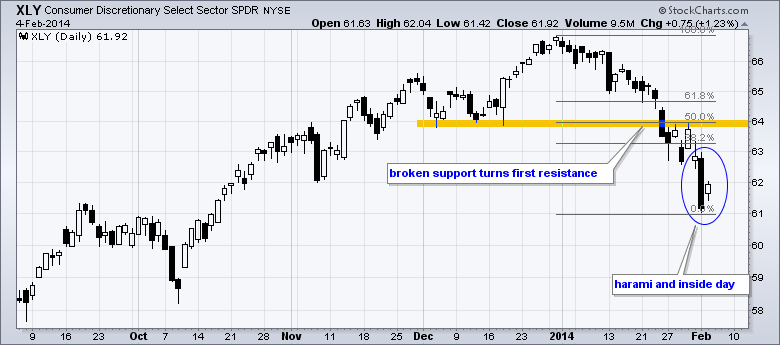
Oversold Bounces Produce Harami in Several Sector SPDRs
by Arthur Hill,
Chief Technical Strategist, TrendInvestorPro.com
Stocks got a small bounce on Tuesday with mid-caps leading the way higher. All sectors were higher with the Consumer Discretionary SPDR (XLY), Finance SPDR (XLF) and Energy SPDR (XLE) gaining over 1%. All three were beaten down pretty good and were ripe for some sort of bounce. With a...
READ MORE
MEMBERS ONLY

Sector MarketCarpet in RSI Mode Reveals Most Oversold Stocks
by Arthur Hill,
Chief Technical Strategist, TrendInvestorPro.com
Stocks took a beating over the last few weeks, and some more than others. The Sector MarketCarpet below reflects the absolute value for RSI on February 3rd. Stocks with low RSI values have dark red squares, while stocks with relatively high values have green squares. Most of the green can...
READ MORE
MEMBERS ONLY

DOWN TURN IN YIELD CURVE WEIGHS ON BANKS -- REGIONAL BANK SPDR BREAKS LONG-TERM TREND LINE -- NATURAL GAS STOCKS SHOW RELATIVE STRENGTH -- SECTOR PERFCHARTS REVEAL A POTENTIAL 2014 LEADER -- TECHNOLOGY SPDR HITS FIRST SUPPORT ZONE
by John Murphy,
Chief Technical Analyst, StockCharts.com
DOWN TURN IN YIELD CURVE WEIGHS BANKS... Link for today's video. Regional banks got hit hard over the last few weeks as the yield curve turned down this year. The yield curve affects banking profits because banks make money by borrowing short, lending long and capturing the spread....
READ MORE
MEMBERS ONLY
Four Small Caps and One Mega Cap Buck the Selling Pressure
by Arthur Hill,
Chief Technical Strategist, TrendInvestorPro.com
Sorry but your browser doesn't support HTML5 video.
**This chart analysis is for educational purposes only, and should not
be construed as a recommendation to buy, sell or sell-short said securities**
This commentary and charts-of-interest are designed to stimulate thinking. This analysis is
not a recommendation to buy,...
READ MORE
MEMBERS ONLY

Small-Caps Lead Lower - Breadth Indicator Prepares for Double Dip
by Arthur Hill,
Chief Technical Strategist, TrendInvestorPro.com
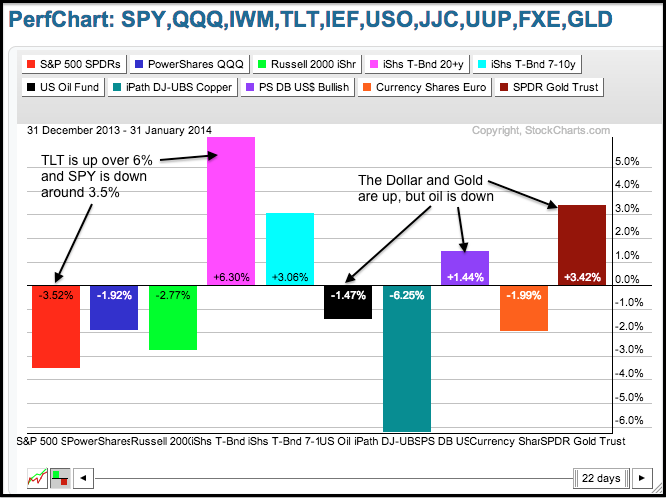
Stocks got slammed as the perfect storm just got more perfect. The list of negatives continues to grow. Starting internally, stocks were ripe for a correction in mid January and the Consumer Discretionary SPDR (XLY) has underperformed the entire year. Externally, the 20+ YR T-Bond ETF (TLT) has outperformed the...
READ MORE
MEMBERS ONLY

LinkedIn Tests Key Moving Average with Bullish Candlestick Pattern
by Arthur Hill,
Chief Technical Strategist, TrendInvestorPro.com
It has been a rough few months for LinkedIn as the stock fell from the 255 area in September to the 200 area in early December. The stock, however, is finding some support near the rising 200-day moving average with a big bullish engulfing. After a pullback in mid January,...
READ MORE
MEMBERS ONLY

SPY BREAKS KEY SUPPORT LEVEL -- MDY AND XLF TRIGGER CONTINUATION SIGNALS -- XLY EXTENDS DECLINE AND RELATIVE WEAKNESS -- AUTOS AND RETAILERS WEIGH -- NIKKEI 225 CORRECTS TO FIRST SUPPORT ZONE -- EURO BREAKS KEY LEVEL AS MOMENTUM REMAINS BEARISH
by John Murphy,
Chief Technical Analyst, StockCharts.com
SPY BREAKS KEY SUPPORT LEVEL ... Link for today's video. After a big decline in mid January, stocks consolidated last week with flags and pennants forming in several ETFs. Flags and pennants are short-term continuation patterns that form after a sharp move. Chart 1 shows the S&P...
READ MORE
MEMBERS ONLY

Merging DecisionPoint with StockCharts.com
Hello Fellow ChartWatchers!
And that includes a special "Hello!" to all DecisionPoint.com members that have just joined us. Yes, in case you haven't heard, StockCharts.com has acquired DecisionPoint.com and we are now working hard to incorporate all of great features that DecisionPoint has...
READ MORE
MEMBERS ONLY
SPY Gaps and Goes Nowhere - TLT Extends Uptrend
by Arthur Hill,
Chief Technical Strategist, TrendInvestorPro.com
After a big decline two weeks ago, stocks moved into a choppy consolidation last week. SPY produced three gaps two weeks ago and another three gaps last week. SPY gapped down from resistance on 23-Jan and gapped down again on 24-Jan en route to a sharp two-day decline. This decline...
READ MORE
MEMBERS ONLY
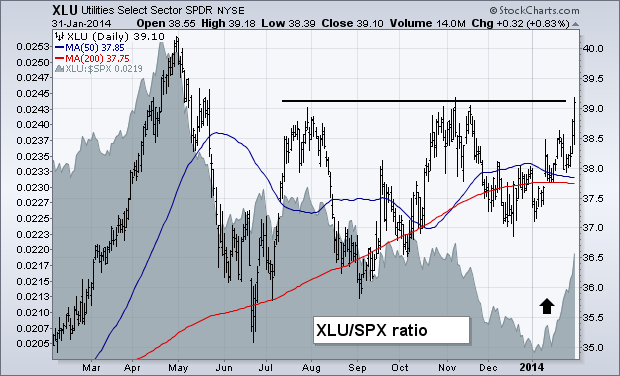
Utilities and Reits Show Relative Strength
by John Murphy,
Chief Technical Analyst, StockCharts.com
An early January message (January 11) talked about the need to do some rotating out of over-extended stock market groups that did especially well during 2013 into more defensive (and dividend-paying) groups that had been market laggards. The two I mentioned were utilities and REITs. I mentioned those two groups...
READ MORE
MEMBERS ONLY
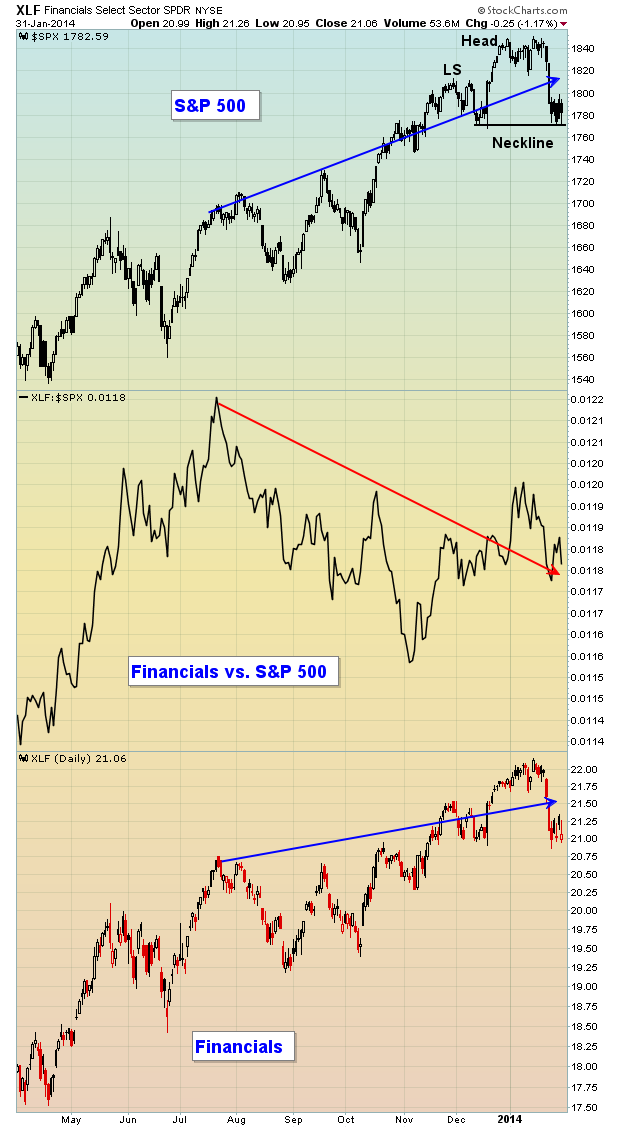
Financials and Treasury Yields Offering Bears Some Motivation

by Tom Bowley,
Chief Market Strategist, EarningsBeats.com
Signs of a sustainable bull market rally include strong relative performance from financial stocks, especially banks, and rising treasury yields that result from rotation away from treasuries. Both of these areas of the market are flashing warning signs right now, although technical breakdowns to confirm the weakness have not yet...
READ MORE
MEMBERS ONLY

VOLUME PATTERN SUGGESTS DEEPER CORRECTION FOR STOCKS -- JANUARY BAROMETER IS A NEGATIVE SIGN FOR STOCKS DURING 2014 -- SO IS THE FACT THAT THIS IS A MIDTERM ELECTION YEAR -- UTILITIES, REITS AND HOMEBUILDERS FOLLOW BOND PRICES HIGHER
by John Murphy,
Chief Technical Analyst, StockCharts.com
HEAVY DOWNSIDE VOLUME ISN'T A GOOD SIGN... The stock market ended the week as it began -- on the downside. Two low-volume bounces on Tuesday and Thursday were followed by higher volume declines on Wednesday and Friday. Charts 1 and 2 show the Dow Industrials and S&...
READ MORE
MEMBERS ONLY
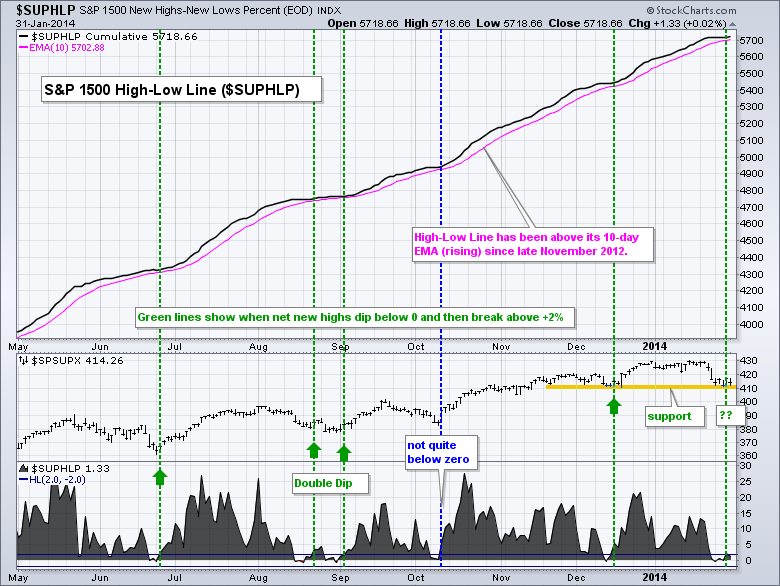
High-Low Percent Indicator Dips to a Reversal Zone
by Arthur Hill,
Chief Technical Strategist, TrendInvestorPro.com
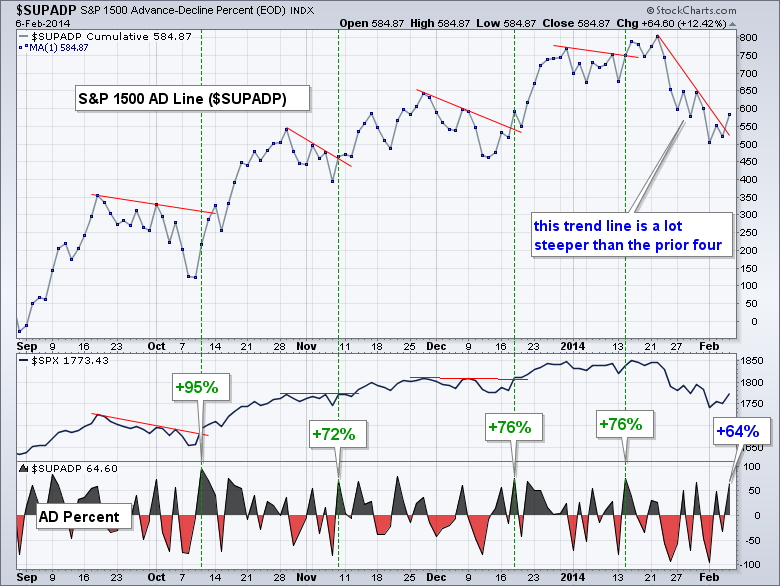
High-Low Percent for the S&P 1500 dipped into negative territory in late January. This is potentially significant because prior dips did not extend past the -2% level and marked turning points in the S&P 1500. The chart below shows the S&P 1500 High-Low Line...
READ MORE
MEMBERS ONLY

Welcome to DecisionPoint on StockCharts!
by Erin Swenlin,
Vice President, DecisionPoint.com
Hello!
There is very exciting news today - our website, DecisionPoint.com, is merging with Stockcharts.com! As part of that merger, I'm starting this new blog to help both DecisionPoint members and StockCharts members learn about how to use DecisionPoint features together with StockCharts features and get...
READ MORE
MEMBERS ONLY

BLAME XLY AND TLT BEFORE EEM -- FEBRUARY PATTERNS SHIFT FOR THE S&P 500 -- ADDING A TIME DIMENSION TO THE CORRECTION TARGETS -- BREADTH INDICATORS PULLBACK WITHIN BIGGER UPTREND -- NET NEW HIGHS DIP TO PRIOR REVERSAL ZONES
by John Murphy,
Chief Technical Analyst, StockCharts.com
BLAME XLY AND TLT BEFORE EEM... Link for today's video. There is certainly a lot of blame to go around for the recent weakness in the stock market. First, the employment report missed expectations at the beginning of January and this kept a bid in the bond market....
READ MORE
MEMBERS ONLY

Four Perspectives About 'Being in the Zone'
by Gatis Roze,
Author, "Tensile Trading"
I had breakfast the other day with a group of friends, and we spent the morning discussing what it meant to be ‘in the Zone’. Interestingly, we had four very different perspectives. One person came from a professional athletic perspective, another was a race car driver, another was a minister...
READ MORE
MEMBERS ONLY

Canada Bucks the Trend as TSX Gains in January (video)
by Arthur Hill,
Chief Technical Strategist, TrendInvestorPro.com
It has been a rough year for global equity markets, but the S&P/TSX Composite ($TSX) is bucking the trend with a small gain year-to-date. Notice that the Hang Seng Composite ($HSI) and Nikkei 225 ($NIKK) are leading Asia lower, while the Bovespa ($BVSP) is weighing on Latin...
READ MORE
MEMBERS ONLY

Momentum Slips and Net New Highs Dip
by Arthur Hill,
Chief Technical Strategist, TrendInvestorPro.com
Stocks were hit with more selling pressure and the major index ETFs are now down year-to-date. This was enough to push the momentum indicators into negative territory and prompt a downgrade. This pullback, however, could be just a correction. Interestingly, large-caps led this decline and small-caps are holding up well....
READ MORE
MEMBERS ONLY

XLI and XLF Form Small Bearish Patterns
by Arthur Hill,
Chief Technical Strategist, TrendInvestorPro.com
Stocks got an oversold bounce with the major index ETFs gaining over 1% on the day. All nine sectors moved higher with the consumer discretionary, finance, technology, healthcare and utilities sectors gaining over 1%. The Home Construction iShares (ITB) lagged with a small loss and the Retail SPDR (XRT) only...
READ MORE
MEMBERS ONLY

$SPX FED DATES CREATE SUPPORT AT 1775 -- NUMBER OF STOCKS ABOVE THE 50 DMA IS AT A RALLY LEVEL -- $SPXA200R IS WEAKENING - NEXT RALLY MAY DEFINE MAJOR TOP -- $NATGAS BECOMES A LAUNCH FUEL -- GLD MOVES BACK BELOW THE 20 DMA -- FACEBOOK TAKES FLIGHT
by John Murphy,
Chief Technical Analyst, StockCharts.com
$SPX FED DATES CREATE SUPPORT AT 1775... The stock market has returned back to the level that was first touched on the Oct 30th Fed meeting at 1775 as shown in Chart 1. After running back below 1750 in November, the reversal came in right after the large black engulfing...
READ MORE
MEMBERS ONLY

UPS Makes Oversold with Improving RSI Scan
by Arthur Hill,
Chief Technical Strategist, TrendInvestorPro.com
After a sharp decline the last three days, the stock market was oversold and ripe for a bounce. Looking through the predefined scans page, chartists can find a great scan for this situation, such as the "oversold with an improving RSI" scan. While not every stock has a...
READ MORE
MEMBERS ONLY

Charts: ALTR, HFC, HUM, MSFT, TSO, VZ
by Arthur Hill,
Chief Technical Strategist, TrendInvestorPro.com
ALTR Attempts to Hold Breakout.
MSFT Bounces on Good Volume.
Plus HUM, HFC, TSO, VZ
Individual charts are below video.
Sorry but your browser doesn't support HTML5 video.
**This chart analysis is for educational purposes only, and should not
be construed as a recommendation to buy, sell or...
READ MORE
MEMBERS ONLY

SPY Tests Support as TLT and GLD Extend Uptrends
by Arthur Hill,
Chief Technical Strategist, TrendInvestorPro.com
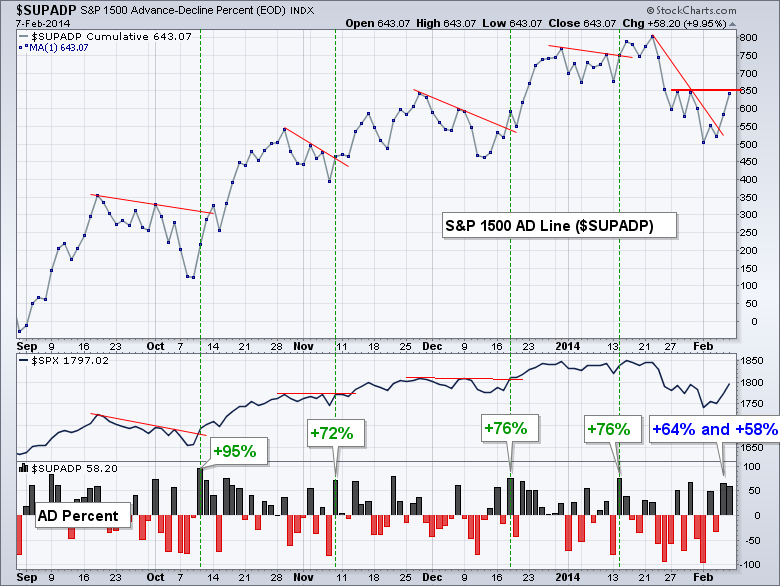
After a small bounce late Monday and Tuesday, stocks opened weak and remained weak on Wednesday. Stocks are still short-term oversold and the long-term trend remains up. This means we have a setup for an oversold bounce. The chart below shows the 10-day SMA for S&P 1500 AD...
READ MORE
