MEMBERS ONLY

Charts of Interest: AMT, AN, CY, FB, PLCM, TER

by Arthur Hill,
Chief Technical Strategist, TrendInvestorPro.com
AMT Bounces off Key Retracement with Volume.
AN Forms Flag after Wedge Break.
Plus CY, FB, PLCM and TER.
Individual charts are below video.
Sorry but your browser doesn't support HTML5 video.
Click here for iPad/iPhone Version
**This chart analysis is for educational purposes only, and should...
READ MORE
MEMBERS ONLY
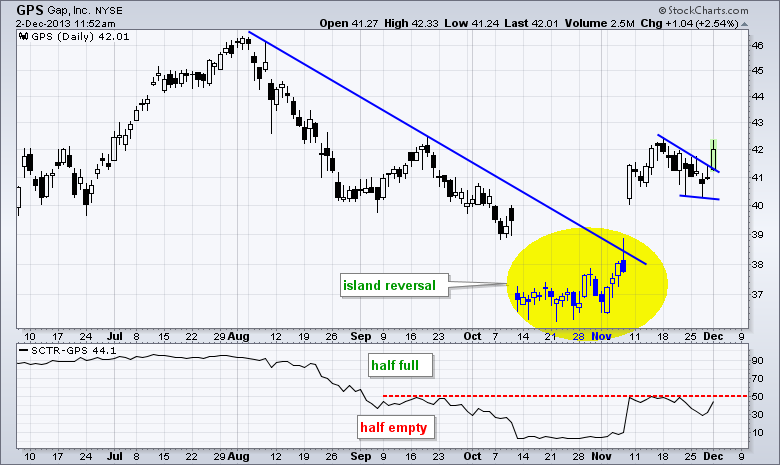
SCTR Surges as Gap Breaks Wedge Resistance
by Arthur Hill,
Chief Technical Strategist, TrendInvestorPro.com
Gap is making some waves with an island reversal in early November and wedge breakout here in early December. Also notice that the SCTR surged above 40 and is on the verge of breaking into the upper half of its range. Click here for the current SCTRs for the S&...
READ MORE
MEMBERS ONLY

STOCKS ARE STILL THE BEST GAME IN TOWN -- SMALL-CAPS AND MICRO-CAPS START TO OUTPERFORM -- THE JANUARY EFFECT GETS EARLIER AND EARLIER -- LIVE DEMO OF SEASONALITY TOOL -- OFFENSIVE SECTOR PERFORMANCE SUPPORTS THE BULLISH CASE

by John Murphy,
Chief Technical Analyst, StockCharts.com
STOCKS ARE STILL THE BEST GAME IN TOWN... Link for today's video. Stocks may seem overbought and ripe for a corrective period, but the uptrends look solid and the seasonal patterns are bullish for December. Today's commentary will look at the "participation factor" and...
READ MORE
MEMBERS ONLY

Small-Caps Start to Lead - Dollar Hits Support Zone
by Arthur Hill,
Chief Technical Strategist, TrendInvestorPro.com
Trading was a bit strange last week, but stocks remain in short-term uptrends and still show no signs of sustained selling pressure. First, the trading week was short because of the Thanksgiving holiday and shortened day on Friday. Second, volume levels were low. Third, trading was rather mixed with the...
READ MORE
MEMBERS ONLY

The Squeeze Play is On for Qlogic
by Arthur Hill,
Chief Technical Strategist, TrendInvestorPro.com
After a big surge in October, Qlogic (QLGC) moved into a consolidation as volatility contracted. Notice that the Bollinger Bands contracted and the Bandwidth moved to its lowest level of the year. The stock is showing some signs of buying pressure with two white candles over the last five days....
READ MORE
MEMBERS ONLY

The New Seasonality Tool: A Good Fortune Cookie That Just Keeps Giving

by Gatis Roze,
Author, "Tensile Trading"
In the movie Margin Call, the character played by Jeremy Irons says: “there are 3 ways to make money in this business: (1) be first, (2) be smarter, or (3) cheat.” This blog offers you option #2. Think of the new seasonality tool as a holiday investing treat that you...
READ MORE
MEMBERS ONLY

Home Construction SPDR Makes the Aroon Bull Scan
by Arthur Hill,
Chief Technical Strategist, TrendInvestorPro.com
The Home Construction SPDR (ITB) is making a bid to break resistance as Aroon Up surges above Aroon Down. Also notice that Aroon Up hit 100, which suggests that a new uptrend may be emerging. Note, however, that this is the third time in three months that Aroon Up has...
READ MORE
MEMBERS ONLY

Skyworks Solutions Breaks Cup-with-Handle Resistance
by Arthur Hill,
Chief Technical Strategist, TrendInvestorPro.com
The cup-with-handle pattern is a bullish continuation pattern that was popularized by William O'Neil of IBD. The handle marks a small consolidation near resistance and the breakout confirms the pattern. With the cup measuring around three points from low to high, chartists can project a three point move...
READ MORE
MEMBERS ONLY

STOCKCHART SCTRS SHOW HOMEBUILDERS TO BE DAY'S STRONGEST GROUP -- DOW JONES HOME CONSTRUCTION ISHARES HAS BIGGEST SCTR JUMP TODAY -- INDIVIDUAL HOMEBUILDERS WITH HIGHEST SCTR RANKINGS (AND STRONGEST CHART PATTERNS) ARE NVR, TOLL BROTHERS, AND PULTEGROUP
by John Murphy,
Chief Technical Analyst, StockCharts.com
APPLYING SCTR LINE TO HOME CONTRUCTION ISHARES ... SCTRs are one of the most helpful ways to find new leaders in the stock market. SCTRs stand for StockCharts Technical Rank which is a number between 0 and 100 that determines a market's relative strength. The numbers are derived from...
READ MORE
MEMBERS ONLY

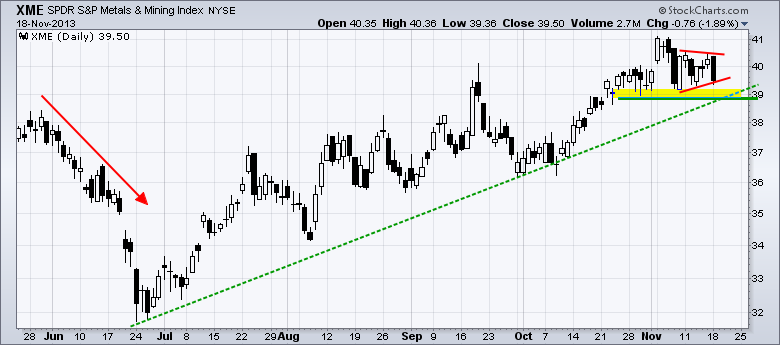
DEFINING THE CHANNELS FOR IWM AND QQQ -- NATGAS HOLDS BREAKOUT AND SURGES TO RESISTANCE -- NATURAL GAS INDEX ETF BREAKS FLAG RESISTANCE -- CATERPILLAR AND DEERE SURGE TO RESISTANCE -- COAL ETF AND METALS-MINING SPDR TESTS SUPPORT
by John Murphy,
Chief Technical Analyst, StockCharts.com
DEFINING THE CHANNELS FOR IWM AND QQQ... Link for today's video. Chartists can define a trend using channel trend lines and the Raff Regression Channel. I typically use channel trend lines when the peaks and troughs align to form parallel lines. Sometimes the peaks and troughs do not...
READ MORE
MEMBERS ONLY

Pre-defined Technical Alerts Page Lights Up Green
by Arthur Hill,
Chief Technical Strategist, TrendInvestorPro.com
Stocks opened higher on Monday with several ETFs hitting new highs and new all time highs. Chartists can follow these milestones on the Predefined Technical Alerts page. In addition to several major stock indices, note that XLY, XLV, XLI and XLF recorded new highs on Monday. Also note that oil...
READ MORE
MEMBERS ONLY
IWM Revives and Surges to New High
by Arthur Hill,
Chief Technical Strategist, TrendInvestorPro.com
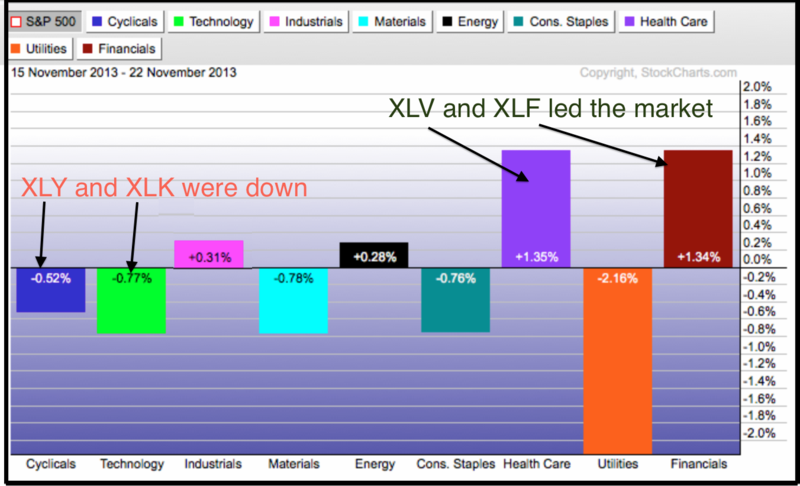
Programming note: I am taking some holiday this week and Art's Charts will not be updated on Tuesday, Wednesday and Friday. The market is closed on Thursday and will close early on Friday (1PM). Stocks were relatively mixed last week, but some groups led the market and the...
READ MORE
MEMBERS ONLY
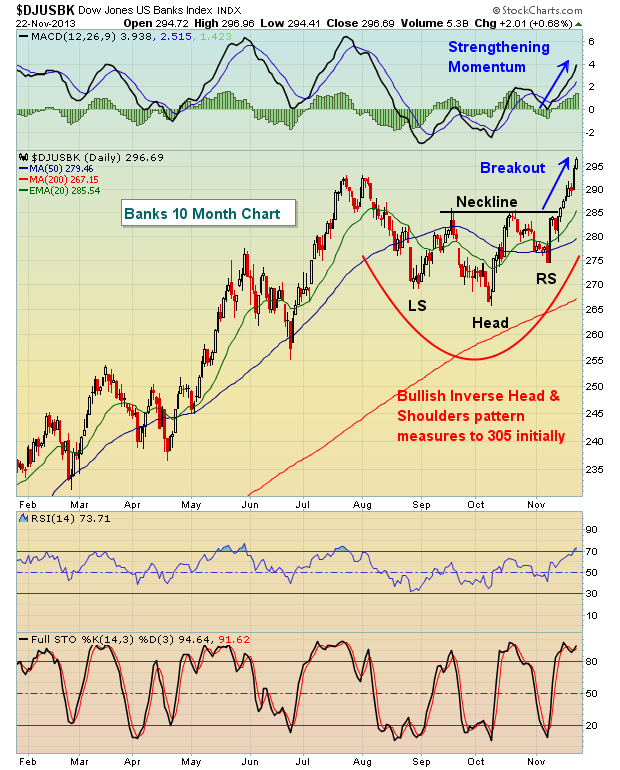
Banks Surge As Bull Market Rages On

by Tom Bowley,
Chief Market Strategist, EarningsBeats.com
I rarely question a market move to the upside when banks are leading the charge. And if you're wondering how the banks performed last week as the S&P 500 broke to a fresh all-time high, check out the Dow Jones US Bank Index chart:
Banks consolidated...
READ MORE
MEMBERS ONLY
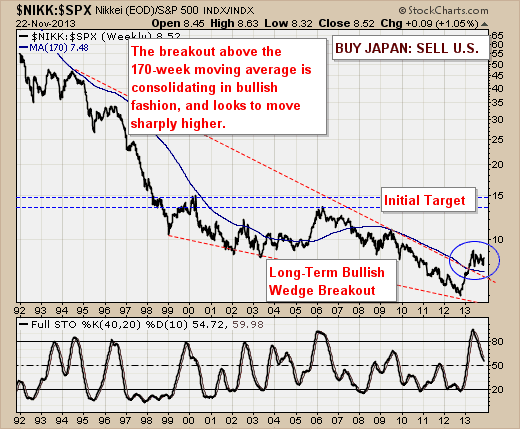
Buy Japan, Sell US

by Richard Rhodes,
Founder and President, Rhodes Capital Management and Rhodes Trading Group
With the equity markets hitting all-time highs in many cases, we think it prudent to look around the world and determine if there are any better risk-reward countries into which one can invest or park money for the long-term. To this end, we believe that the multi-decade decline of Japan&...
READ MORE
MEMBERS ONLY
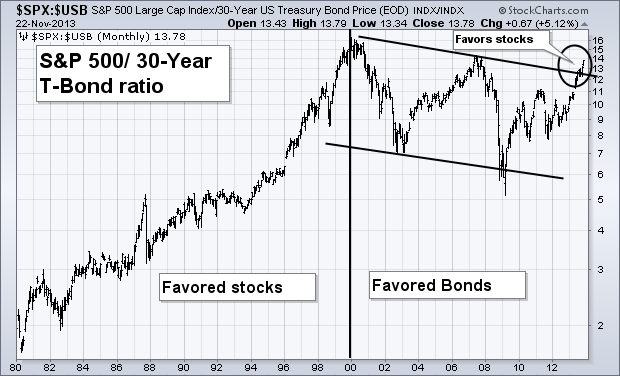
The Great Rotation is Well Underway
by John Murphy,
Chief Technical Analyst, StockCharts.com
There's a positive side effect to rising bond yields. When bond yields rise, bond prices fall. When bond prices fall, investors start moving money into stocks. That sequence supports the view that higher bond yields are already causing a generational shift in favor of stocks. Chart 1 plots...
READ MORE
MEMBERS ONLY
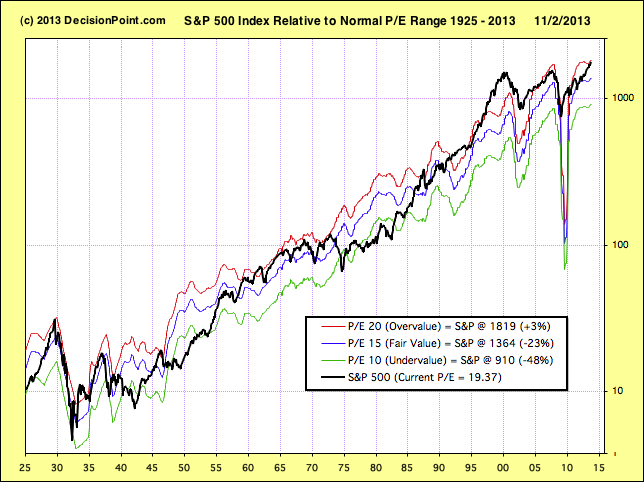
Stocks Overvalued but No Bubble

by Carl Swenlin,
President and Founder, DecisionPoint.com
As usual we are hearing many claims regarding market valuation, mostly that stocks are undervalued based upon future earnings projections. We are also seeing a lot of headlines about stocks being in a bubble. Using twelve-month trailing earnings for the S&P 500 Index, we find that stocks are...
READ MORE
MEMBERS ONLY
Tis the Season... for Seasonality Charts!
Hello Fellow ChartWatchers!
Almost everything is at record highs right now. Dow is above 16,000. S&P is above 1800. All of the S&P Sectors are higher year-to-date with Health Care being the strongest (+40.3%) and Utilities being the weakest (+13.9%). Is it exuberance?...
READ MORE
MEMBERS ONLY

YIELD CURVE PLOTS THE DIFFERENCE BETWEEN LONG AND SHORT TERM RATES -- THE YIELD CURVE SUGGESTS AN UPPER LIMIT OF 3.75% FOR 10-YEAR YIELD -- THE GREAT ROTATION FROM BONDS TO STOCKS IS WELL UNDERWAY
by John Murphy,
Chief Technical Analyst, StockCharts.com
COMPARISON OF LONG AND SHORT TERM RATES... I'm going to devote this message to an explanation of the "yield curve" -- what it is and how you can use it to determine the direction of bond yields and the stock market. During the financial crisis of...
READ MORE
MEMBERS ONLY
Finance Sector Leads with a Fresh 52-week High
by Arthur Hill,
Chief Technical Strategist, TrendInvestorPro.com
Three of the nine sector SPDRs hit new highs this week with the Finance SPDR (XLF) leading the way. The Energy SPDR (XLE) and the Healthcare SPDR (XLV) also recorded new highs. Even though XLF has been underperforming the S&P 500 since summer, this key sector is showing...
READ MORE
MEMBERS ONLY

Insiders Know It, Professionals Have It, Novice Investors Ignore It
by Gatis Roze,
Author, "Tensile Trading"
When the stock market ground below your feet begins to shift, metaphorically-speaking, and your charts turn into Jello, it will take much more than your magical methodology to save the day. Turning pain into a beautiful trade is what marks a master investor. So why is it that over the...
READ MORE
MEMBERS ONLY

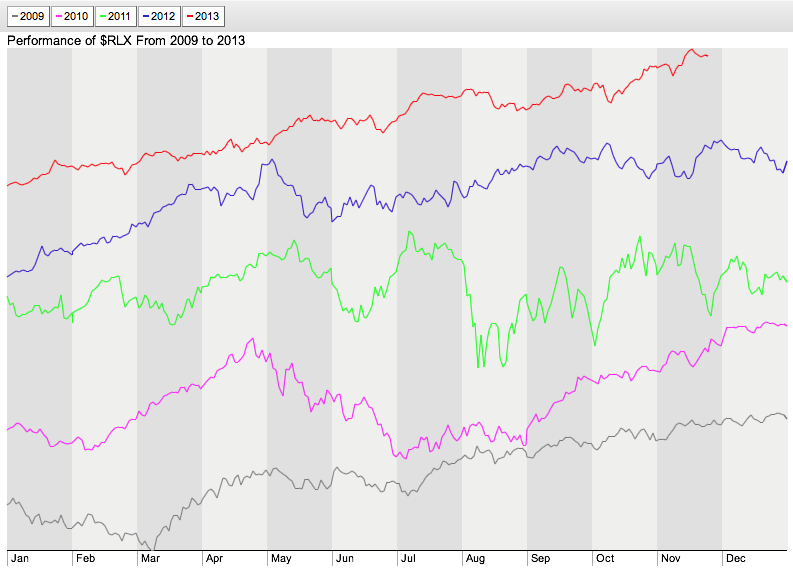
Retail SPDR Hits Channel Trend Line
by Arthur Hill,
Chief Technical Strategist, TrendInvestorPro.com
The Retail SPDR (XRT) has been one of the strongest industry group ETFs this year with a 25+ percent advance. Even though the ETF is looking overextended as it hits the upper trend line of a rising channel, it is by no means weak. Notice that XRT has traded in...
READ MORE
MEMBERS ONLY

HISTORY SUGGESTS THIS IS NOT ANOTHER TECHNOLOGY BUBBLE -- COMPARISON TO 2000 SHOWS WHAT A TECH BUBBLE LOOKED LIKE -- SECTORS IN A BUBBLE ARE USUALLY MARKET LEADERS -- TECHS ARE MARKET LAGGARDS
by John Murphy,
Chief Technical Analyst, StockCharts.com
NASDAQ MAY BE OVERBOUGHT, BUT NOT IN A BUBBLE... There's been a lot of media talk recently about another "technology bubble". While the group may be over-extended (more on that shortly), talk of a bubble seems misguided. Here's the thing about bubbles. While we...
READ MORE
MEMBERS ONLY

Gentiva Bucks the Selling Pressure with 3-Day Advance
by Arthur Hill,
Chief Technical Strategist, TrendInvestorPro.com
The healthcare sector is one of the strongest sectors in the market, but Gentiva (GTIV) has lagged and failed to keep pace. Even though the stock is in a medium-term downtrend, this decline could be a correction. Notice how the decline formed a falling wedge and retraced 62%. Also notice...
READ MORE
MEMBERS ONLY

ITB Stalls after Breakout - UUP Breaks Flag Resistance
by Arthur Hill,
Chief Technical Strategist, TrendInvestorPro.com
Programming note: I am on the road Friday and commentary for Art's charts will not be published on Friday. The next commentary will be on Monday. Taper talk allegedly weighed on the market Wednesday, but the declines in the major index ETFs were minimal. The S&P...
READ MORE
MEMBERS ONLY
Charts of Interest: APC, ATML, DHI, EMC, HPQ
by Arthur Hill,
Chief Technical Strategist, TrendInvestorPro.com
APC Forms Flag after High Volume Decline.
ATML Springs a Bear Trap.
Plus DHI, EMC and HPQ
Individual charts are below video.
**This chart analysis is for educational purposes only, and should not
be construed as a recommendation to buy, sell or sell-short said securities**
Sorry but your browser doesn&...
READ MORE
MEMBERS ONLY
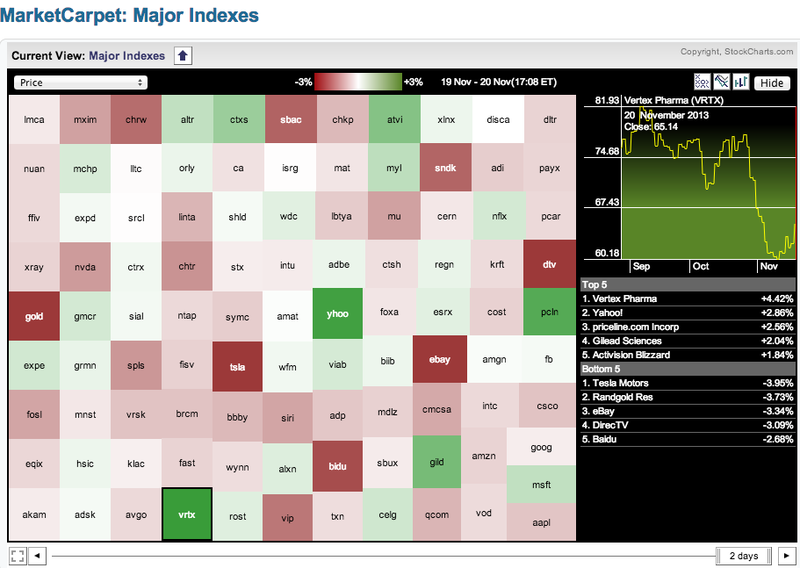
Vertex and Yahoo! Lead Nasdaq 100 MarketCarpet
by Arthur Hill,
Chief Technical Strategist, TrendInvestorPro.com
The Nasdaq 100 MarketCarpet was mixed on Wednesday with several big losers and a handful of strong gainers. The dark green boxes show big gains in Yahoo! (YHOO), Vertex (VRTX), PriceLine (PCLN) and Gilead Science (GILD). These gains were countered with sizable losses in Tesla (TSLA), Randgold (GOLD), Ebay (EBAY)...
READ MORE
MEMBERS ONLY

INTEREST RATE SENSITIVE ETFS LEAD MARKET LOWER -- TLT HOLDS BREAK AND CONTINUES LOWER -- INTEREST RATES COULD SIMPLY RETURN TO NORMAL -- DOLLAR BREAKS FLAG RESISTANCE AS EURO PLUNGES -- GOLD AND SILVER TANK ON TAPER THOUGHTS
by John Murphy,
Chief Technical Analyst, StockCharts.com
INTEREST RATE SENSITIVE ETFS LEAD MARKET LOWER... Link for today's video. Stocks extended their correction as the S&P 500 ETF (SPY) closed lower for the third day running. Even though the ETF declined three days in a row, selling pressure has been relatively light because SPY...
READ MORE
MEMBERS ONLY
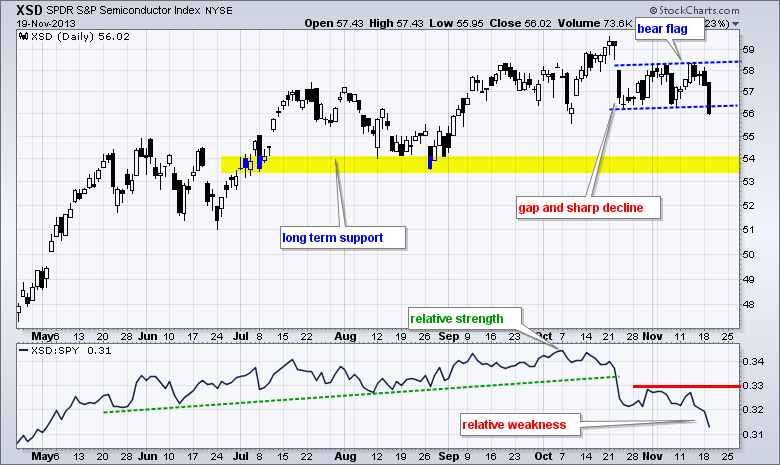
Semis Weigh as XSD Breaks Flag Support
by Arthur Hill,
Chief Technical Strategist, TrendInvestorPro.com
Stocks corrected the last two days with relatively mild selling pressure. The Russell 2000 ETF (IWM) lost .62% and the S&P 500 ETF (SPY) fell just .22%. IWM continues to show relative weakness over the last six weeks. The sectors were mixed with six down and three up....
READ MORE
MEMBERS ONLY
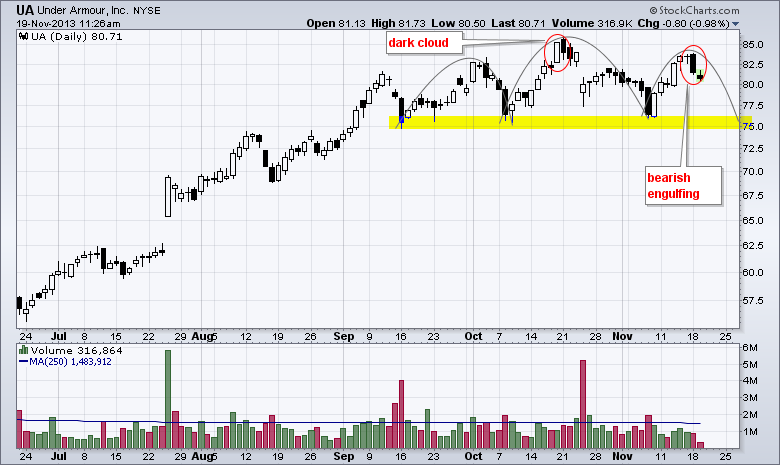
Under Armour Forms Bearish Candlestick Pattern
by Arthur Hill,
Chief Technical Strategist, TrendInvestorPro.com
Under Armour (UA) is currently in a long-term uptrend, but the stock stalled over the last three months with a head-and-shoulders pattern taking shape. The right shoulder is under construction with a bearish engulfing marking the high. The September-November lows mark neckline support in the 75-76 area.
Click this image...
READ MORE
MEMBERS ONLY
QQQ Leads Late Sell Off - KOL Forms Bearish Engulfing
by Arthur Hill,
Chief Technical Strategist, TrendInvestorPro.com
Stocks traded relatively flat the first part of the day and then got hit with selling pressure in the afternoon. Techs led the way down with the Nasdaq 100 ETF (QQQ) losing around 1%. Eight of the nine sectors were down with the Consumer Discretionary SPDR (XLY) and Energy SPDR...
READ MORE
MEMBERS ONLY
Charts: CAT, COF, DOW, FB, MOVE, NVR, PEG, RDC
by Arthur Hill,
Chief Technical Strategist, TrendInvestorPro.com
CAT Extends Post-Gap Consolidation.
COF Shows Relative Weakness as Wedge Forms.
Plus DOW, FB, MOVE, NVR, PEG, RDC
Individual charts are below the video.
Sorry but your browser doesn't support HTML5 video.
Click here for iPad/iPhone Version
**This chart analysis is for educational purposes only, and should...
READ MORE
MEMBERS ONLY

ENERGY SPDR GETS COLD FEET WITH BEARISH ENGULFING -- THE NOOSE TIGHTENS FOR TWO SEMICONDUCTOR ETFS -- PCP AND TSO SCORE BIG ON SCTR TABLE -- ROCKWELL COLLINS AND GOLDMAN SACHS BREAK RESISTANCE -- SHANGHAI COMPOSITE CHALLENGES FLAG RESISTANCE
by John Murphy,
Chief Technical Analyst, StockCharts.com
ENERGY SPDR GETS COLD FEET WITH BEARISH ENGULFING... Link for today's video. I wrote about the Energy SPDR (XLE) breaking flag resistance with a surge on Friday and this breakout is already getting cold feet as the ETF forms a bearish engulfing pattern. Despite this bearish reversal pattern,...
READ MORE
MEMBERS ONLY
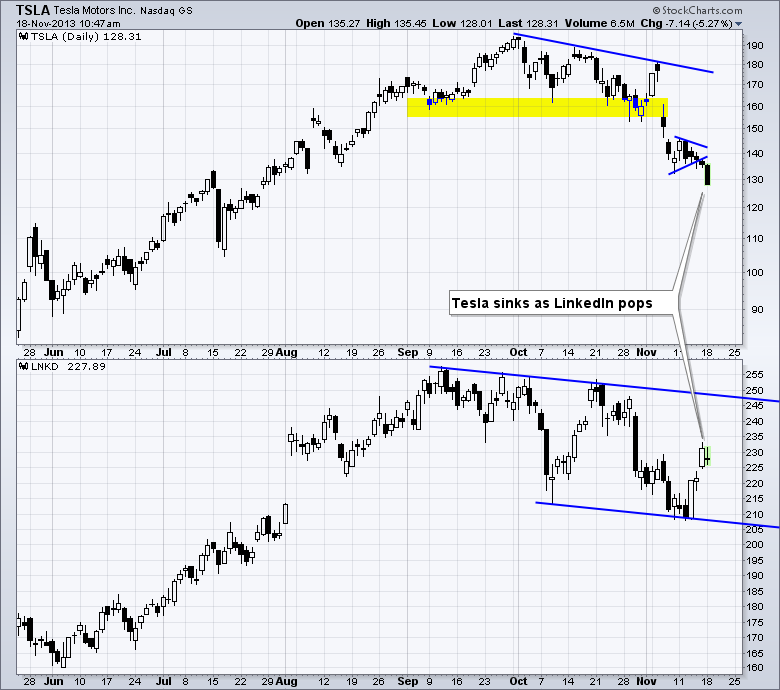
LinkedIn and Tesla Go their Separate Ways
by Arthur Hill,
Chief Technical Strategist, TrendInvestorPro.com
There was a time when LinkedIn (LNKD) and Tesla (TSLA) were joined at the hip and led the momentum crowd. Both stocks surged from January to September and then corrected from early October to mid November. This relationship appears to be changing as Tesla sank to new lows for the...
READ MORE
MEMBERS ONLY
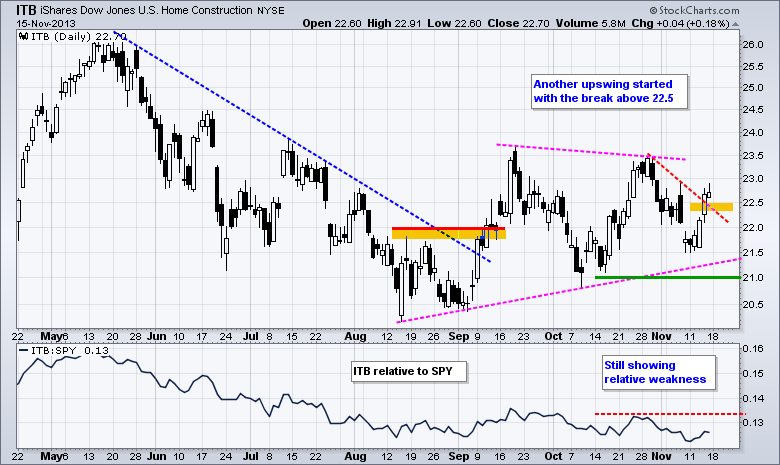
ITB Reverses Downswing and GLD Bounces off October Low
by Arthur Hill,
Chief Technical Strategist, TrendInvestorPro.com
The bulls continue to press their case as the major index ETFs scored modest gains for the week. It is not as if buying pressure is especially strong. Buying pressure, however, is clearly stronger than selling pressure. In fact, selling pressure is pretty much non-existent. The Nasdaq 100 Equal-Weight ETF...
READ MORE
MEMBERS ONLY
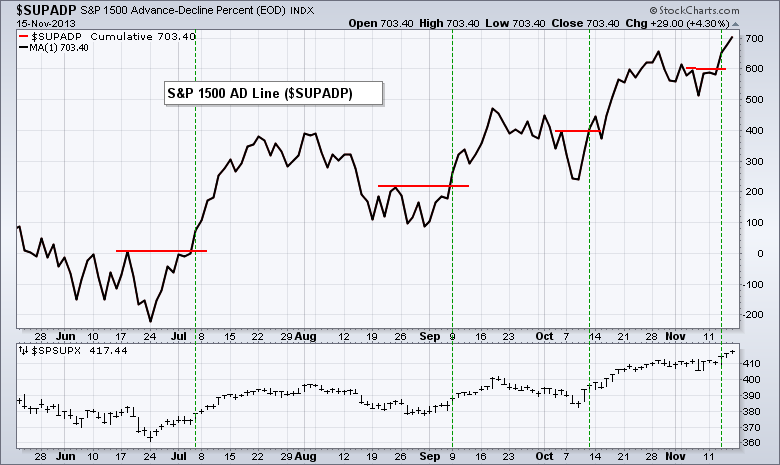
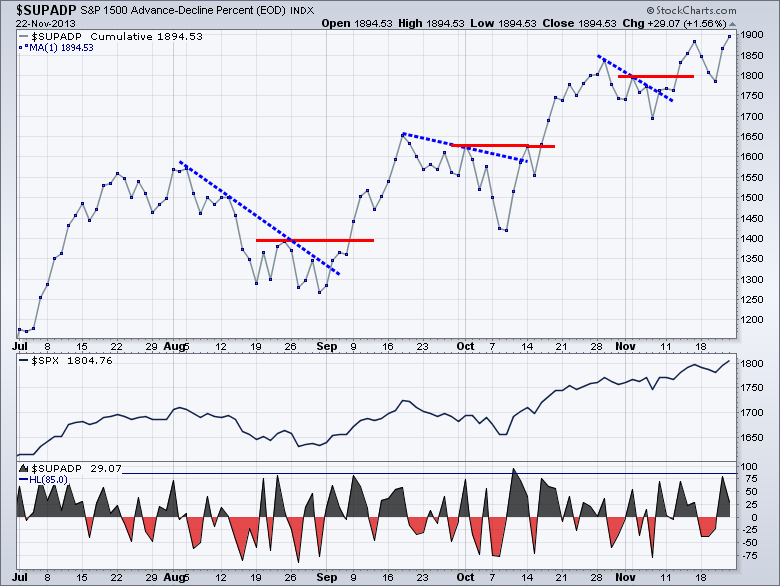
Breadth Indicators Confirm with New Highs
by Arthur Hill,
Chief Technical Strategist, TrendInvestorPro.com
When a major index records a new high, I go straight to the key breadth indicators to see if these highs were confirmed. Breadth indicators are sometimes called "internal" indicators because they measure what is happening inside a specific index or ETF. We can see what is happening...
READ MORE
MEMBERS ONLY

EIGHT OF THE NINE SECTOR SPDRS HIT NEW HIGHS -- RETAIL AND REGIONAL BANKS OUTWEIGH SEMIS AND NETWORKING -- S&P EQUAL WEIGHT ETF AND S&P MIDCAP SPDR RECORD NEW HIGH -- BREADTH INDICATORS CONFIRM WITH NEW HIGHS
by John Murphy,
Chief Technical Analyst, StockCharts.com
EIGHT OF THE NINE SECTOR SPDRS HIT NEW HIGHS... Link for today's video. Even though there are some pockets of weakness in the stock market, one cannot help but be impressed with new highs from several key ETFs. First, note that eight of the nine sector SPDRs recorded...
READ MORE
MEMBERS ONLY

When Market Wizard Ed Seykota Speaks, I Listen!
by Gatis Roze,
Author, "Tensile Trading"
I had the good fortune of hearing Ed Seykota speak at the International Federation of Technical Analysts in San Francisco a few weeks ago. To say he’s extraordinary is an understatement. I can’t even bring myself to quote his performance numbers at the risk you’ll question this...
READ MORE
MEMBERS ONLY

Peabody Breaks P&F Support as Coal Loses Favor
by Arthur Hill,
Chief Technical Strategist, TrendInvestorPro.com
Coal stocks were hit with selling pressure after the TVA announced the closing of eight coal-fired power plants. The 60-minute P&F chart shows BTU breaking Quadruple Bottom support and sporting a downside price objective of 18.65. Note that chartists can change the period settings and price fields...
READ MORE
MEMBERS ONLY

Major Index ETFs and NYSE AD Volume Line Hit New Highs
by Arthur Hill,
Chief Technical Strategist, TrendInvestorPro.com
There is no change in the indicator summary as the bulk of the evidence remains bullish. We saw new highs in SPY, RSP and MDY this week. The NYSE AD Volume Line also hit a new high. Net New Highs surged as buying pressure picked up in November. Volatility remains...
READ MORE
MEMBERS ONLY

SPY and QQQ Hit New Highs, But IWM Drags its Feet
by Arthur Hill,
Chief Technical Strategist, TrendInvestorPro.com
Stocks got a bounce, but there were some pockets of weakness in the market. Get this. The Russell 1000 iShares (IWB) moved higher, but the Russell 2000 ETF (IWM) edged lower. We can blame this on the growth component because the Russell 2000 Value iShares (IWN) was up .22%, but...
READ MORE
