MEMBERS ONLY

FALLING YEN CONTRIBUTES TO UPSIDE BREAKOUT IN JAPANESE STOCKS -- DOW INDUSTRIALS HIT NEW RECORD HIGH -- UTILITIES AND HOMEBUILDERS HAVE STRONG DAY AND MAY BE BOTTOMING -- THAT WOULD TAKE WEIGHT OFF THE REST OF THE MARKET

by John Murphy,
Chief Technical Analyst, StockCharts.com
FALLING YEN BOOSTS JAPANESE STOCKS... Chart 1 shows the clear inverse relationship that has existed between Japanese stocks and the yen since mid-2012. The falling green line is the yen, while the rising orange line is the WisdomTree Japan Hedged Equity ETF (DXJ). [The DXJ is the best way to...
READ MORE
MEMBERS ONLY
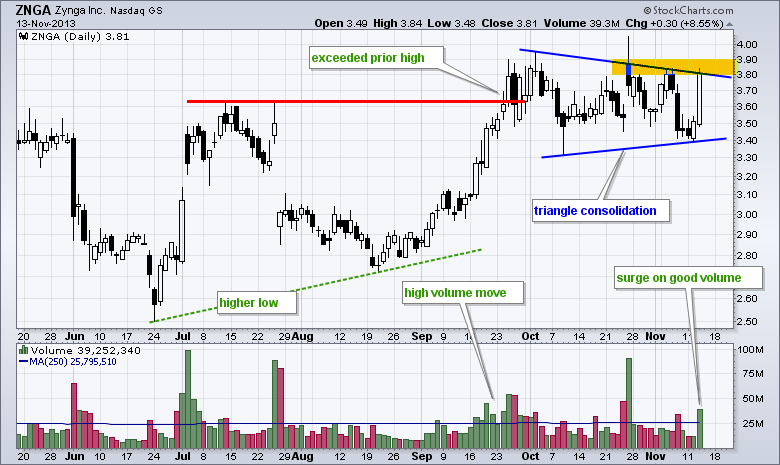
Zynga Forms Bullish Pattern and Zyngs Higher

by Arthur Hill,
Chief Technical Strategist, TrendInvestorPro.com
After a bullish engulfing on Tuesday, Zynga (ZNGA) surged to triangle resistance with high volume on Wednesday. Overall, chartists can make a bullish case for this internet-mobile gaming company. A higher low formed in August and the stock surged above the July high with good volume in September. The subsequent...
READ MORE
MEMBERS ONLY
Charts of Interest Video: BAX, BIIB, CNL, MAS, SIAL, TE, WFC
by Arthur Hill,
Chief Technical Strategist, TrendInvestorPro.com
Video for Art's Charts:
BAX Bounces off Support with Good Volume.
BIIB Hits an Interesting Juncture.
Plus CNL, MAS, SIAL, TE, WFC
Sorry but your browser doesn't support HTML5 video.
Click here for iPad/iPhone Version
This commentary and charts-of-interest are designed to stimulate thinking. This...
READ MORE
MEMBERS ONLY

IWM and QQQ Surge with Double Flag Breakouts
by Arthur Hill,
Chief Technical Strategist, TrendInvestorPro.com
Trading started mixed on Wednesday, but stocks caught a midday bid and raced higher to close strong. The Nasdaq 100 ETF (QQQ) and the Russell 2000 ETF (IWM) led the way. All sectors were up with the Consumer Discretionary SPDR (XLY) leading (+1.58%). Strength in Macy's boosted...
READ MORE
MEMBERS ONLY

Charts of Interest: BAX, BIIB, CNL, MAS, SIAL, TE, WFC
by Arthur Hill,
Chief Technical Strategist, TrendInvestorPro.com
BAX Bounces off Support with Good Volume.
BIIB Hits an Interesting Juncture.
Plus CNL, MAS, SIAL, TE, WFC
Individual charts are below.
Sorry but your browser doesn't support HTML5 video.
Click here for iPad/iPhone Version
**This chart analysis is for educational purposes only, and should not
be...
READ MORE
MEMBERS ONLY

Nasdaq and NYSE Most Actives Go Ten for Ten
by Arthur Hill,
Chief Technical Strategist, TrendInvestorPro.com
It was a big day for stocks as the ten most active stocks on the NYSE and Nasdaq advanced. As the Free Charts page shows, both exchanges went ten for ten. Bank of America (BAC) led the NYSE with a 2+ percent gain. Facebook (FB) led the Nasdaq with a...
READ MORE
MEMBERS ONLY

RUSSELL 2000 ETF CHALLENGES FLAG RESISTANCE -- HOME CONSTRUCTION ISHARES FILLS THE GAP AS TOL BOUNCES -- HOME DEPOT LIFTS XHB OFF KEY RETRACEMENT -- TRIANGLE TAKES SHAPE FOR DJ AUTO INDEX -- GM LEADS AUTO INDEX WITH NEW HIGH
by John Murphy,
Chief Technical Analyst, StockCharts.com
RUSSELL 2000 ETF CHALLENGES FLAG RESISTANCE... Link for today's video. Last week the Finance SPDR surged and broke flag resistance. Today the Russell 2000 ETF (IWM) is joining the fray with a break above flag resistance. First and foremost, chart 1 shows an overall uptrend because prices are...
READ MORE
MEMBERS ONLY

XLF Falls below Breakout Point - QQQ Hits Moment of Truth
by Arthur Hill,
Chief Technical Strategist, TrendInvestorPro.com
It was another mixed day for the major index ETFs. The Nasdaq 100 ETF (QQQ) edged higher, while the S&P 500 ETF (SPY) edged lower. Six of the nine sector SPDRs finished lower with the Finance SPDR (XLF), Energy SPDR (XLE) and Utilities SPDR (XLU) leading the way....
READ MORE
MEMBERS ONLY

BOND PRICES SELL OFF AS YIELDS RISE -- HIGH YIELD BOND ETF BACKS OFF FROM CHART RESISTANCE WHICH MAY CAUSE SOME SHORT-TERM STOCK SELLING -- RISING YIELD ALSO THREATENS EMERGING MARKETS
by John Murphy,
Chief Technical Analyst, StockCharts.com
BOND PRICES SELL OFF FROM CHART RESISTANCE ... My market message from October 31 showed bond ETFs starting to back off from overhead resistance barriers while in an overbought condition. Those ETFs have fallen since then as bond yields have risen. Chart 1 shows the Barclays 7-10 Year Treasury Bond iShares...
READ MORE
MEMBERS ONLY

Nikkei Breaks Wedge Resistance as Yen Weakens
by Arthur Hill,
Chief Technical Strategist, TrendInvestorPro.com
The Nikkei 225 ($NIKK) broke above wedge resistance with a surge to 14589 and extended its long-term uptrend. First, note that the long-term trend is up after the big surge from November to May. Second, this triangle represents a consolidation and the breakout signals a continuation of the uptrend. Third,...
READ MORE
MEMBERS ONLY
SPY Challenges Resistance, but IWM Remains Weak
by Arthur Hill,
Chief Technical Strategist, TrendInvestorPro.com
Stocks meandered in slow trading on Monday. The Nasdaq 100 ETF (QQQ) edged lower and the S&P 500 ETF (SPY) edged higher. The sectors were mixed with fractional gains and losses. The Retail SPDR (XRT) stood out with a 1% surge that neared its prior highs, while the...
READ MORE
MEMBERS ONLY
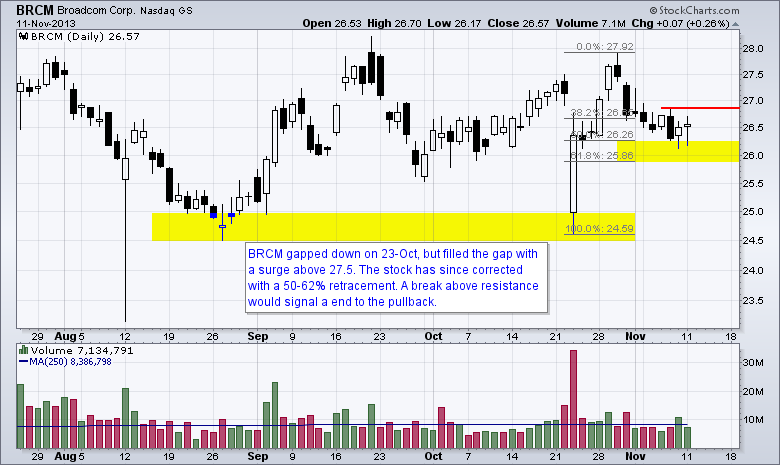
Charts of Interest: BRCM, DF, DHI, FNSR, TSO
by Arthur Hill,
Chief Technical Strategist, TrendInvestorPro.com
BRCM Firms at 50-62% Retracement.
DF Forms Bull Flag after Surge. Plus DHI, FNSR, TSO
Video is at top. Individual charts are below.
Click here for iPad/iPhone Version
**This chart analysis is for educational purposes only, and should not
be construed as a recommendation to buy, sell or sell-short...
READ MORE
MEMBERS ONLY
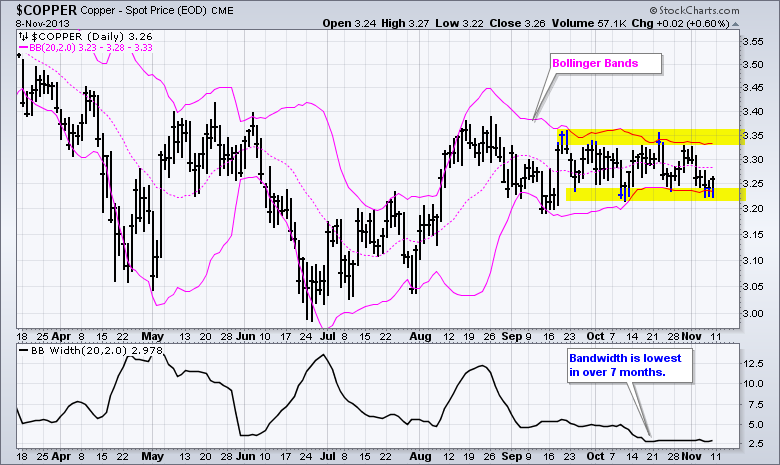
Bollinger Bands Narrow as Copper Consolidates
by Arthur Hill,
Chief Technical Strategist, TrendInvestorPro.com
Spot Copper ($COPPER) has gone nowhere the last three months and a narrowing consolidation is taking shape. The pink lines show the Bollinger Bands narrowing as volatility contracts. This is confirmed by the bandwidth indicator, which is trading near seven month lows. Traders should watch range for a break to...
READ MORE
MEMBERS ONLY

RELATIVE PERFORMANCE FLATTENS FOR XLY -- RETAIL SPDR SURGES TO HOLD BREAKOUT ZONE -- SEMICONDUCTOR SPDR CONSOLIDATES AFTER GAP -- ISM DUO STILL FAVORS ECONOMIC EXPANSION -- NON-FARM PAYROLLS CONTINUE MODEST EXPANSION
by John Murphy,
Chief Technical Analyst, StockCharts.com
RELATIVE PERFORMANCE FLATTENS FOR XLY... Link for today's video. The stock market surged on Friday, but there were some noticeable pockets of "less strength". The finance sector and banking group led the market and closed up for the week, but the Consumer Discretionary SPDR (XLY) lagged...
READ MORE
MEMBERS ONLY

Stocks Are Mixed with SPY Holding and IWM Folding
by Arthur Hill,
Chief Technical Strategist, TrendInvestorPro.com
The bulls went on a run after non-farm payrolls beat expectations and prior months were revised higher. Strength in employment put tapering back on the agenda and weighed on bonds. Taper-talk also weighed on gold as the Dollar surged and held last week's breakout. Despite Friday's...
READ MORE
MEMBERS ONLY

RISING BOND YIELD BOOSTS THE DOLLAR WHICH HURT COMMODITIES, ESPECIALLY GOLD -- RISING BOND YIELD HURTS DIVIDEND-PAYING STOCKS -- BUT HELPS ECONOMICALLY-SENSITIVE GROUPS -- STEEPENING YIELD CURVE GIVES LIFT TO BANK STOCKS
by John Murphy,
Chief Technical Analyst, StockCharts.com
BIG JUMP IN BOND YIELD STRENGTHENS THE DOLLAR ... An unusually strong employment report on Friday, following an uptick in GDP growth on Thursday, helped push bond yields sharply higher this week. Chart 1 shows the 10-Year Treasury Note Yield (TNX) climbing to the highest level since September (2.75%) and...
READ MORE
MEMBERS ONLY

XLF CHALLENGES FLAG RESISTANCE -- REGIONAL BANK SPDR SURGES TO NEW HIGH -- BANK OF AMERICA, CITIGROUP AND JP MORGAN LEAD XLF -- SOCIAL MEDIA ETF HITS SUPPORT ZONE -- LINKEDIN FORMS ABC CORRECTION -- FACEBOOK FIRMS ABOVE SUPPORT
by John Murphy,
Chief Technical Analyst, StockCharts.com
XLF CHALLENGES FLAG RESISTANCE ... Link for today's video. The Finance SPDR (XLF) remains on my radar because this key sector has been underperforming the broader market. That may be changing. Just to review, chart 1 shows the ETF surging above resistance in mid October, but failing to hold...
READ MORE
MEMBERS ONLY

The Tensile Trading ChartPack Users Manual: Organized & Optimized for Maximizing Profits

by Gatis Roze,
Author, "Tensile Trading"
This is so next step. Most money managers and traders will not share their approaches. You can understand why. A few will talk about their methodologies in generalizations, knowing that the essential fuel that runs the investing engine is discipline and carefully designed routines. It is these routines that take...
READ MORE
MEMBERS ONLY

Dow SPDR Forms Massive Engulfing Pattern
by Arthur Hill,
Chief Technical Strategist, TrendInvestorPro.com
There are bearish engulfing patterns and then there are BEARISH ENGULFING PATTERNS. With a strong open and weak close on Thursday, the Dow SPDR (DIA) formed the latter. This is the second bearish candlestick pattern in two weeks. A follow through break below the early November low would confirm this...
READ MORE
MEMBERS ONLY
How Can I Count the Number of Bars or Days in a Price Move?
by Arthur Hill,
Chief Technical Strategist, TrendInvestorPro.com
This article can be found in the Mailbag blog (click here)....
READ MORE
MEMBERS ONLY

AD Lines and AD Volume Lines Correct Within Uptrends
by Arthur Hill,
Chief Technical Strategist, TrendInvestorPro.com
The bulk of the evidence remains bullish, but this uptrend is getting long in tooth and the market is ripe for a correction. Note that the majority of technical indicators have been positive for a year now, which is the longest stretch since I began this table. Even though the...
READ MORE
MEMBERS ONLY

IWM Leads Lower as SPY Test Key Level
by Arthur Hill,
Chief Technical Strategist, TrendInvestorPro.com
Things that make you go hmm.... Stocks declined and a few media reports blamed a better-than-expected GDP report. Also note that October same-store retail sales were up 4%, which ain't bad considering all that shutdown stuff. The reasoning suggested that strength in the economy would lead to Fed...
READ MORE
MEMBERS ONLY

Twitter Establishes First Support with Consolidation
by Arthur Hill,
Chief Technical Strategist, TrendInvestorPro.com
There is not much historical data for Twitter (TWTR) because it opened for trading just today. However, there are already signs of support near the opening price. The 1-min chart shows TWTR opening at 45.10, surging to 50 and then falling back to the 45 area. Notice how the...
READ MORE
MEMBERS ONLY

Euro, the Dollar and Gold Brace for ECB Meeting
by Arthur Hill,
Chief Technical Strategist, TrendInvestorPro.com
It was a strange day on Wall Street. The Dow Industrials surged over 100 points, but the Russell 2000 fell .43%. The Consumer Staples SPDR (XLP) and Utilities SPDR (XLU) led the market higher, but the Technology SPDR (XLK) also showed relative strength with a 1.01% gain. Strength in...
READ MORE
MEMBERS ONLY

Charts of Interest: LNKD, MDR, MOVE, STX, WIN, YELP
by Arthur Hill,
Chief Technical Strategist, TrendInvestorPro.com
LNKD Forms Bear Flag at Support.
MDR Surges with Huge Volume.
Plus MOVE, STX, WIN, YELP
Video is at top. Individual charts are below.
**This chart analysis is for educational purposes only, and should not
be construed as a recommendation to buy, sell or sell-short said securities**
Click here for...
READ MORE
MEMBERS ONLY

DOW INDUSTRIALS REMAINS A SWINGERS PARADISE -- SMALL-CAPS AND FINANCIALS CONTINUE TO UNDERPERFORM -- TECHS AND STAPLES LEAD MIXED MARKET -- BASE METALS FUND BREAKS DOWN -- COPPER ETN TESTS KEY SUPPORT ZONE -- METALS NOT GETTING ANY HELP FROM CHINA
by John Murphy,
Chief Technical Analyst, StockCharts.com
DOW INDUSTRIALS REMAINS A SWINGERS PARADISE... Link for today's video. There is no shortage of big moves in the Dow Industrials over the last several months. Chart 1 shows the Dow with five swings of at least 800 points since June (three up and two down). It is...
READ MORE
MEMBERS ONLY

Facebook Doubles Down with Two Candlestick Patterns in Four Days
by Arthur Hill,
Chief Technical Strategist, TrendInvestorPro.com
Facebook (FB) came across the bullish engulfing scan twice in the last four days. The stock fell to support last week and then formed a big bullish engulfing pattern on high volume. After a pullback on Friday-Monday, the stock opened weak on Tuesday and closed strong to form another bullish...
READ MORE
MEMBERS ONLY

ITB Hits Key Retracement, but Rising Yields Weigh
by Arthur Hill,
Chief Technical Strategist, TrendInvestorPro.com
Stocks edged lower on Tuesday with the major index ETFs ending with small losses. The S&P Midcap SPDR (MDY) fell .63% and the S&P 500 ETF (SPY) lost .32%, but the Nasdaq 100 ETF (QQQ) bucked the selling with a fractional gain (+.11%). Eight of the...
READ MORE
MEMBERS ONLY

RSI Breaks Key Level on Carmax Chart
by Arthur Hill,
Chief Technical Strategist, TrendInvestorPro.com
Carmax is making a move as it bounces off support and breaks wedge resistance. Support in the 46-47 area extends back to the July low. The breakout is valid as long as it holds and I would watch 47.6 for the first signs of failure. The indicator window shows...
READ MORE
MEMBERS ONLY

BOND PRICES CONTINUE TO BACK OFF FROM OVERHEAD RESISTANCE -- THAT'S EXERTING DOWNSIDE PRESSURE ON HOMEBUILDERS AND REITS -- UTILITIES ARE TESTING SUMMER HIGHS -- FALLING CRUDE OIL HAS GIVEN BIG LIFT TO AIRLINES
by John Murphy,
Chief Technical Analyst, StockCharts.com
BOND FUND TURNS DOWN AT RESISTANCE ... My last message showed various overbought bond ETFs starting to weaken from overhead resistance. Since then, bond ETFs have fallen even further. Chart 1 shows the Barclays Aggregate Bond iShares (AGG) falling back below its 200-day moving average after failing a test of an...
READ MORE
MEMBERS ONLY

IWM Hits Key Retracement and Moment of Truth
by Arthur Hill,
Chief Technical Strategist, TrendInvestorPro.com
Stocks rebounded on Monday with modest gains in the major index ETFs. Small-caps led the recovery as the Russell 2000 ETF (IWM) gained 1.15% on the day. Those looking for a rally excuse can point to the beginning of the month phenomenon because Monday was the second trading day...
READ MORE
MEMBERS ONLY

Charts: BBBY, BOOM, EBAY, GTIV, IGT, IMMR, PMTC, RLGY
by Arthur Hill,
Chief Technical Strategist, TrendInvestorPro.com
BBBY Consolidates After Big Gap.
BOOM Turns Volatile on High Volume.
Plus EBAY, GTIV, IGT, IMMR, PMTC, RLGY
Video is at top. Individual charts are below.
**This chart analysis is for educational purposes only, and should not
be construed as a recommendation to buy, sell or sell-short said securities**
Click...
READ MORE
MEMBERS ONLY

Paper-Forest Products Lead Industry Group Market Carpet
by Arthur Hill,
Chief Technical Strategist, TrendInvestorPro.com
The Market Carpet shown here focuses on the US industry groups from the Market Summary Market. Chartists can focus on a particular section of a Market Carpet by double clicking a square. Notice that the DJ US Paper-Forest Products Index ($DJUSFR) is the best performer over the last five days....
READ MORE
MEMBERS ONLY

MDY AND QQQ EXTEND CONSOLIDATIONS -- INDUSTRIALS AND CONSUMER DISCRETIONARY SECTORS LEAD -- EXPECTATIONS SHIFT AS DOLLAR SURGES AND EURO PLUNGES -- BRENT CRUDE AND NATURAL GAS BREAK DOWN -- PALLADIUM CONSOLIDATES WITH BULLISH PATTERN
by John Murphy,
Chief Technical Analyst, StockCharts.com
MDY AND QQQ EXTEND CONSOLIDATIONS... Link for today's video. The S&P Midcap SPDR (MDY) and the Nasdaq 100 ETF (QQQ) hit new 52-week highs in late October and then moved into tight consolidations the last seven to ten trading days. The new highs affirm the overall...
READ MORE
MEMBERS ONLY

IWM Breaks Down, but SPY and QQQ Hold Strong
by Arthur Hill,
Chief Technical Strategist, TrendInvestorPro.com
Stocks finally took a breather last week as small-caps led the correction. The Nasdaq 100 ETF (QQQ) and S&P 500 ETF (SPY) corrected with trading ranges, while the Russell 2000 ETF (IWM) corrected with a 2.13% decline. The sectors were mixed last week with the Finance SPDR...
READ MORE
MEMBERS ONLY
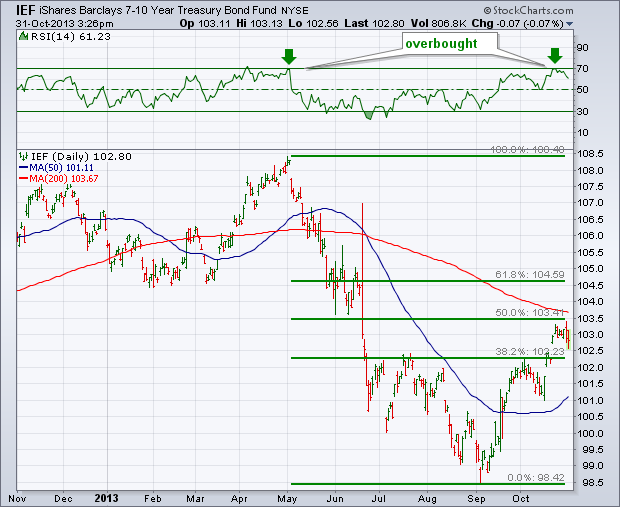
Bond Bounce is up Against Charts Resistance and Looks Overbought
by John Murphy,
Chief Technical Analyst, StockCharts.com
After selling off sharply between May and September, bond prices have been bouncing for the last two months. The bounce, however, has reached technical levels that may cap the rally. Chart 1 shows the 7-10 Year T Bond iShares (IEF) having retraced 50% of its previous downtrend. In addition, the...
READ MORE
MEMBERS ONLY
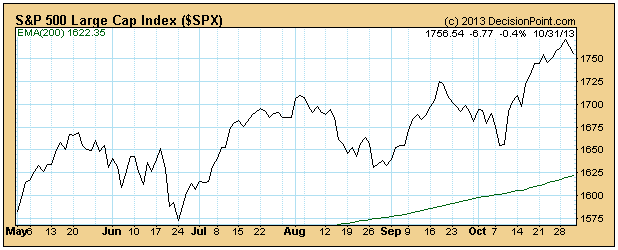
Positive Seasonality Period Begins

by Carl Swenlin,
President and Founder, DecisionPoint.com
Research published by Yale Hirsch in the Trader's Almanac shows that the market year is broken into two six-month seasonality periods. From May 1 through October 31 is seasonally unfavorable, and the market most often finishes lower than it was at the beginning of the period. From November...
READ MORE
MEMBERS ONLY
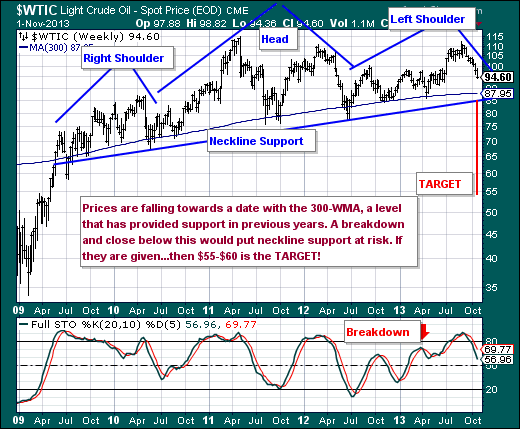
Head and Shoulders for Light Crude

by Richard Rhodes,
Founder and President, Rhodes Capital Management and Rhodes Trading Group
For the past 9-weeks, Crude Oil has weakened from $112/barrel to below $95/barrel. This is a rather sharp drop indeed, but the fact of the matter is that the fundamentals are bearish Crude Oil, and so is the techncial state of prices. Moreover, the technicals could very well...
READ MORE
MEMBERS ONLY
Warning Signs or Another Seasonal Rally Opportunity?

by Tom Bowley,
Chief Market Strategist, EarningsBeats.com
I've maintained a bullish stance throughout this bull market, but I have to admit I'm beginning to get a little nervous. As a stock market historian, it's difficult for me to think bearish thoughts as we enter November because November, December and January are...
READ MORE
MEMBERS ONLY
November is "Get Certified" Month at StockCharts.com!
Hello Fellow ChartWatchers!
October didn't live up to its fearsome repution this year. The major averages were all up somewhere between 2 and 4% for the month with the exception of the Russell 2000 (which was up only 0.7%). Will things stay in positive territory for November?...
READ MORE
