MEMBERS ONLY
Don't Fall for "Visual Coincidences" on Overlaid Charts
Hello Fellow ChartWatchers!
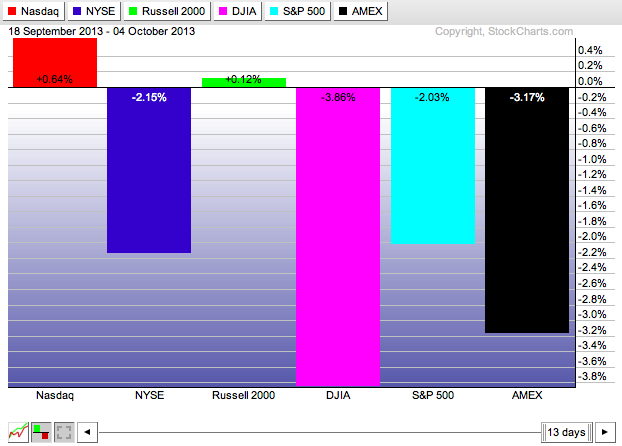
We have several bearish-sounding articles for you this week as several of the major markets continue moving lower. The Dow has been down 9 of the past 12 trading days and its chart reflects that decline. However all is not lost. There are still some positive developments...
READ MORE
MEMBERS ONLY
Time For Earnings Season

by Tom Bowley,
Chief Market Strategist, EarningsBeats.com
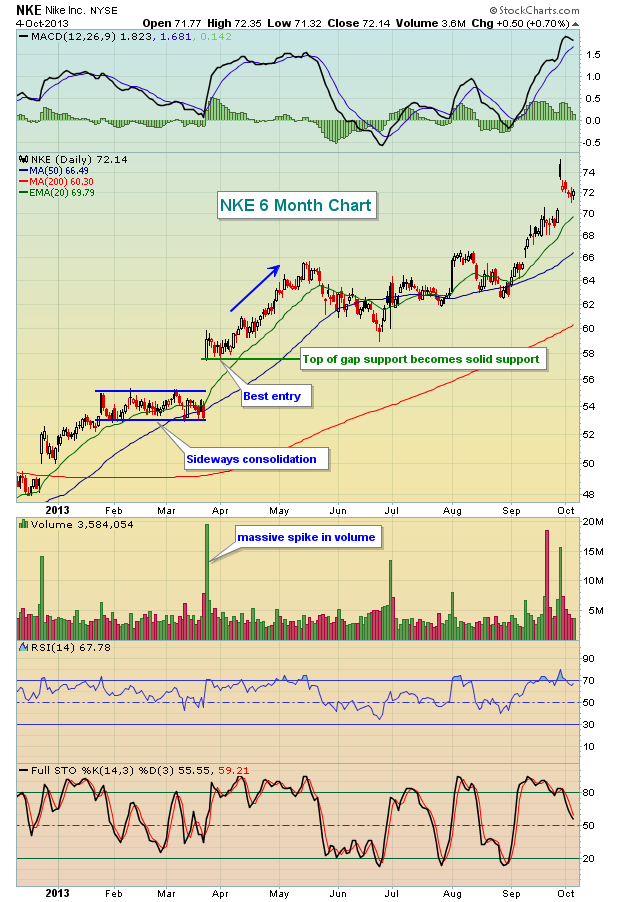
As a trader, this is my favorite time of each quarter. I love it when earnings begin to roll out because the increased volatility generally sets up excellent trading opportunities. In early April, I wrote about the strong earnings report that Nike (NKE) enjoyed in March and I highlighted a...
READ MORE
MEMBERS ONLY
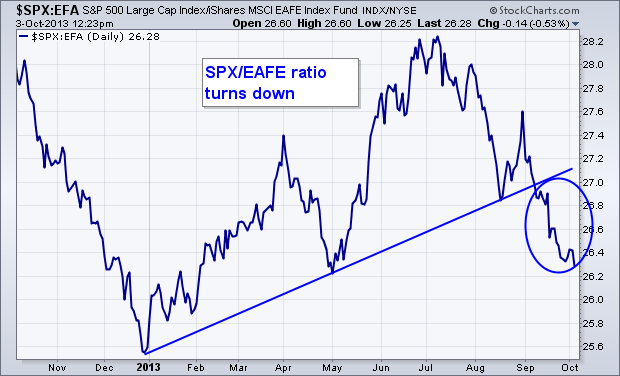
U.S. Stocks Weaken Versus Foreign Stocks

by John Murphy,
Chief Technical Analyst, StockCharts.com
My last message discussed how money was starting to rotate out of an over-extended U.S. stock market into foreign stocks which are trying to catch up to the U.S. market. This message will build on that theme by using ratio (or relative strength analysis). Chart 1 plots a...
READ MORE
MEMBERS ONLY
Rydex Ratio in the Danger Zone

by Carl Swenlin,
President and Founder, DecisionPoint.com
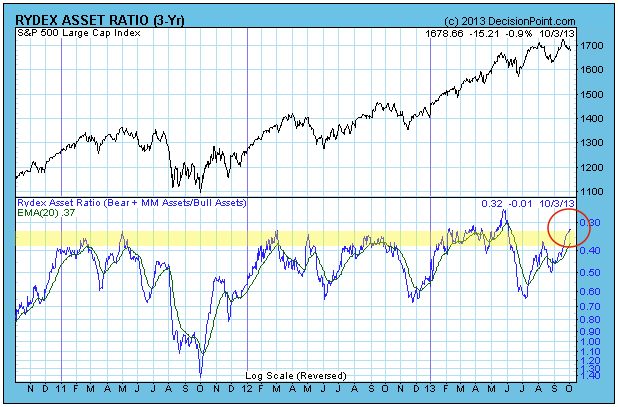
The Rydex Ratio has reached a level where it is telling us that sentiment is too bullish, and that stock prices are vulnerable.
The Rydex Ratio gives a view of sentiment extremes using using the totals of assets in Rydex mutual funds. It is calculated by dividing Money Market Assets...
READ MORE
MEMBERS ONLY
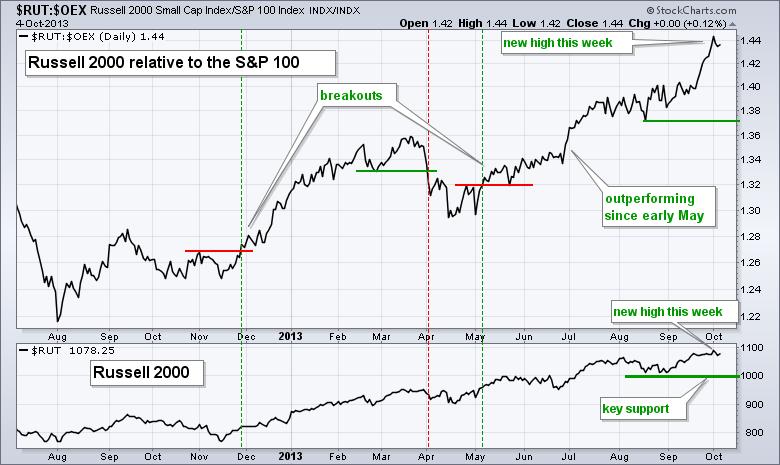
Relative Strength in Small-caps Supports the Current Bull Market

by Arthur Hill,
Chief Technical Strategist, TrendInvestorPro.com
The Russell 2000 ($RUT) and the Nasdaq ($COMPQ) are leading the relative performance game and this is positive for the stock market. The Russell 2000 represents small-caps and the Nasdaq represents the technology sector. Together, these two represent risk appetite because their stocks have higher betas, which translates into higher...
READ MORE
MEMBERS ONLY

Elder Impulse Bar Turns Green for the Networking iShares
by Arthur Hill,
Chief Technical Strategist, TrendInvestorPro.com
The Networking iShares (IGN) declined sharply in late September, but managed to hold above its prior low and keep the rising channel in place. With a big surge on Friday, the Elder Impulse bar turned green to signal an upturn in momentum. Also notice that the StockCharts Technical Rank (SCTR)...
READ MORE
MEMBERS ONLY

SPY CORRECTS WITH FALLING FLAG -- IWM AND QQQ ESTABLISH KEY LEVELS TO WATCH -- CONSUMER DISCRETIONARY LEADS AS FINANCE LAGS -- KEY BREADTH INDICATORS CONFIRM RECENT HIGHS -- OIL & GAS EQUIPMENT/SERVICES SPDR OUTPERFORMS CRUDE
by John Murphy,
Chief Technical Analyst, StockCharts.com
SPY CORRECTS WITH FALLING FLAG... Link for today's video. The S&P 500 ETF is lagging the Russell 2000 ETF and Nasdaq 100 ETF, but the long-term trend is up and the current decline looks like a correction. Chart 1 shows SPY hitting a new high in...
READ MORE
MEMBERS ONLY

Investment Lessons from the Archives

by Gatis Roze,
Author, "Tensile Trading"
“It matters not how strait the gait,
How charged with punishments the scroll,
I am the master of my fate,
I am the captain of my soul.”
Nelson Mandela was so inspired by the last stanza from William Henley’s famous poem Invictus that he had it written on a...
READ MORE
MEMBERS ONLY

New Highs in QQQ and IWM Counter Weakness in SPY
by Arthur Hill,
Chief Technical Strategist, TrendInvestorPro.com
The Dow Industrials SPDR and the S&P 500 ETF pulled back over the last two weeks, but the Nasdaq 100 ETF and Russell 2000 ETF held strong and hit new highs earlier this week. Relative strength in QQQ and IWM is more important than relative weakness in SPY...
READ MORE
MEMBERS ONLY

Momentum Weakens for IWM and QQQ - SPY Breaks Pennant
by Arthur Hill,
Chief Technical Strategist, TrendInvestorPro.com
Stocks moved lower with broad-based selling pressure on Thursday. Stocks just don't seem to know what they want. It seems as if the shutdown, continuing resolution and debt ceiling are snowballing into a grand bargain of sorts, which would be positive for the markets, long-term at least. The...
READ MORE
MEMBERS ONLY

Banks Underperform on Industry Group PerfChart
by Arthur Hill,
Chief Technical Strategist, TrendInvestorPro.com
The PerfChart below shows the performance for John Murphy's key industry groups over the past month. Eight of the nine are up, but the Banking Index ($BKX) is up the least and seriously underperforming. The Gold & Silver Index ($XAU) is down sharply.
Click this image for a...
READ MORE
MEMBERS ONLY

U.S. STOCKS ARE LOSING GROUND TO FOREIGN SHARES -- AN RSI ANALYSIS ALSO FAVORS FOREIGN STOCKS -- STOCK/BOND RATIO IS OVERBOUGHT AND STARTING TO WEAKEN -- STOCKS ARE WEAKENING VERSUS BONDS
by John Murphy,
Chief Technical Analyst, StockCharts.com
U.S. STOCKS WEAKEN VERSUS FOREIGN STOCKS... My last message discussed how money was starting to rotate out of an over-extended U.S. stock market into foreign stocks which are trying to catch up to the U.S. market. This message will build on that theme by using ratio (or...
READ MORE
MEMBERS ONLY

TLT Forms Falling Flag as SPY Consolidates with Pennant
by Arthur Hill,
Chief Technical Strategist, TrendInvestorPro.com
Stocks edged lower on Wednesday, but the losses were fairly muted. The Russell 2000 ETF (IWM) fell .41% and the S&P 500 ETF (SPY) declined just .09% on the day. The sectors were mixed with small gains and losses. The Regional Bank SPDR (KRE) showed relative weakness with...
READ MORE
MEMBERS ONLY
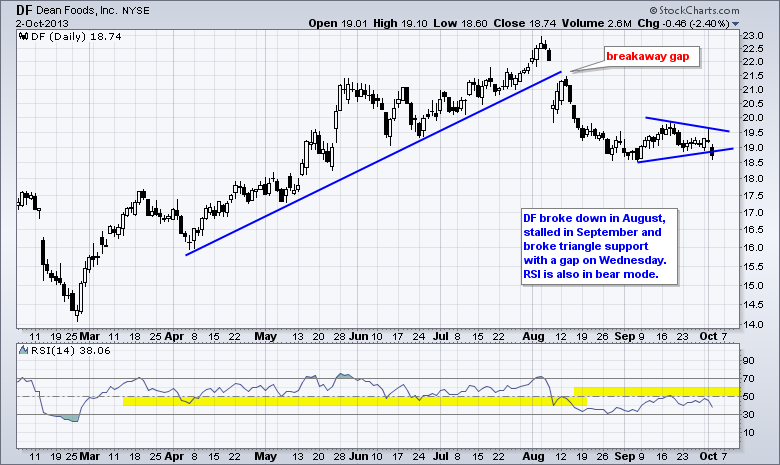
Charts of Interest: DF, FFIV, INFY, PFE, XRAY
by Arthur Hill,
Chief Technical Strategist, TrendInvestorPro.com
DF Breaks Triangle Support to Continue Downtrend.
FFIV Bounces off Breakout Zone.
Plus INFY, PFE, XRAY
Video is at top. Individual charts are below.
Click here for iPad/iPhone Version
**This chart analysis is for educational purposes only, and should not
be construed as a recommendation to buy, sell or...
READ MORE
MEMBERS ONLY

Chuy's Makes the MACD Scan with a Bullish Cross
by Arthur Hill,
Chief Technical Strategist, TrendInvestorPro.com
Chuy's Holdings (CHUY) is showing some promise with a bounce off support and bullish MACD cross. Notice that broken resistance turned into support in the 34 area and held from June to September. With the move above 37 this week, MACD moved above its signal line and momentum...
READ MORE
MEMBERS ONLY

SELLING PRESSURE HITS THE AEROSPACE-DEFENSE ETF -- LOCKHEED MARTIN AND RAYTHEON TEST 50-DAY MOVING AVERAGES -- RUSSELL 2000 AND NASDAQ LEAD STOCK MARKET -- UPSIDE MOMENTUM WANES FOR THE DOW INDUSTRIALS -- MARKING DOWNSWING RESISTANCE FOR THE DOW
by John Murphy,
Chief Technical Analyst, StockCharts.com
SELLING PRESSURE HITS THE AEROSPACE-DEFENSE ETF ... Link for today's video. Defense stocks are feeling a little heat today as the government shutdown extends and the debt ceiling looms. Chart 1 shows the Aerospace-Defense ETF (PPA) falling over 1% and testing broken resistance in the 27.27.4 area....
READ MORE
MEMBERS ONLY

IWM and QQQ Break to New Highs
by Arthur Hill,
Chief Technical Strategist, TrendInvestorPro.com
Theshut down was not enough to derail the first trading day of the month phenomenon. There has been a bullish bias on the first trading day of the month for years now. Managers accumulate funds during the month and then deploy them at the beginning of the next month. With...
READ MORE
MEMBERS ONLY

Marking Momentum Support for the Russell 2000 ETF
by Arthur Hill,
Chief Technical Strategist, TrendInvestorPro.com
The Russell 2000 ETF (IWM) surged to a new high with two long white candlesticks. Notice how the ETF opened weak on Monday and then moved higher and exceeded the September high. Also notice how StochRSI held support at .50 and moved back above .80 today. Chartists can now mark...
READ MORE
MEMBERS ONLY
IWM and QQQ Hold Support and Short-Term Uptrends
by Arthur Hill,
Chief Technical Strategist, TrendInvestorPro.com
**This chart analysis is for educational purposes only, and should not
be construed as a recommendation to buy, sell or sell-short said securities**
There is a lot of uncertainty in the market place right now and this means every little news bite could trigger a price swing. There will eventually...
READ MORE
MEMBERS ONLY
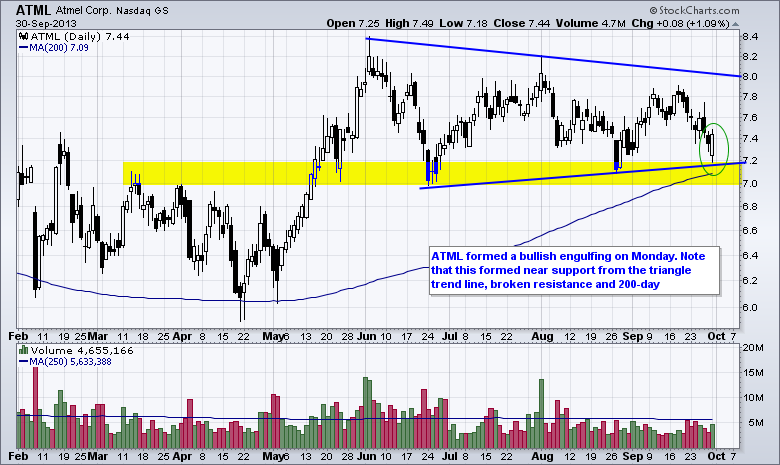
Charts of Interest: ATML, CREE, FLIR, LULU, VMC
by Arthur Hill,
Chief Technical Strategist, TrendInvestorPro.com
ATML Tests Support with Bullish Candlestick.
Broken Resistance Turns Support for CREE.
Plus FLIR, LULU, VMC
Video is at top. Individual charts are below.
**This chart analysis is for educational purposes only, and should not
be construed as a recommendation to buy, sell or sell-short said securities**
Click here for...
READ MORE
MEMBERS ONLY
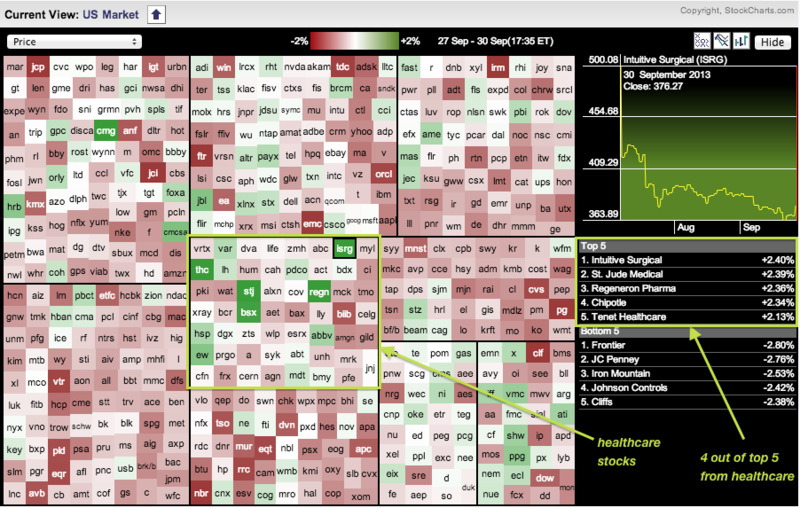
Sector Carpet Reveals Pockets of Strength within Healthcare
by Arthur Hill,
Chief Technical Strategist, TrendInvestorPro.com
The image below comes from today's sector Market Carpet. Notice that four of the top five performers in the S&P 500 come from the healthcare sector (ISRG, STJ, REGN and THC). All sectors were down on Monday, but Healthcare was the best performing sector because it...
READ MORE
MEMBERS ONLY

REVIEWING THE VOLATILITY OF AUGUST 2011 -- MARKING MOMENTUM SUPPORT FOR THE S&P 500 AND RUSSELL 2000 -- THESE THREE INDUSTRY GROUP ETFS HOLD THE KEY -- OIL BREAKS AUGUST LOWS -- VOLATILITY CONTRACTS ON THE YEN INDEX
by John Murphy,
Chief Technical Analyst, StockCharts.com
REVIEWING THE VOLATILITY OF AUGUST 2011... Link for today's video. The possible government shutdown is dominating the headlines today, but gridlock could dominate for several weeks because the debt ceiling is next on the agenda. Even though the market is well aware of the situation in Washington, there...
READ MORE
MEMBERS ONLY
Short-term Uptrends Challenged as Shutdown Looms
by Arthur Hill,
Chief Technical Strategist, TrendInvestorPro.com
**This chart analysis is for educational purposes only, and should not
be construed as a recommendation to buy, sell or sell-short said securities**
Stock futures are trading sharply lower as the first government shut down in 17 years looms on the horizon. This little shutdown charade is not the only...
READ MORE
MEMBERS ONLY

GERMANY LEADS EUROPE HIGHER -- A STRONGER EURO IS ALSO HELPING -- VANGUARD EUROPEAN ETF IS A GOOD WAY TO BUY EUROPE -- FALLING YEN HAS MADE JAPAN WORLD'S STRONGEST MARKET OVER LAST YEAR
by John Murphy,
Chief Technical Analyst, StockCharts.com
GERMAN DAX HITS NEW RECORD -- GERMANY ISHARES ALSO BREAKOUT... Europe has been emerging as one of the world's stock market leaders. A lot of that has to do with strength in Germany which is the region's biggest economy. The last week's impressive victory...
READ MORE
MEMBERS ONLY
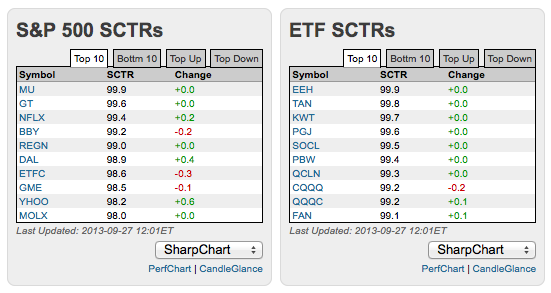
Top Up and Top Down SCTRs Highlight the Big Movers
by Arthur Hill,
Chief Technical Strategist, TrendInvestorPro.com
Looking for the relative movers and shakers in the market? Look no further than the StockCharts Technical Rank (SCTR) on the StockCharts home page. These tables can be found mid way down the home page. Today we can see Nasdaq OMX (NDAQ), Regions Financial (RF) and Microsoft (MSFT) showing relative...
READ MORE
MEMBERS ONLY

IWM AND QQQ STALL AFTER MARKET LEADING SURGES -- AUTOS AND AIRLINES LEAD INDUSTRY GROUPS -- NASDAQ AND SMALL-CAPS SHOW RELATIVE STRENGTH -- BEARISH DIVERGENCES FORM IN BREADTH INDICATORS FOR XLE -- AD LINE FOR GOLD MINERS EXTENDS DOWNTREND
by John Murphy,
Chief Technical Analyst, StockCharts.com
IWM AND QQQ STALL AFTER MARKET LEADING SURGES... Link for today's video. While there could be some short-term headwinds for the stock market, the long-term picture remains positive with new highs in the major index ETFs this month and leadership from key groups. New highs occur in uptrends,...
READ MORE
MEMBERS ONLY

How a DNA Transfusion Totally Transformed My Investing
by Gatis Roze,
Author, "Tensile Trading"
Over 20 years ago, I had a pivotal year as an investor with a seismic shift in my performance. Some might call it a personal passage or a transmutation. In reality, it was more like an impeccable conversion or DNA transfusion.
You see, I was a numbers guy. I would...
READ MORE
MEMBERS ONLY

Small Caps and Nasdaq Lead the Market Higher
by Arthur Hill,
Chief Technical Strategist, TrendInvestorPro.com
**This chart analysis is for educational purposes only, and should not
be construed as a recommendation to buy, sell or sell-short said securities**
There is no change in the indicator table. All indicators remain in bull mode as the market remains strong. The Nasdaq AD Line and AD Volume Line...
READ MORE
MEMBERS ONLY

S&P 1500 AD Line Bounces to Establish Short-Term Support
by Arthur Hill,
Chief Technical Strategist, TrendInvestorPro.com
**This chart analysis is for educational purposes only, and should not
be construed as a recommendation to buy, sell or sell-short said securities**
The major index ETFs managed to eek out another gain with the Nasdaq 100 ETF (QQQ) leading the way (+.78%). Yahoo! (YHOO), Ebay (EBAY) and Bed Bath...
READ MORE
MEMBERS ONLY

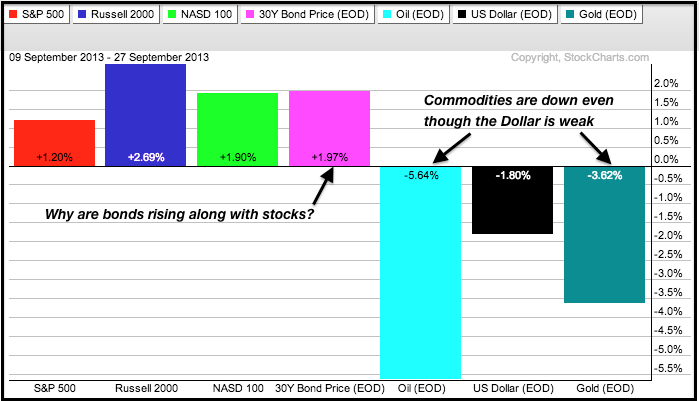
A September Surprise in Inter-market Correlations
by Arthur Hill,
Chief Technical Strategist, TrendInvestorPro.com
The PerfChart below shows six inter-market related ETFs. Notice that stocks are up with the Russell 2000 ETF (IWM) leading the way (blue). Bonds are also up for the month and this is strange because stocks and bonds are usually negatively correlated. On the other side, notice that gold, oil...
READ MORE
MEMBERS ONLY
A September Surprise in Inter-market Correlations (video)
by Arthur Hill,
Chief Technical Strategist, TrendInvestorPro.com
The PerfChart below shows six inter-market related ETFs. Notice that stocks are up with the Russell 2000 ETF (IWM) leading the way (blue). Bonds are also up for the month and this is strange because stocks and bonds are usually negatively correlated. On the other side, notice that gold, oil...
READ MORE
MEMBERS ONLY

IWM Shows Relative Strength as SPY Tests Support
by Arthur Hill,
Chief Technical Strategist, TrendInvestorPro.com
**This chart analysis is for educational purposes only, and should not
be construed as a recommendation to buy, sell or sell-short said securities**
Stocks edged lower with relatively mild selling pressure. The S&P 500 ETF (SPY) fell .26% and the Nasdaq 100 ETF (QQQ) lost .34% on the...
READ MORE
MEMBERS ONLY

Charts of Interest: AA, ATVI, IMMR, SCHL, SLW, SYMC
by Arthur Hill,
Chief Technical Strategist, TrendInvestorPro.com
AA gets a Throwback to Broken Resistance.
ATVI Underperforms in September.
Plus IMMR, SCHL, SLW, SYMC
Video is at top. Individual charts are below.
**This chart analysis is for educational purposes only, and should not
be construed as a recommendation to buy, sell or sell-short said securities**
Click here for...
READ MORE
MEMBERS ONLY

Autozone Breaks Out of Bollinger Band Contraction (video)
by Arthur Hill,
Chief Technical Strategist, TrendInvestorPro.com
Autozone (AZO) surged off support and broke above the upper Bollinger Band with big volume on Wednesday. I found this stock because it made the predefined scans list (intraday). This move affirms support and opens the door for a continuation of the bigger uptrend.
Click this image for a live...
READ MORE
MEMBERS ONLY

CHEMICAL STOCKS LEAD MATERIALS SECTOR -- EXXONMOBIL AND HALLIBURTON WEIGH ON THE ENERGY SPDR -- XOM BREAKS TREND LINE AS RSI TURNS DOWN -- MARKET CARPET HIGHLIGHTS RECENT UTILITY LEADERS -- UTILITIES SPDR HOLDS SHORT-TERM BREAKOUT
by John Murphy,
Chief Technical Analyst, StockCharts.com
CHEMICAL STOCKS DRIVE THE MATERIALS SECTOR... Link for today's video. Know thy sector SPDR. When trading or investing in the nine sector SPDRs, it is important to know the top components because the top ten stocks in each sector account for over 40% of the sector's...
READ MORE
MEMBERS ONLY

ALTHOUGH FALLING DOLLAR IS GOOD FOR GOLD, GOLD NEEDS TO RISE AGAINST ALL CURRENCIES TO RESUME ITS BULL TREND -- DOW/GOLD RATIO NOW FAVORS STOCKS FOR FIRST TIME IN A DECADE -- FALLING GOLD/COPPER RATIO IMPLIES ECONOMIC OPTIMISM
by John Murphy,
Chief Technical Analyst, StockCharts.com
FALLING DOLLAR IS GOOD FOR GOLD... During the Stockcharts' New York seminar over the weekend, we got into a discussion of gold. One of the attendees asked why I remained negative on gold's long term trend in the face of a declining dollar. I responded that there...
READ MORE
MEMBERS ONLY

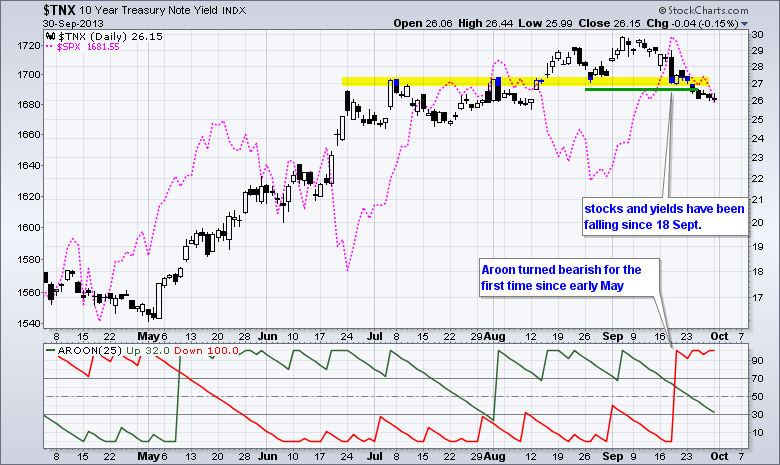
Surging Treasuries Could Weigh on Stocks
by Arthur Hill,
Chief Technical Strategist, TrendInvestorPro.com
Stocks were mixed on Tuesday with the Russell 2000 ETF (IWM) gaining ground, the Dow SPDR (DIA) loosing ground and the S&P 500 ETF (SPY) closing flat. Relative weakness in finance, technology and healthcare weighed on the market. Homebuilders offered a bright spot as the Home Construction iShares...
READ MORE
MEMBERS ONLY

Netflix Hits New High, but Forms Bearish Reversal Pattern (video)
by Arthur Hill,
Chief Technical Strategist, TrendInvestorPro.com
Netflix opened at a new on Monday, but selling pressure quickly took hold and drove prices below 203 by the close. This intraday reversal forged a bearish engulfing pattern just above first support. Follow through below last week's low would argue for a deeper correction towards the 260-270...
READ MORE
MEMBERS ONLY

SPY Gives Up Wednesday's Gain as TLT Breaks Out
by Arthur Hill,
Chief Technical Strategist, TrendInvestorPro.com
**This chart analysis is for educational purposes only, and should not
be construed as a recommendation to buy, sell or sell-short said securities**
Stocks were mostly lower on Monday with the finance sector weighing on the broader market. The Finance SPDR (XLF) fell 1.42% and the Regional Bank SPDR...
READ MORE
MEMBERS ONLY

Charts of Interest: ARUN, CLF, DE, GLW, NFLX
by Arthur Hill,
Chief Technical Strategist, TrendInvestorPro.com
$ARUN Shows Relative Weakness with Support Break.
$CLF Forms Trio of Bearish Candlestick Patterns.
Plus $DE, $GLW, $NFLX
Video is at top. Individual charts are below.
**This chart analysis is for educational purposes only, and should not
be construed as a recommendation to buy, sell or sell-short said securities**
Click...
READ MORE
