MEMBERS ONLY

FOREIGN STOCKS LEAD U.S. MARKET HIGHER -- EMERGING MARKET ISHARES REACH THREE-MONTH HIGH -- STRONG UPTURN IN CHINESE STOCKS GIVES BOOST TO MATERIALS -- INDEX OF CYLICAL STOCKS HITS NEW RECORD -- END OF STOCK CORRECTION SIGNALLED BY 13-YEAR HIGH IN NASDAQ

by John Murphy,
Chief Technical Analyst, StockCharts.com
FOREIGN STOCKS LEAD US HIGHER -- EEM BREAKOUT... In a role reversal from the first half of the year, foreign stocks are leading U.S. stocks higher. Chart 1 shows EAFE iShares (EFA) gapping to a new three-month high today and on the verge of the highest close in five...
READ MORE
MEMBERS ONLY
QQQ Leads with New High - ITB Challenges Support Break

by Arthur Hill,
Chief Technical Strategist, TrendInvestorPro.com
**This chart analysis is for educational purposes only, and should not
be construed as a recommendation to buy, sell or sell-short said securities**
The bulls got into gear on Monday and pushed stocks higher across the board. The Russell 2000 ETF (IWM) led the major index ETFs with a 1....
READ MORE
MEMBERS ONLY
Charts of Interest: ALK, AZO, GE, MHK, SXT
by Arthur Hill,
Chief Technical Strategist, TrendInvestorPro.com
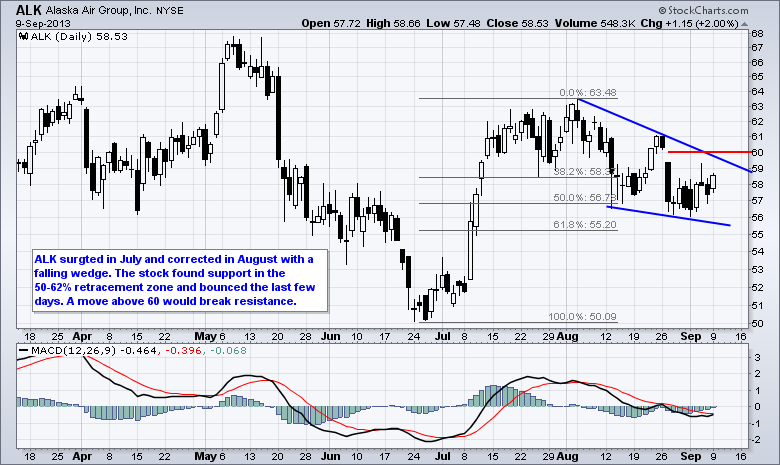
ALK Corrects with Falling Wedge.
AZO Lags the Market with Flat Flag.
Plus GE, MHK, SXT.
Video is at top. Individual charts are below.
**This chart analysis is for educational purposes only, and should not
be construed as a recommendation to buy, sell or sell-short said securities**
Click here for...
READ MORE
MEMBERS ONLY

In Honor of Joe Granville; Volume May Lead Price for BAC
by Arthur Hill,
Chief Technical Strategist, TrendInvestorPro.com
Bank of America (BAC) hit a 52-week high in late July and then corrected with a falling flag or channel the last five weeks. Despite this correction, the indicator window shows On Balance Volume (OBV) remaining strong and hitting a new high last week. This suggests that BAC is still...
READ MORE
MEMBERS ONLY

XLB SHOWS LEADERSHIP WITH FLAG BREAKOUT -- METALS AND COPPER MINING ETFS PACE GAINS -- XLE CHALLENGES HIGHS WITH BULLISH CONTINUATION PATTERN -- SHANGHAI COMPOSITE EXTENDS UPSWING WITH BIG SURGE -- NIKKEI CHALLENGES TRIANGLE TREND LINE
by John Murphy,
Chief Technical Analyst, StockCharts.com
XLB SHOWS LEADERSHIP WITH FLAG BREAKOUT... Link for today's video. Strength in Asia markets, which are covered below, is providing a lift to the materials sector and related industry groups. Chart 1 shows the Basic Materials SPDR (XLB) breaking above flag resistance with a surge the last six...
READ MORE
MEMBERS ONLY

SPY and IWM Extend Bounces and Near Resistance
by Arthur Hill,
Chief Technical Strategist, TrendInvestorPro.com
**This chart analysis is for educational purposes only, and should not
be construed as a recommendation to buy, sell or sell-short said securities**
Stocks started September with strength as the Nasdaq 100 ETF (QQQ) and the Russell 2000 ETF (IWM) advance around 2% in a shortened week. All sectors were...
READ MORE
MEMBERS ONLY
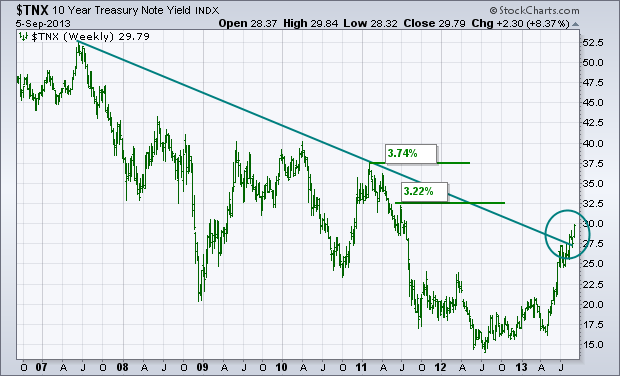
Bond Yield Reaches New Two-Year High
by John Murphy,
Chief Technical Analyst, StockCharts.com
The weekly bars in Chart 1 show the 10-Year Treasury Note Yield ($TNX) reaching a new two-year high today and very close to breaching the psychologally important 3% barrier for the first time since early 2011. The TNX has also cleared a five-year resistance line extending back to 2007 (see...
READ MORE
MEMBERS ONLY
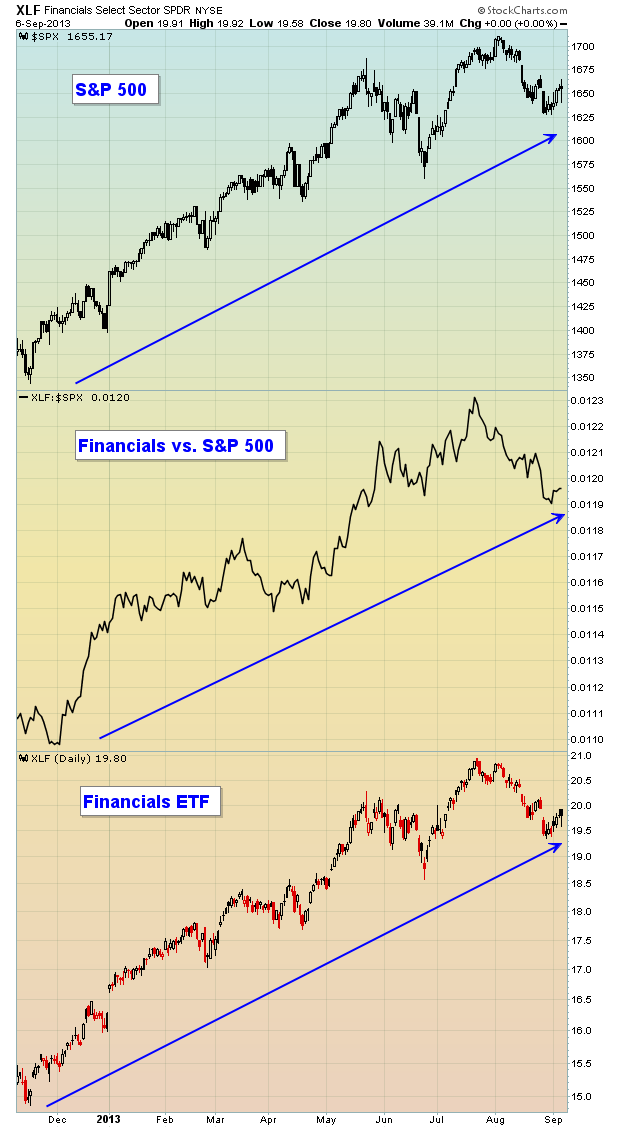
Financials Suggesting This Bull Market Is FAR From Over

by Tom Bowley,
Chief Market Strategist, EarningsBeats.com
The past 5-6 weeks have not been overly kind to the bulls. In fact, since topping at 1709.67 at the close on August 2nd, the S&P 500 has lost more than 50 points or roughly 3%. Many are calling for the end of the four and a...
READ MORE
MEMBERS ONLY

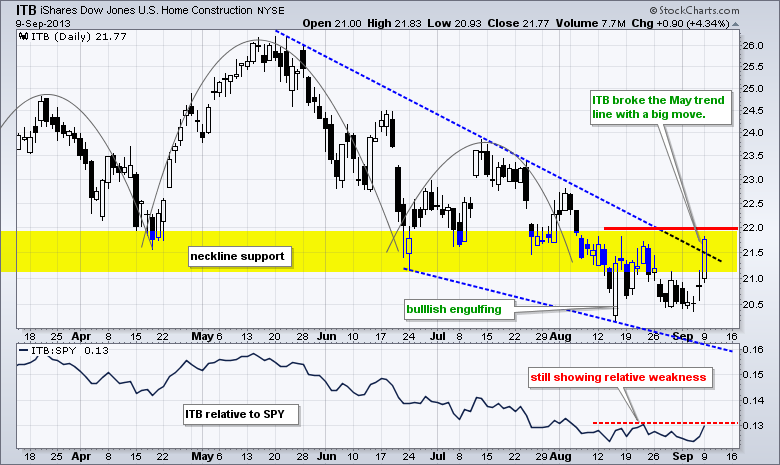
Home Construction iShares Bounces, but Remains Short of Breakout
by Arthur Hill,
Chief Technical Strategist, TrendInvestorPro.com
Treasury yields fell after Friday's jobs report and interest rate sensitive stocks got a bounce as utilities, REITs and homebuilders moved higher. My focus is on the Home Construction iShares (ITB) because this group is important to the consumer discretionary sector and housing is key to the overall...
READ MORE
MEMBERS ONLY
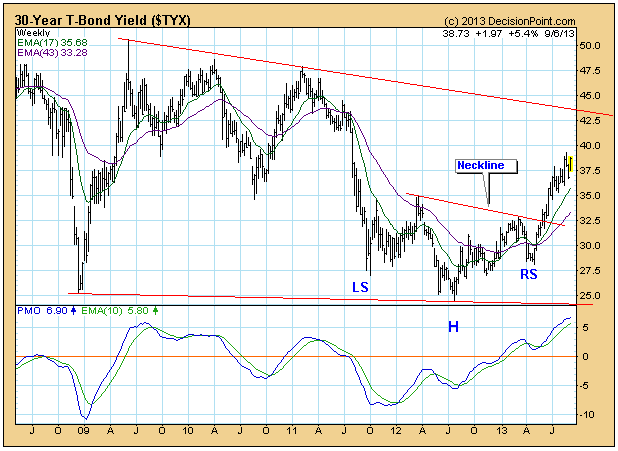
Bond Yield Very Overbought

by Carl Swenlin,
President and Founder, DecisionPoint.com
We have been observing how, in spite of the Fed's efforts, bond yields have been persistently rising, but now they have become very overbought.
On the weekly bar chart, we can see how a reverse head and shoulders pattern is in progress and yield is headed toward a...
READ MORE
MEMBERS ONLY
I Didn't Know StockCharts Could Do That!
Hello Fellow ChartWatchers!
Things are heating up in the markets now that we are past the Labor Day holiday and people are returning from their vacations. Currently the market averages appear to be driven largely by news (Syria, G20, etc.) but that should change soon as the Fed clarifies its...
READ MORE
MEMBERS ONLY

Walgreen Forms Inverse Head-and-shoulders Pattern
by Arthur Hill,
Chief Technical Strategist, TrendInvestorPro.com
After a big surge from November to May, Walgreen (WAG) consolidated with an inverse head-and-shoulders pattern. This version of the head-and-shoulders is a bullish continuation pattern. Also notice that the pattern from mid June to September looks like a cup-with-handle. A breakout at 51 would confirm and signal a continuation...
READ MORE
MEMBERS ONLY

HOMEBUILDER ETF BOUNCES, BUT REMAINS SHORT OF BREAKOUT -- FINANCE AND CONSUMER DISCRETIONARY SPDRS CHALLENGE THE GAPS -- NASDAQ 100 AD VOLUME LINE HITS NEW HIGH -- ISM NEW ORDERS INDICES POINT TO STRONG ECONOMY
by John Murphy,
Chief Technical Analyst, StockCharts.com
HOMEBUILDER ETF BOUNCES, BUT REMAINS SHORT OF BREAKOUT - USG GAPS UP... Link for today's video. Treasury yields fell after Friday's jobs report and interest rate sensitive stocks got a bounce as utilities, REITs and homebuilders moved higher. In particular, I would like to focus on...
READ MORE
MEMBERS ONLY

Tensile Trading: Stage #6 Stalking for Winning Investment Ideas

by Gatis Roze,
Author, "Tensile Trading"
Let’s get this out on the table first off. Stock market stalking is analogous to a lion stalking prey, not the paparazzi stalking a movie star. As investors, we’ll embrace the watchful, persistent and focused part of the definition, and we’ll toss the pester, frighten and harass...
READ MORE
MEMBERS ONLY

Techs Lead as Nasdaq AD Volume Line Hits New High
by Arthur Hill,
Chief Technical Strategist, TrendInvestorPro.com
There is no change in the indicator table. Relative weakness in interest rate sensitive stocks is weighing on the NYSE as the NYSE AD Line and NYSE Net New Highs lag their Nasdaq counterparts. Stocks remain in corrective mode, but there are clear pockets of strength out there. Notice that...
READ MORE
MEMBERS ONLY

10 Year Yield Approaches 3% - UUP Builds on Breakout
by Arthur Hill,
Chief Technical Strategist, TrendInvestorPro.com
**This chart analysis is for educational purposes only, and should not
be construed as a recommendation to buy, sell or sell-short said securities**
Stocks edged higher with techs leading the way again. The Nasdaq 100 Equal-Weight ETF (QQEW) advanced .49%, but the S&P 500 ETF (SPY) advanced just...
READ MORE
MEMBERS ONLY

Steel ETF Challenges 200-day Moving Average
by Arthur Hill,
Chief Technical Strategist, TrendInvestorPro.com
The Steel ETF (SLX) is making some noise with a break above the flag trend line and challenge to the 200-day SMA. This moving average flattened just below resistance, which extends back to the May highs. With the 50-day turning up, price action is looking bullish and a flag breakout...
READ MORE
MEMBERS ONLY

BOND YIELDS REACHING NEW RECOVERY HIGH IS A SIGN OF ECONOMIC OPTIMISM -- THAT'S WHY ECONOMICALLY-SENSITIVE CYCLICAL STOCKS ARE OUTPERFORMING CONSUMER STOCKS -- AUTOS CONTINUE TO SHOW MARKET LEADERSHIP AS FORD NEARS MAJOR BULLISH BREAKOUT
by John Murphy,
Chief Technical Analyst, StockCharts.com
BOND YIELD REACHES NEW TWO-YEAR HIGH... The weekly bars in Chart 1 show the 10-Year Treasury Note Yield ($TNX) reaching a new two-year high today and very close to breaching the psychologally important 3% barrier for the first time since early 2011. The TNX has also cleared a five-year resistance...
READ MORE
MEMBERS ONLY

Techs Lead as QQQ Bounces off Support - USO Forms Wedge
by Arthur Hill,
Chief Technical Strategist, TrendInvestorPro.com
**This chart analysis is for educational purposes only, and should not
be construed as a recommendation to buy, sell or sell-short said securities**
Techs took the lead on Wednesday with semiconductor and networking stocks scoring nice gains. The Nasdaq 100 ETF (QQQ) relative strength with a 1% gain, while the...
READ MORE
MEMBERS ONLY

Charts of Interest: AKAM, BHI, CME, EXPD, NBR, VMC
by Arthur Hill,
Chief Technical Strategist, TrendInvestorPro.com
AKAM Forms Cup-with-handle Pattern.
BHI Challenges Wedge Resistance.
Plus CME, EXPD, NBR, VMC
Video is at top. Individual charts are below.
**This chart analysis is for educational purposes only, and should not
be construed as a recommendation to buy, sell or sell-short said securities**
Click here for iPad/iPhone Version...
READ MORE
MEMBERS ONLY

Altera Leads Semis with Rim Breakout
by Arthur Hill,
Chief Technical Strategist, TrendInvestorPro.com
Altera (ALTR) is showing upside leadership with a breakout and 52-week high on good volume. Overall, the pattern at work looks like a cup-with-handle, which is a bullish pattern. The rim breakout completes the pattern and argues for higher prices. Broken resistance turns first support to watch on a throwback....
READ MORE
MEMBERS ONLY

SPY CHALLENGES GAP ZONE AND FIRST RESISTANCE -- INTERNET ETF AND SOLAR ETF SHOW RELATIVE STRENGTH -- SEMICONDUCTOR SPDR CHALLENGES WEDGE RESISTANCE -- INTEL LEADS MARKET VECTORS SEMICONDUCTOR ETF -- THREE SECTOR AD LINES SHOW RELATIVE STRENGTH
by John Murphy,
Chief Technical Analyst, StockCharts.com
SPY CHALLENGES GAP ZONE AND FIRST RESISTANCE... Link for today's video. The major index ETFs remain in short-term downtrends since early August and long-term uptrends since mid November. This short-term downtrend is a correction that is entering its fifth week and marks the third correction of the year....
READ MORE
MEMBERS ONLY

Stocks Hit with Pop and Drop as Early Gains Fade
by Arthur Hill,
Chief Technical Strategist, TrendInvestorPro.com
**This chart analysis is for educational purposes only, and should not
be construed as a recommendation to buy, sell or sell-short said securities**
Stocks got the old pop and drop on Monday. The major index ETFs opened higher on the heels of Asian and European strength. It was also the...
READ MORE
MEMBERS ONLY

Utilities SPDR Breaks Pennant Support
by Arthur Hill,
Chief Technical Strategist, TrendInvestorPro.com
The Utilities SPDR (XLU) broke down as the 10-year Treasury Yield ($TNX) moved back above 2.8% on Monday. XLU was already in a downtrend after the lower high in July and mid August breakdown. After stalling with a pennant, the ETF broke pennant support to signal a continuation lower....
READ MORE
MEMBERS ONLY

FOREIGN STOCK ETFS CATCH UP TO MONDAY'S GAINS -- CHINA AND JAPAN ARE BIGGEST FOREIGN GAINERS -- U.S. STOCKS START WEEK ON AN UPNOTE -- BOND YIELDS CONTINUE TO GAIN AS BOND PRICES DROP
by John Murphy,
Chief Technical Analyst, StockCharts.com
EAFE ISHARES GAP HIGHER... The rest of the world rallied on Monday while the U.S. was closed for Labor Day. Foreign stock ETFs (which were also closed on Monday) are playing catch-up today to yesterday's gains. Chart 1 shows EAFE iShares (EFA) gapping more than 2% higher...
READ MORE
MEMBERS ONLY

SPY and QQQ Test Support Zones
by Arthur Hill,
Chief Technical Strategist, TrendInvestorPro.com
**This chart analysis is for educational purposes only, and should not
be construed as a recommendation to buy, sell or sell-short said securities**
It is the beginning of the month and stock futures are trading sharply higher this morning. The German DAX Index ($DAX) was up 1.74% on Monday,...
READ MORE
MEMBERS ONLY

Charts of Interest: ESRX, LINTA, SCCO, SCHL, SCHW
by Arthur Hill,
Chief Technical Strategist, TrendInvestorPro.com
ESRX Corrects with Falling Wedge.
LINTA Firms at Support Zone
Plus SCCO, SCHL, SCHW
Video at end of commentary
**This chart analysis is for educational purposes only, and should not
be construed as a recommendation to buy, sell or sell-short said securities**
Click here for iPad/iPhone Version
This commentary...
READ MORE
MEMBERS ONLY

DOLLAR BOUNCE CAUSES PROFIT-TAKING IN OVERBOUGHT COMMODITIES -- US STOCKS REMAIN IN DOWNSIDE CORRECTION -- FOREIGN STOCKS ALSO WEAKEN -- CHINESE STOCKS SHOW RELATIVE STRENGTH -- BRAZIL STOCKS AND CURRENCY ARE TUMBLING TOGETHER
by John Murphy,
Chief Technical Analyst, StockCharts.com
DOLLAR BOUNCES OFF CHART SUPPORT AS EURO WEAKENS... Last Saturday's message showed the U.S. Dollar Index (USD) testing important chart support at its June low. Chart 1 shows the USD rising to a three week high. That's not enough to signal a major upturn, but...
READ MORE
MEMBERS ONLY

Gold Miners ETF Forms Big Bearish Engulfing
by Arthur Hill,
Chief Technical Strategist, TrendInvestorPro.com
The Gold Miners ETF (GDX) came under intense selling pressure earlier this week with a bearish engulfing and short-term support break. These two down days occurred on high volume. Also notice that the ETF is hitting resistance from the highs extending back to late April.
Click this image for a...
READ MORE
MEMBERS ONLY

HOW MUCH CORRECTION CAN WE EXPECT FROM SPY AND IWM? -- GAPS REMAIN IN THE CONSUMER DISCRETIONARY SPDR -- WEAKNESS IN RETAIL AND HOUSING WEIGHS ON MARKET -- METALS & MINING SPDR HITS BIG RESISTANCE ZONE -- GOLD HITS FIBONACCI CLUSTER
by John Murphy,
Chief Technical Analyst, StockCharts.com
HOW MUCH CORRECTION CAN WE EXPECT FROM SPY AND IWM?... Link for today's video. The S&P 500 ETF (SPY) extended its correction with the third weekly decline in four weeks. Even though the bigger trend is still up, this correction could extend in both price and...
READ MORE
MEMBERS ONLY

5 Rules for a Great Vacation
by Gatis Roze,
Author, "Tensile Trading"
What do screensavers look like for people who actually live in Hawaii? That’s a question I’ll ask next time I go there on vacation. On the topic of vacations, as an investor / trader, how do you approach this challenge? Markets don’t close when you go to Disneyland....
READ MORE
MEMBERS ONLY

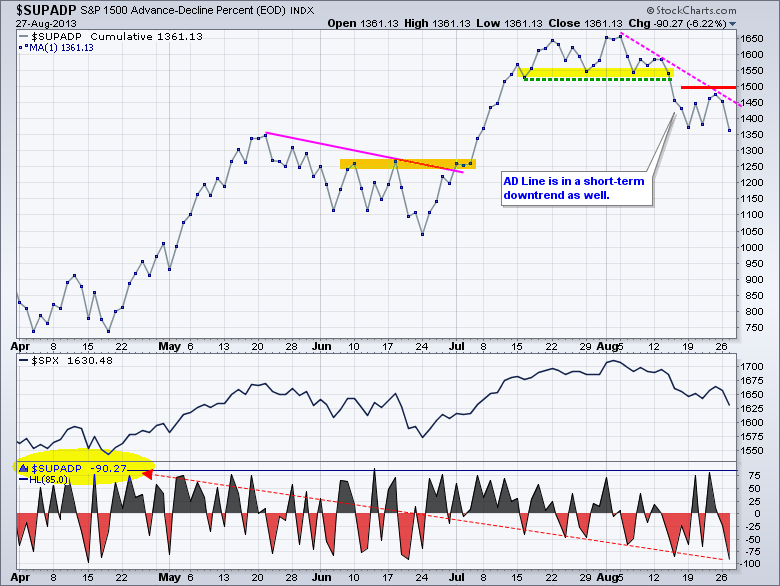
Evidence Remains Bullish, but Pockets of Weakness Remain
by Arthur Hill,
Chief Technical Strategist, TrendInvestorPro.com
August was not a nice month for stocks. The S&P 500 is on schedule to post its biggest monthly loss since May 2012. Even though the overall trend is up and the bulk of the evidence remains bullish, I get the feeling that this correction could extend because...
READ MORE
MEMBERS ONLY

Stocks Firm in Mixed Action - Dollar Goes for a Breakout
by Arthur Hill,
Chief Technical Strategist, TrendInvestorPro.com
**This chart analysis is for educational purposes only, and should not
be construed as a recommendation to buy, sell or sell-short said securities**
Market action was mixed on Thursday with the Russell 2000 ETF (IWM) advancing around 1% and the S&P 500 ETF (SPY) advancing just .24%. Large-caps...
READ MORE
MEMBERS ONLY

Airlines, Telecoms and Biotech Lead Essential Industry Groups
by Arthur Hill,
Chief Technical Strategist, TrendInvestorPro.com
Extra! and Pro users have access to the StockCharts Essentials ChartPack, which features 13 core chartlists with over 140 key charts. The image below shows the Essential US Industry Indexes in "summary" format and sorted by percent change. This makes it easy to distinguish between the leaders and...
READ MORE
MEMBERS ONLY

SPY Hits Top of Support Zone - UUP Consolidates at Support
by Arthur Hill,
Chief Technical Strategist, TrendInvestorPro.com
**This chart analysis is for educational purposes only, and should not
be construed as a recommendation to buy, sell or sell-short said securities**
Stocks got an oversold bounce on Wednesday, but the short-term trends remain down and this correction is likely to extent. The Nasdaq 100 ETF (QQQ) led the...
READ MORE
MEMBERS ONLY

Charts of Interest: ARMH, AVGO, BBBY, CTSH, TIBX
by Arthur Hill,
Chief Technical Strategist, TrendInvestorPro.com
ARMH Firms with Potential Triangle Forming.
AVGO Breaks Flag Resistance with Volume.
Plus BBBY, CTSH, TIBX
Video at end of commentary
**This chart analysis is for educational purposes only, and should not
be construed as a recommendation to buy, sell or sell-short said securities**
Click here for iPad/iPhone Version...
READ MORE
MEMBERS ONLY

Leveraged Gold ETFs Duke it Out on Ticker Cloud
by Arthur Hill,
Chief Technical Strategist, TrendInvestorPro.com
Want to see what's hot today? Check out the ticker cloud on the home page. The bigger the symbol, the more popular the chart. As you can see, the Direxion Gold Miners Bull 3X ETF (NUGT) and the Direxion Gold Miners Bear 3X ETF (DUST) are quite popular...
READ MORE
MEMBERS ONLY

SEMICONDUCTOR SPDR BOUNCES WITHIN FALLING WEDGE -- KEY SECTORS REMAIN IN SHORT-TERM DOWNTRENDS -- TWO SHOOTING STARS AND TWO GAPS FOR XLB -- COPPER HITS RESISTANCE AS ISHARES BRIC ETF TURNS LOWER -- LUMBER PRICES FAIL AT RESISTANCE AND TURN DOWN
by John Murphy,
Chief Technical Analyst, StockCharts.com
SEMICONDUCTOR SPDR BOUNCES WITHIN FALLING WEDGE... Link for today's video. Stocks are rebounding today with the Semiconductor SPDR (XSD) leading the way. Chart 1 shows XSD finding support near broken resistance in the 54 area. Despite today's move, the ETF remains in a short-term downtrend that...
READ MORE
MEMBERS ONLY
Broad Based Decline Produces 90% Down Day
by Arthur Hill,
Chief Technical Strategist, TrendInvestorPro.com
**This chart analysis is for educational purposes only, and should not
be construed as a recommendation to buy, sell or sell-short said securities**
It was a good old fashion flight to safety on Tuesday. Stocks moved broadly lower, while the safe havens moved higher. The 20+ Year T-Bond ETF (TLT)...
READ MORE
MEMBERS ONLY
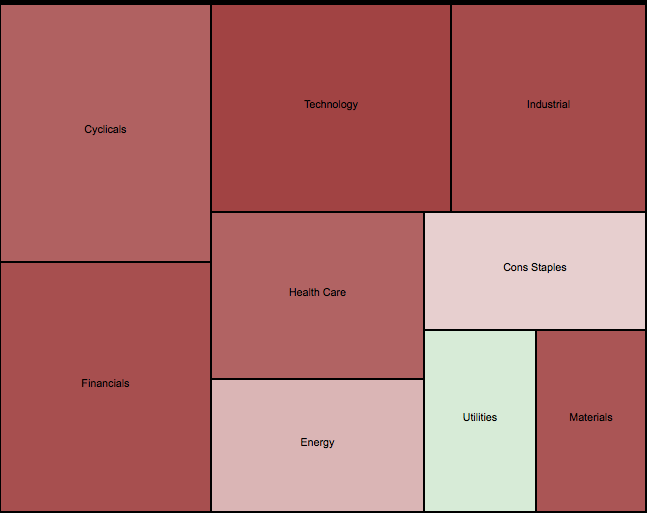
Utilities Buck the Trend with Show of Strength
by Arthur Hill,
Chief Technical Strategist, TrendInvestorPro.com
Looking for pockets of strength on a down day? Turn to the Sector Market Carpet. The first image shows the broad sector view with the utilities sector in light green. The other sectors are either red or a lighter shade of red, which means they are down. The second image...
READ MORE
