MEMBERS ONLY

BROAD SELLING HITS STOCK MARKET -- FINANCIALS LEAD SECTORS LOWER -- WEAKNESS IN AIRLINES WEIGHS ON TRANSPORTS -- OIL SURGES ON MIDDLE EAST TENSIONS -- GOLD FOLLOWS OIL WITH CHALLENGE TO JUNE HIGHS

by John Murphy,
Chief Technical Analyst, StockCharts.com
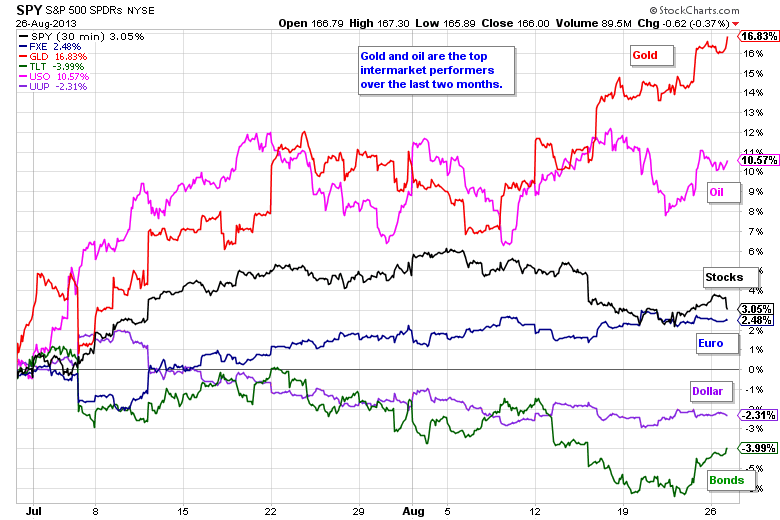
BROAD SELLING HITS STOCK MARKET ... Stocks were hit with broad selling pressure on Tuesday as traders worried over possible US involvement in Syria. Combined with tensions in Egypt, turmoil in the Middle East is clearly unnerving the markets. Note that gold and oil are both up. I will have charts...
READ MORE
MEMBERS ONLY
Oil and Gold Lead as Stocks Flounder

by Arthur Hill,
Chief Technical Strategist, TrendInvestorPro.com
**This chart analysis is for educational purposes only, and should not
be construed as a recommendation to buy, sell or sell-short said securities**
Despite a worse-than-expected durable goods report, stocks opened firmed and advanced in early trading. The major index ETFs were in positive territory in the afternoon, but selling...
READ MORE
MEMBERS ONLY

Charts of Interest: AXP, CRM, ENR, MDP, YUM
by Arthur Hill,
Chief Technical Strategist, TrendInvestorPro.com
AXP Breaks Triangle Trend Line.
CRM Forms Bear Flag.
Plus ENR, MDP, YUM
Video at end of commentary
**This chart analysis is for educational purposes only, and should not
be construed as a recommendation to buy, sell or sell-short said securities**
Click here for iPad/iPhone Version
This commentary and...
READ MORE
MEMBERS ONLY

Bullish P&F Signals Outnumber Bearish Signals
by Arthur Hill,
Chief Technical Strategist, TrendInvestorPro.com
Chartists can get an idea of the overall market trend by comparing the number of bullish P&F signals with bearish P&F signals. StockCharts provides this data every day on the predefined scans page. Notice that there are 87 Triple Top Breakouts on the NYSE and only...
READ MORE
MEMBERS ONLY

AMGEN LEADS BIOTECH SPDR HIGHER -- EXHAUSTION GAP AND BREAKAWAY GAP DEFINE CURRENT REVERSAL -- DOWNSIDE MOMENTUM INCREASES FOR THE S&P 500 ETF -- SHORT-TERM BREADTH INDICATORS TURN BEARISH -- CHARTING THE PLUNGE IN SINGLE FAMILY HOME SALES
by John Murphy,
Chief Technical Analyst, StockCharts.com
AMGEN LEADS BIOTECH SPDR HIGHER... Link for today's video. Biotechs continue to show relative strength as the Biotech SPDR (XBI) led the market on Monday. Chart 1 shows XBI bottoming in mid November and moving higher the last 10 months. The ETF surged to a new high in...
READ MORE
MEMBERS ONLY

QQQ Leads with Gap/Breakout - GLD Breaks Flag Resistance
by Arthur Hill,
Chief Technical Strategist, TrendInvestorPro.com
**This chart analysis is for educational purposes only, and should not
be construed as a recommendation to buy, sell or sell-short said securities**
Stocks started the week under selling pressure, but finished strong with a rally on Thursday and Friday. The major index ETFs closed up for the week with...
READ MORE
MEMBERS ONLY

DOLLAR IS TESTING IMPORTANT SUPPORT LEVEL -- WHAT IT DOES FROM HERE WILL IMPACT THE DIRECTION OF COMMODITIES -- EMERGING MARKETS STOCKS AND CURRENCIES ARE TESTING SUPPORT LEVELS AS WELL-- YIELD CURVE SUGGESTS UPPER LIMITS FOR BOND YIELD
by John Murphy,
Chief Technical Analyst, StockCharts.com
U.S. DOLLAR IONDEX IS TESTING JUNE LOW... The U.S. dollar is in the process of testing a couple of important support lines. Chart 1 shows the U.S. Dollar Index (USD) testing a support line drawn under its June low. That's an important test, because a...
READ MORE
MEMBERS ONLY

Toll Brothers Battles Support and Outperforms its Peers
by Arthur Hill,
Chief Technical Strategist, TrendInvestorPro.com
While the Home Construction iShares (ITB) battles broken support, Toll Brothers (TOL) is still holding support from the 2013 lows. The chart below shows TOL bouncing off support in mid August, but falling short of a breakout. The indicator window shows TOL relative to ITB using the price relative (TOL:...
READ MORE
MEMBERS ONLY

CONSUMER DISCRETIONARY SPDR CORRECTS WITH BIGGER UPTREND -- MARKING LONG-TERM SUPPORT FOR XLK, XLF AND XLI -- HOME CONSTRUCTION ISHARES HITS RESISTANCE AT NECKLINE BREAK -- A ROUGH MONTH FOR THREE KEY INDUSTRY GROUP ETFS
by John Murphy,
Chief Technical Analyst, StockCharts.com
CONSUMER DISCRETIONARY SPDR CORRECTS WITH BIGGER UPTREND... Link for today's video. The current uptrend in the stock market began in mid November. Since this low, the major index ETFs and most sector SPDRs have zigzagged higher with a series of rising peaks and rising troughs. With last week&...
READ MORE
MEMBERS ONLY

Tensile Trading: Stage #5 The Stairway to Reproducing Profits - Routines

by Gatis Roze,
Author, "Tensile Trading"
Look around you. Anywhere you see the pursuit of excellence happening, you discover the same set of recurring universal truths. Great athletes make greatness look effortless. Great traders make trading seem natural. The fact is that those who’ve achieved mastery make greatness look easy. When I was a young...
READ MORE
MEMBERS ONLY

Evidence Remains Bullish as Nasdaq and Russell OutPerform
by Arthur Hill,
Chief Technical Strategist, TrendInvestorPro.com
The bulk of the evidence remains bullish, but recent weakness took its toll on SPY momentum as this indicator trio turned bearish. Momentum indicators are leading indicators and will be the first to turn. However, they are also the most prone to whipsaws and bad signals. Of note, the $COMPQ:...
READ MORE
MEMBERS ONLY

IWM Leads with Small Breakout - ITB Challenges the Neckline
by Arthur Hill,
Chief Technical Strategist, TrendInvestorPro.com
**This chart analysis is for educational purposes only, and should not
be construed as a recommendation to buy, sell or sell-short said securities**
Stocks moved higher on Thursday with the Russell 2000 ETF (IWM) and S&P MidCap 400 SPDR (MDY) leading the way. Both gained over 1%. All...
READ MORE
MEMBERS ONLY

Industrial Metals and Precious Metals Lead Commodity Groups
by Arthur Hill,
Chief Technical Strategist, TrendInvestorPro.com
The US Commodity Groups PerfChart shows the performance for five commodity groups and the CRB Index ($CRB). Energy prices weighed on the CRB Index as the GSCI Energy Index fell over 1% this past month. In contrast, the GSCI Industrial Metals Index ($GYX) and the GSCI Precious Metals Index ($GPX)...
READ MORE
MEMBERS ONLY

Stocks and Bonds Close Lower after Fed Minutes
by Arthur Hill,
Chief Technical Strategist, TrendInvestorPro.com
**This chart analysis is for educational purposes only, and should not
be construed as a recommendation to buy, sell or sell-short said securities**
Stocks went on a wild afternoon run as the Fed minutes hit the tape. Despite a bounce attempt, the major index ETFs sold off and ultimately closed...
READ MORE
MEMBERS ONLY

Charts: BAC, BIIB, DDD, IDTI, PG, UAL, UPS
by Arthur Hill,
Chief Technical Strategist, TrendInvestorPro.com
BAC Channels back to Broken Resistance.
BIIB Firms after Pullback.
Plus DDD, IDTI, PG, UAL, UPS
Video at end of commentary
**This chart analysis is for educational purposes only, and should not
be construed as a recommendation to buy, sell or sell-short said securities**
Click here for iPad/iPhone Version...
READ MORE
MEMBERS ONLY

High Volume Gap Provides Support for E*Trade on CandleVolume Chart
by Arthur Hill,
Chief Technical Strategist, TrendInvestorPro.com
The chart below shows E*Trade (ETFC) with CandleVolume charts to accent volume. Upside volume has been strong in general and the stock gapped above 14 with the biggest volume since the mid March gap down. This gap zone around 14 has turned support as the stock firms just above....
READ MORE
MEMBERS ONLY

QQQ FORMS SMALL FLAG AFTER GAP -- NASDAQ 100 AD LINE BREAKS SHORT-TERM SUPPORT -- APPLE, MICROSOFT AND GOOGLE TELL THE TALE FOR QQQ -- OIL BACKS OFF RESISTANCE AS STOCK PERFORMANCE WEIGHS -- TECHNICAL RANK DECLINES FOR XLE AND OIH
by John Murphy,
Chief Technical Analyst, StockCharts.com
QQQ FORMS SMALL FLAG AFTER GAP... Link for today's video. The Nasdaq 100 ETF (QQQ) remains in an uptrend overall, but the short-term trend is down as the gap holds for four days (today is the fifth). Chart 1 shows QQQ within an uptrend overall as prices advanced...
READ MORE
MEMBERS ONLY

S&P 500 ETF Recaptures the 50-day
by Arthur Hill,
Chief Technical Strategist, TrendInvestorPro.com
The S&P 500 ETF (SPY) broke below its 50-day moving average on Monday, but moved right back above on Tuesday. This moving average held from December to early June. SPY broke below in late June, but quickly recovered and recaptured the moving average. It looks like another battle...
READ MORE
MEMBERS ONLY

Selling Pressure Extends for Stocks and Treasuries
by Arthur Hill,
Chief Technical Strategist, TrendInvestorPro.com
**This chart analysis is for educational purposes only, and should not
be construed as a recommendation to buy, sell or sell-short said securities**
Selling pressure continued in both stocks and Treasuries on Monday. These two were negatively correlated most of the last two years, but have been positively correlated the...
READ MORE
MEMBERS ONLY

Charts of Interest: CAKE, HCA, HTZ, IACI, WDC
by Arthur Hill,
Chief Technical Strategist, TrendInvestorPro.com
CAKE Stalls Below Prior High.
HCA Extends Flag Correction.
Plus HTZ, IACI, WDC
Video at end of commentary
**This chart analysis is for educational purposes only, and should not
be construed as a recommendation to buy, sell or sell-short said securities**
Click here for iPad/iPhone Version
This commentary and...
READ MORE
MEMBERS ONLY

Children's Place Tests Neckline Support
by Arthur Hill,
Chief Technical Strategist, TrendInvestorPro.com
Children's Place formed a head-and-shoulders reversal pattern from late May to August and is currently testing neckline support. Notice that downside volume is outpacing upside volume and On Balance Volume (OBV) broke its June low this month.
Click this image for a live chart...
READ MORE
MEMBERS ONLY

MIND THE GAP IN SPY -- SEMICONDUCTOR SPDR TESTS WEDGE BREAKOUT -- INTC HITS SUPPORT AS AMAT FIRMS WITH HIGH-WAVE CANDLESTICK -- GOLD BENEFITS FROM WEAKNESS IN BOTH STOCKS AND TREASURIES -- SENSEX TESTS SUPPORT AS BRIC ETF HITS RESISTANCE
by John Murphy,
Chief Technical Analyst, StockCharts.com
MIND THE GAP IN SPY... Link for today's video. In Friday's Market Message I showed some correction targets for the S&P 500 ETF (SPY) and Russell 2000 ETF (IWM) using weekly charts. Today I would like to get more granular by using daily charts...
READ MORE
MEMBERS ONLY
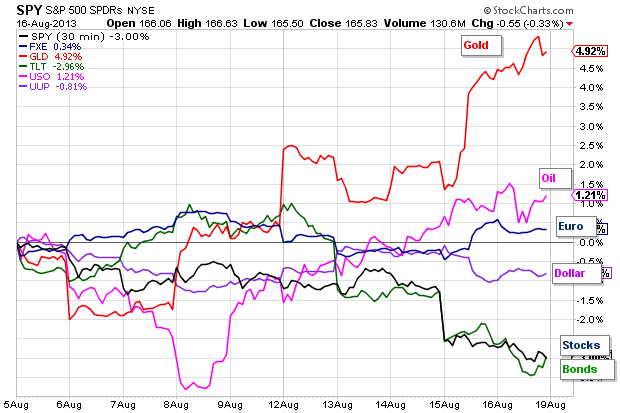
Gold Benefits from Weakness in Stocks and Bonds
by Arthur Hill,
Chief Technical Strategist, TrendInvestorPro.com
Selling pressure hit the stock market for the second week running as the major index ETFs lost ground. The Russell 2000 ETF (IWM) fell 2.27% last week, while the Nasdaq 100 ETF (QQQ) lost just 1.31%. Even though these are small losses in the grand scheme of things,...
READ MORE
MEMBERS ONLY
The Best Chart You've Never Heard Of
Hello Fellow ChartWatchers!
Three consecutive down days at the end of the week confirmed that August is going to be a rough month for stocks. A couple of quick clicks on our Interactive PerfChart tool show that all of the major market averages moved lower this week by between 1....
READ MORE
MEMBERS ONLY

Lower Interest Rates May Prove to be Headwind for US Dollar

by Richard Rhodes,
Founder and President, Rhodes Capital Management and Rhodes Trading Group
The capital market starting to trend once again. The 10-year note yield has risen rather swiftly in recent months, which has caused both the stock market and the US dollar to trade in a sideways movement. In each case, we believe it to be a distribution phase that will lead...
READ MORE
MEMBERS ONLY
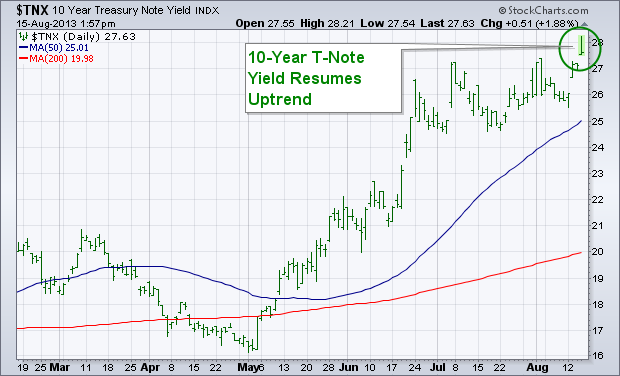
Bond Yield Resumes Uptrend
by John Murphy,
Chief Technical Analyst, StockCharts.com
The uptrend that started in bond yields during May is resuming. Chart 1 shows the 10-Year Treasury Note Yield ($TNX) hitting a new recovery high today. That resumes the uptrend in bond yields. The weekly bars in Chart 2 show that the TNX is now trading at the highest level...
READ MORE
MEMBERS ONLY
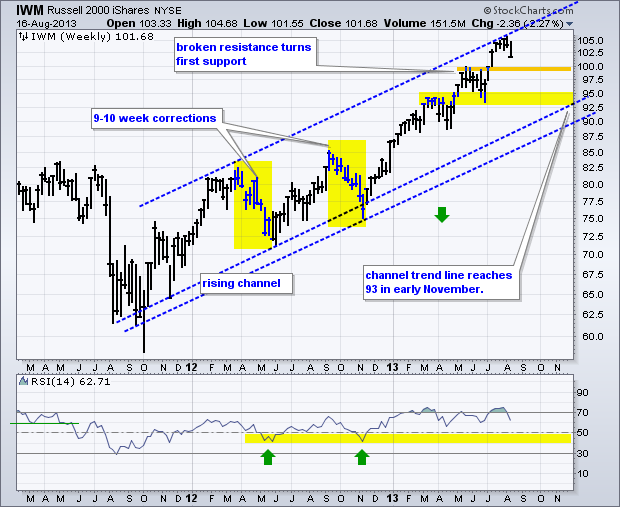
Russell 2000 ETF Starts Correction within Bigger Uptrend
by Arthur Hill,
Chief Technical Strategist, TrendInvestorPro.com
The Russell 2000 ETF (IWM) moved sharply lower this week to start a short-term downtrend, but this is still considered just correction within a bigger uptrend. There are simply no signs of a major top at this moment. Tops often form with major reversal patterns or consolidation, a bearish divergence...
READ MORE
MEMBERS ONLY
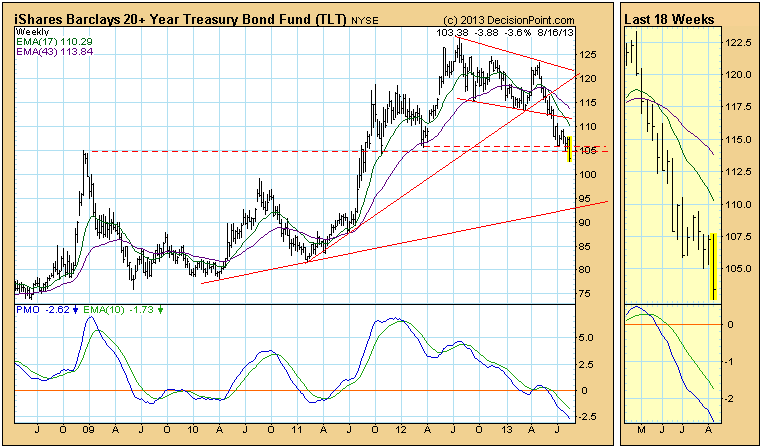
Bonds (TLT) Break Important Support

by Carl Swenlin,
President and Founder, DecisionPoint.com
This week let's take a look at bonds because rising rates are capturing broad attention. We use the 20+ Year T-Bonds ETF (TLT) as the surrogate for long bond timing. As of 5/20/2013 TLT is on a Trend Model NEUTRAL signal, which means that the model...
READ MORE
MEMBERS ONLY

Market Carpet Shows Retailers Lagging and Homebuilders Leading
by Arthur Hill,
Chief Technical Strategist, TrendInvestorPro.com
The image below shows the Market Carpet for just the consumer discretionary sector (cyclicals). Notice that Pulte (PHM) and Lennar (LEN) are leading on Friday, while Nordstrom (JWN) and Kohl's (KSS) are lagging. Chartists can double click on any symbol in the market carpet to expand that section...
READ MORE
MEMBERS ONLY

SETTING CORRECTION TARGETS FOR IWM AND SPY -- NETWORKING ISHARES REVERSES AT RESISTANCE -- DB COMMODITIES TRADING FUND CHALLENGES RESISTANCE -- HINDENBURG OMEN TRIGGERS AS NEW LOWS EXPAND -- BPI DIVERGENCES TAKE SHAPE FOR THREE KEY SECTORS
by John Murphy,
Chief Technical Analyst, StockCharts.com
SETTING CORRECTION TARGETS FOR IWM AND SPY... Link for today's video. Based on this week's price action and short-term downtrends in a number of breadth indicators, the market appears to have entered into a corrective period. This is hardly surprising given the run up from mid...
READ MORE
MEMBERS ONLY

Tensile Trading: Stage #4 How to Put the Winds at Your Back with Stock Market Analysis
by Gatis Roze,
Author, "Tensile Trading"
Don’t ever try to stand in front of a fire hydrant to quench your thirst – you’ll hurt yourself! The same holds true if you try to trade the stock market without a clear methodology. Global internet stock markets offer 24/7 temptations to those investors with no control....
READ MORE
MEMBERS ONLY

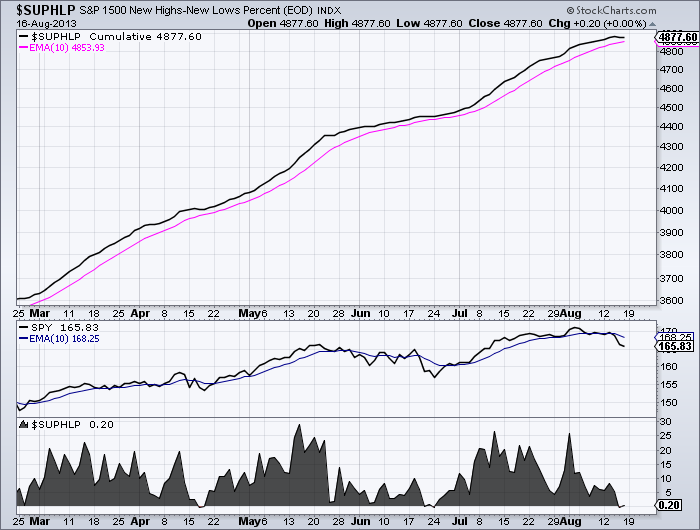
Net New Highs Turn Negative on Naz and NYSE
by Arthur Hill,
Chief Technical Strategist, TrendInvestorPro.com
Stocks were hit with broad selling pressure over the past week, but this is not enough to affect the overall uptrends. As we saw in November and June, corrections are normal in uptrends. The challenge, as always, is distinguishing between a normal correction and the start of something more (extended...
READ MORE
MEMBERS ONLY

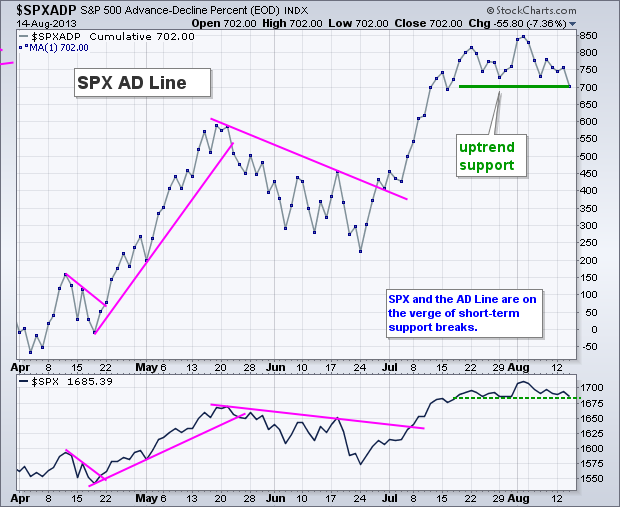
Selling Pressure Increases as Breadth Indicators Break Down
by Arthur Hill,
Chief Technical Strategist, TrendInvestorPro.com
Selling pressure certainly intensified on Thursday with an across the board decline. The high-beta Russell 2000 ETF (IWM) led the major index ETFs lower with a 1.82 percent decline. All sectors were down with the Consumer Discretionary SPDR (XLY) leading the way. It is negative to see this economically...
READ MORE
MEMBERS ONLY
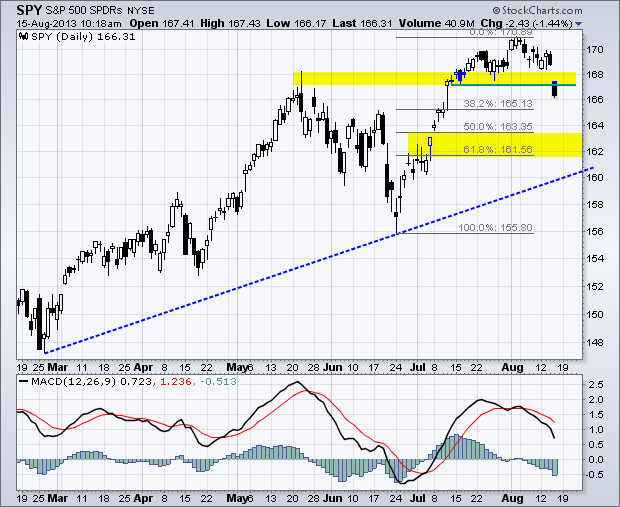
SPY Breaks Support with Gap Down
by Arthur Hill,
Chief Technical Strategist, TrendInvestorPro.com
After weeks of indecision, the S&P 500 ETF (SPY) made a decisive move with break below the late July low. The gap and support break are short-term bearish as long as they hold. Using the Fibonacci Retracements Tools, chartists can estimate next support in the 50-62% retracement zone,...
READ MORE
MEMBERS ONLY

STOCKS ENTER DOWNSIDE CORRECTION AS BOND YIELDS HIT TWO-YEAR HIGH -- S&P 500 TESTS 50-DAY AVERAGE -- WEEKLY INDICATORS SUGGEST POSSIBLE DROP TO JUNE LOW -- CISCO AND WALMART LEAD THE MARKET LOWER -- GOLD ASSETS CONTINUE TO GAIN GROUND
by John Murphy,
Chief Technical Analyst, StockCharts.com
BOND YIELD RESUMES UPTREND... The uptrend that started in bond yields during May is resuming. Chart 1 shows the 10-Year Treasury Note Yield ($TNX) hitting a new recovery high today. That resumes the uptrend in bond yields. The weekly bars in Chart 2 show that the TNX is now trading...
READ MORE
MEMBERS ONLY
Buyers Pull Back as SPY and IWM Consolidate Near Support
by Arthur Hill,
Chief Technical Strategist, TrendInvestorPro.com
Stocks opened weak and remained weak, but selling pressure was not that intense as the major index ETFs closed modestly lower. The Dow SPDR (DIA) and S&P Midcap SPDR (MDY) led the way by falling around .75 percent. All sectors were lower with the Consumer Discretionary SPDR (XLY)...
READ MORE
MEMBERS ONLY

Charts of Interest: ACN, AMD, DGX, KMB, TXT
by Arthur Hill,
Chief Technical Strategist, TrendInvestorPro.com
ACN Breaks Triangle Support with High Volume.
AMD Bounces off Support with Good Volume.
Plus DGX, KMB, TXT
Video at end of commentary
**This chart analysis is for educational purposes only, and should not
be construed as a recommendation to buy, sell or sell-short said securities**
Click here for iPad/...
READ MORE
MEMBERS ONLY

Home Construction iShares Breaks Neckline Support
by Arthur Hill,
Chief Technical Strategist, TrendInvestorPro.com
Rising rates are taking their toll on the Home Construction iShares (ITB) as the ETF broke neckline support on Wednesday. The head-and-shoulders pattern extends almost the entire year and today's breakdown confirms the bearish reversal. The indicator window shows the price relative (ITB:SPY ratio) moving to a...
READ MORE
MEMBERS ONLY

RETAIL SALES GROWTH SLOWS -- MACY'S PLUNGES TO SUPPORT ON BIG VOLUME -- RETAIL SPDR CONSOLIDATES ABOVE SUPPORT -- 20+ YEAR T-BOND ETF MOVES TO NEW LOW -- BOND PROXIES AND FINANCIALS UNDERPERFORM BROADER MARKET -- XLU FORGES LOWER HIGH AND BREAKS SUPPORT
by John Murphy,
Chief Technical Analyst, StockCharts.com
RETAIL SALES GROWTH SLOWS... Link for today's video. The Commerce Department reported a .2 percent rise in retail sales for July. Even though this gain was less than the June gain (.6 percent), it was still positive and still supports economic growth, albeit slow growth. To put this...
READ MORE
MEMBERS ONLY

ITB Tests Neckline Support - No Follow Through for GLD
by Arthur Hill,
Chief Technical Strategist, TrendInvestorPro.com
Stocks meandered on Tuesday with the major index ETFs finishing mixed on the day. The Nasdaq 100 ETF (QQQ) advanced .56% on the heels of Apple, while the Russell 2000 ETF (IWM) fell .13% on the day. Treasuries were the big movers as a positive retail sales report prompted another...
READ MORE
