Oil Just Broke Out. The Stock Market Bears Have Their Catalyst

Key Takeaways
- WTI broke out from a months-long consolidation pattern, putting a measured-move target near $120 in play.
- Rising oil prices and Treasury yields create a tougher intermarket backdrop for stocks and consumers.
- A stronger dollar and historically weak September seasonality add to the case for a more defensive cross-asset stance heading into the fall.
Wake me up when September ends. That's the tune the bulls are singing just two days into the month.
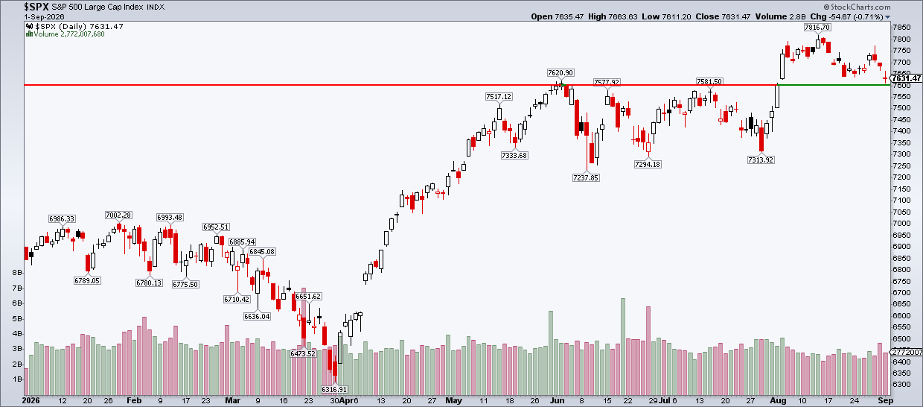
On the heels of higher global yields, long-duration equities are on the defensive ahead of Friday's payrolls report. The S&P 500 ($SPX) is now back to levels tagged three months ago, though still up more than 10% YTD and 17% over the past year. Cross-asset volatility is not exceptionally high, but intermarket correlations are what's giving the bulls fits heading into the third quarter's homestretch.
Bonds Keep Bleeding
The iShares Aggregate Bond ETF (AGG) is red for five sessions running coming into Wednesday. Each passing day of higher Treasury rates makes upcoming macro data all the more important. An NFP miss, followed by cool CPI and PPI next week, would seemingly offer a bid to bonds, but recall that last month's July dovish data did little to stymie the bond selloff. Treasuries are baiting Fed Chair Kevin Warsh and the 11 other FOMC voting members into a hike come September 16, with market-implied odds now scaling 70%.
I mentioned intermarket relationships earlier, and it's clear that oil and rates are tag-teaming right now. Just as AGG posted its worst losing streak since March, WTI crude oil busted through a months-long consolidation pattern. Barring dramatic events in tech or another explosive move in crypto, here's your chart for the week...
WTI: Revisiting $120? The Chart Says So.
Notice in the SharpChart below that the prompt month of WTI crude oil ($WTIC) has advanced through a symmetrical triangle pattern. The rally shows confirmation signs in early trading on Wednesday, September 2. It can be tricky to arrive at a precise upside price target with these consolidation features, but the rule of thumb is to first take the triangle's height once it's established on both the downside and upside. In this case, $67 to $100 yields a $33 range. Added to the breakout point near $87, that has triggered a measured move price objective to $120.
On this YTD zoom, look at the moving averages. The long-term 200-DMA remains on the rise, suggesting that the bulls control the primary trend. The 50-DMA had been declining from June through much of August, but it has always held above the 200-DMA since mid-March. Indeed, despite a June plunge, several technical features were still intact for domestic oil.
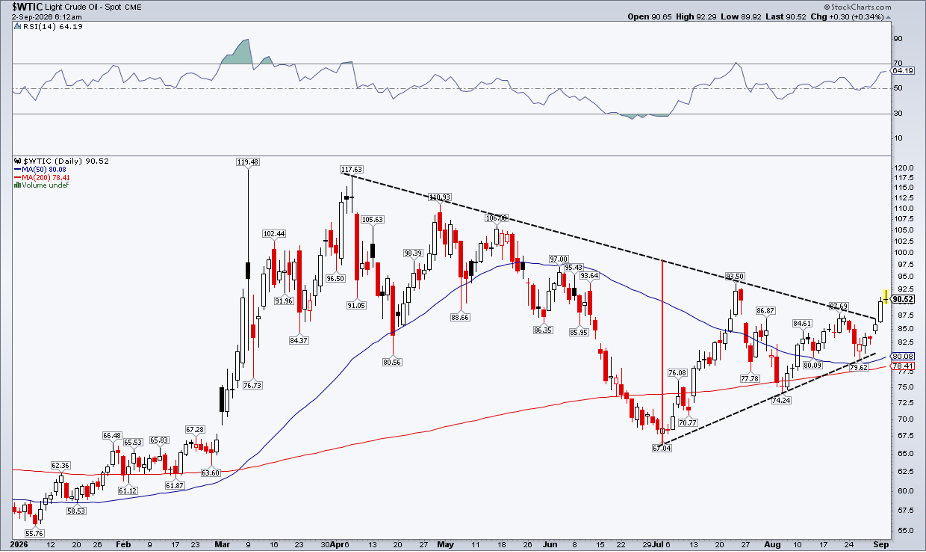
$120 is also interesting since it was the spike high shortly after the conflict in Iran began. Price has a way of recalling the past, and those flashes (up or down) are sometimes revisited, much like how gaps eventually get filled. At the very least, the triangle apex price (the mid-$80s) is presumed to now serve as support if we see a pullback.
Bullish Oil Calendar Trends... For Now
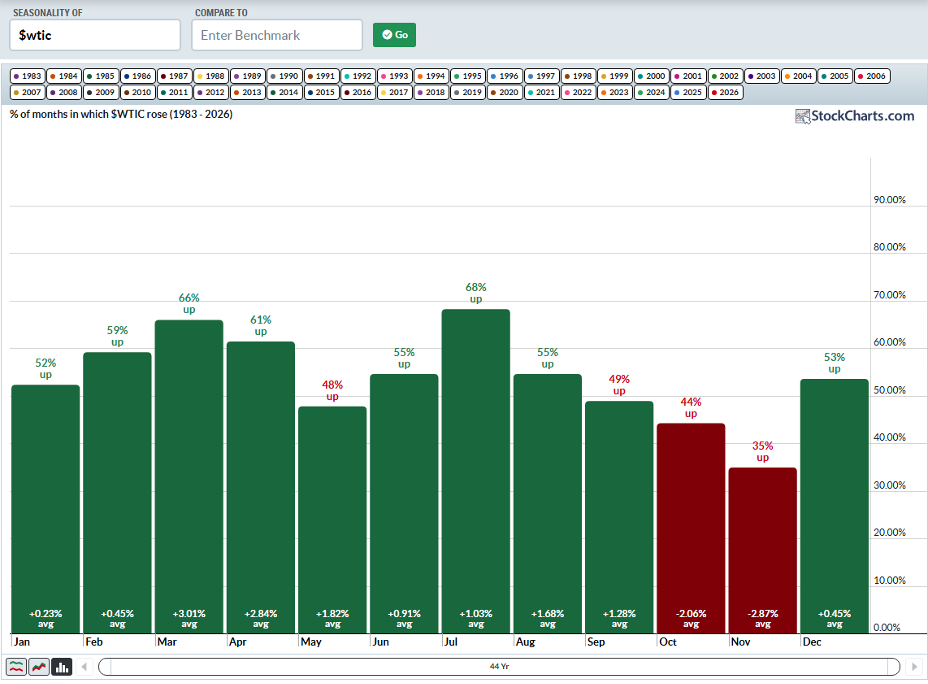
Keep in mind that while September is painted red in equities across most timeframes, WTI is boasting an average gain of 1.3% for the month in data dating back to 1983. Its positivity rate is a mere 49%, however.
Using StockCharts' revamped seasonality tool, we find that October and November are historically the worst back-to-back months by a large margin.
Higher Oil is Bad News for Bonds & Consumer Stocks
An oil price breakout doesn't spell doom for the stock market, but it's an obvious bearish catalyst for bonds. Global yields press to fresh cycle highs seemingly day after day, and my 5.55% 30-year Treasury rate technical target remains in play.
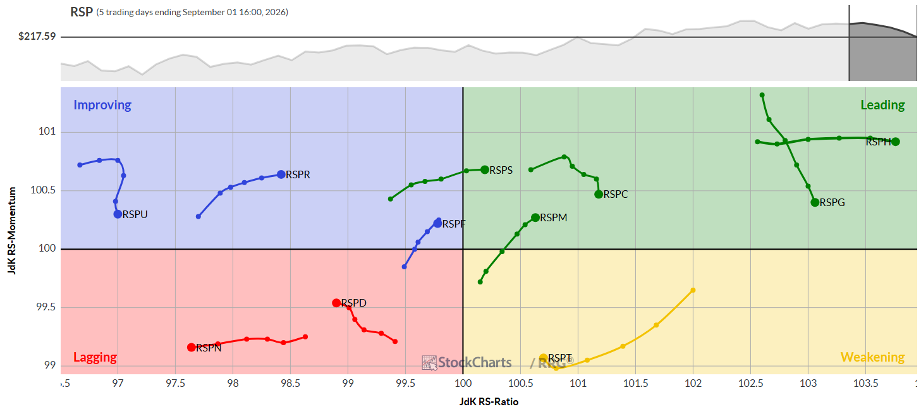
Oil prices resuming higher does the consumer no favors, either, and we have already seen weakness in the Invesco S&P 500 Equal Weight Consumer Discretionary ETF (RPSD). The refreshed Relative Rotation Graph (RRG) reveals that the fund, along with EW Industrials (RSPN), is in Lagging territory. Several cyclical sectors (cap-weighted and equal-weighted) appear vulnerable at a precarious point on the calendar.
Energy Stocks are Hitting New Records
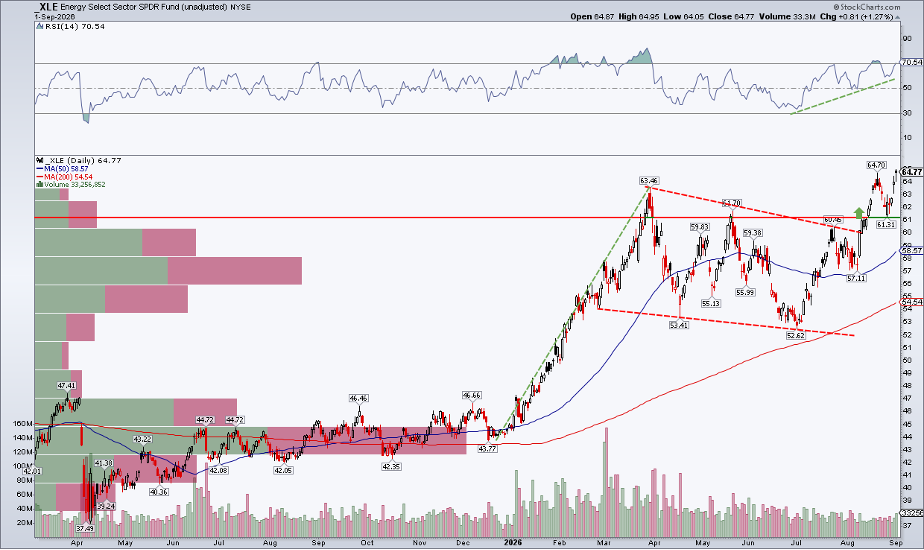
Energy equities, meanwhile, are doing all the right things. The Energy Select Sector SPDR ETF (XLE) tallied a record high on Tuesday, eclipsing both its March and August highs. An extended bull flag pattern over Q2 and Q3 resolved with price advancing, and even the recent minor pullback from $64.70 to $61.31 was healthy, in that it was a successful test of previous resistance levels.
Today, a high amount of Volume-by-Price is comfortably below the current level, suggesting that there should be ample support upon a more protracted decline. A measured move upside price objective of roughly $80 is in play, based on the flagpole's height added to the breakout point.
Don't Forget the Dollar
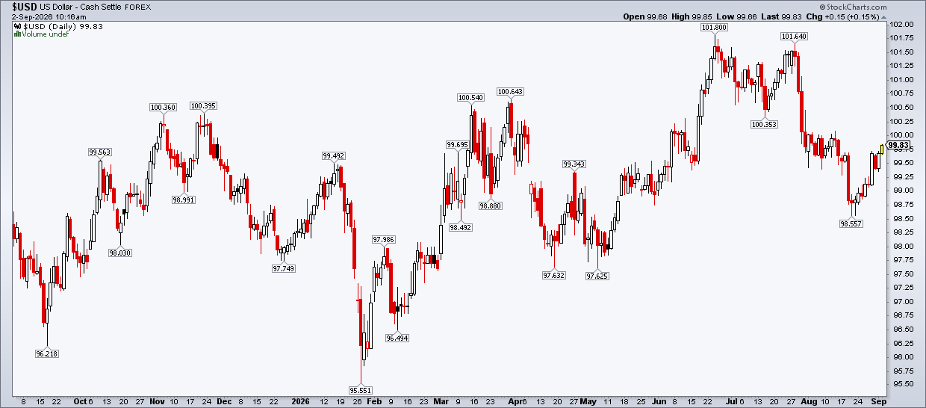
A complete intermarket assessment requires at least a brief gaze at the greenback. After sliding below 98 in August, the dollar (as measured by $USD) is knocking on 100's door. It could be sniffing out a hawkish Fed, but, regardless of the motive, a rising buck would be yet another bearish brick in the wall for risk assets this month.
The Bottom Line
WTI crude oil's breakout this week looks like one of the most important intermarket technical developments, perhaps of the year. It's precisely the catalyst that equity bears need to take advantage of scary seasonal trends. It's also further fuel for the ongoing bond bear market. With the dollar's help, traders may be well served to focus on defense in the weeks ahead.
Your charts tell one story. Intermarket Analysis tells the whole story. Visit the Market Summary page and scroll to the Intermarket Analysis panel to watch stocks, bonds, commodities, oil, gold, and the dollar move in sync (or fall out of it).
Disclaimer: This blog is for educational purposes only and should not be construed as financial advice. The ideas and strategies should never be used without first assessing your own personal and financial situation, or without consulting a financial professional.