MEMBERS ONLY
Earnings are Driving This Market

Mary Ellen McGonagle highlights where institutional money is flowing, what sectors are showing improving strength, and where to watch as another busy week of earnings unfolds.... READ MORE
Mary Ellen McGonagle highlights where institutional money is flowing, what sectors are showing improving strength, and where to watch as another busy week of earnings unfolds.... READ MORE

With market breadth improving, the S&P 500 has potential for an upside breakout. Arthur Hill analyzes market breadth indicators and shows why an upside breakout is possible in the SPY.... READ MORE


The S&P 500 remains trapped in a trading range, but market breadth tells a more nuanced story. Dave Keller, CMT, reviews key breadth indicators to explain what's supporting the bull market, where warning signs remain, and what would confirm a more bullish outlook.... READ MORE


Growth stocks may be out of favor, but now might not be time to give up on them. Here's one key price point in the chart of IWF that could determine whether or not growth stocks regain their leadership.... READ MORE


While oil prices are cooling off, wheat, soybean, and corn prices may be getting ready to take off. Martin Pring analyzes the charts of the agricultural complex and shows you the price levels to monitor.... READ MORE

Are consumers spending on discretionary goods, or are they more cautious? Martin Pring analyzes the ratio of consumer discretionary to consumer staples stocks and provides insight into what could be a likely scenario.... READ MORE

Longer-term momentum in gold and silver prices points to a long consolidation or bear market. Martin Pring analyzes the charts of both metals and discusses the potential for a relief rally.... READ MORE

What a week! One day, the major indexes look ready to slide lower; the next day, they reverse course and end the week on a positive note. This week’s update: * Wild stock market swings * Scanning for strong stocks * Level up your scanning skills If you’re a short-term... READ MORE
With market breadth improving, the S&P 500 has potential for an upside breakout. Arthur Hill analyzes market breadth indicators and shows why an upside breakout is possible in the SPY.... READ MORE
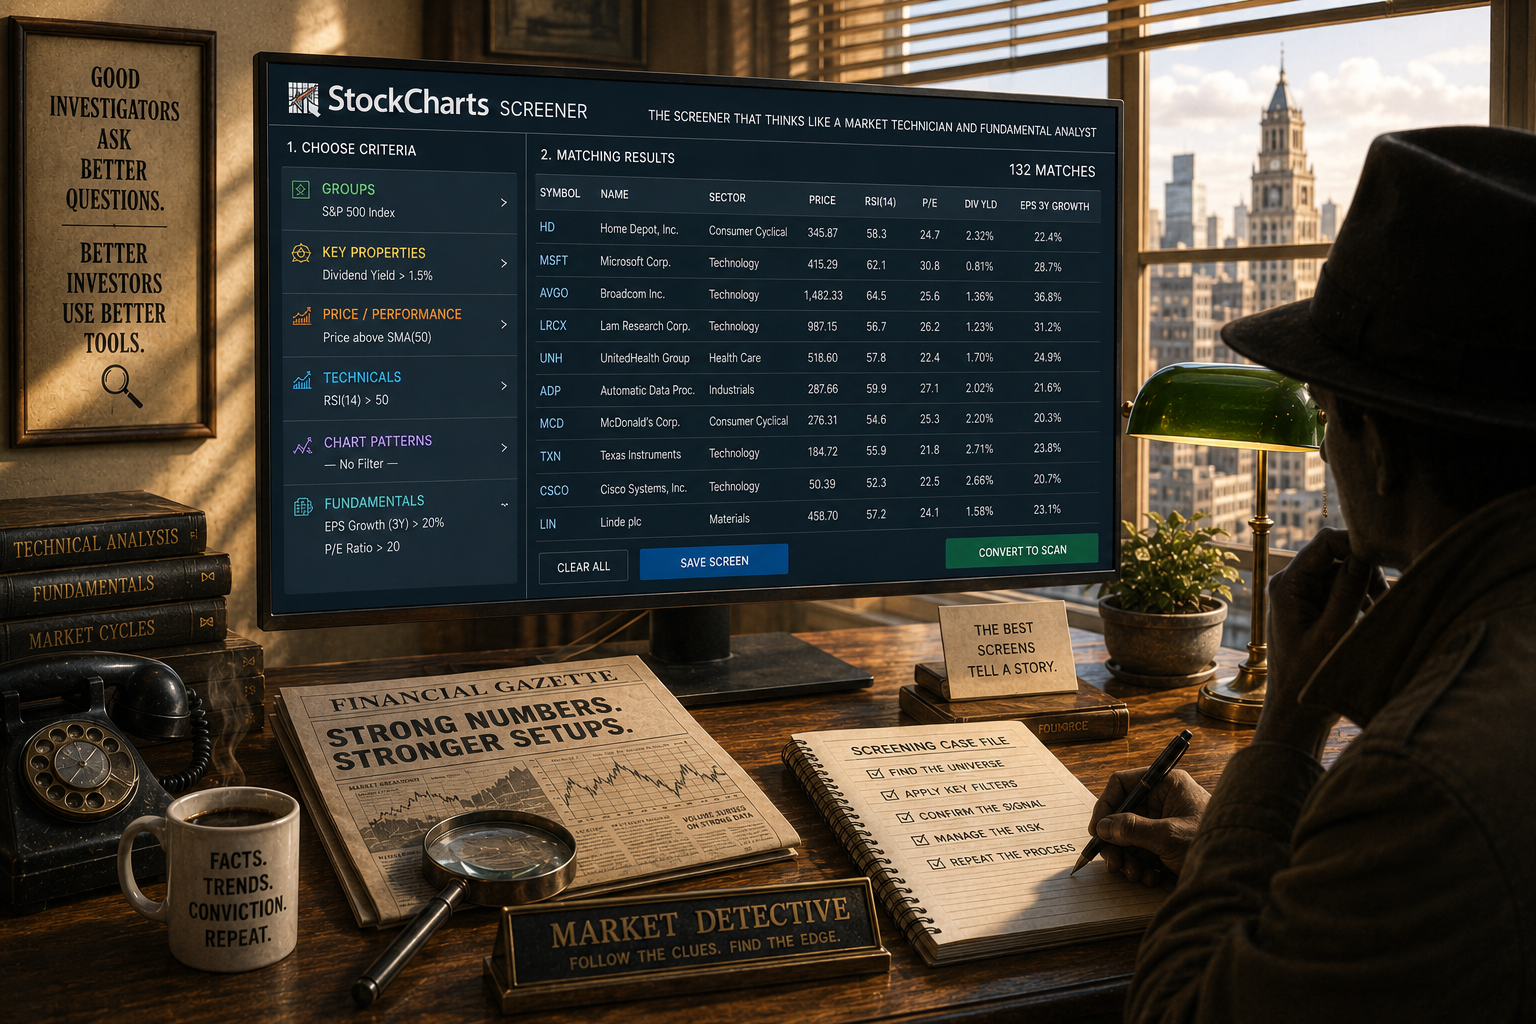

Before We Dive In… There are times when you want to find tradable securities based on a simple premise. You want stocks or ETFs in certain groups exhibiting a few key technical and fundamental characteristics. What you don’t want to do in this early stage is to craft a... READ MORE
The S&P 500 remains trapped in a trading range, but market breadth tells a more nuanced story. Dave Keller, CMT, reviews key breadth indicators to explain what's supporting the bull market, where warning signs remain, and what would confirm a more bullish outlook.... READ MORE

Money is rotating, but where is it going? Tom examines the areas holding up best as former leaders lose momentum. He also reviews key support levels, seasonal trends, recent and upcoming Magnificent Seven earnings, and the market signals that deserve the closest attention in the weeks ahead.... READ MORE

Stocks, bonds, and volatility send warning signals after the Fed meeting. Here are the key support levels and market catalysts traders should watch next. ... READ MORE
Growth stocks may be out of favor, but now might not be time to give up on them. Here's one key price point in the chart of IWF that could determine whether or not growth stocks regain their leadership.... READ MORE
Dave Keller examines key market breadth indicators to explain why some signals remain bullish while others are beginning to weaken, along with what investors should be watching next.... READ MORE
While oil prices are cooling off, wheat, soybean, and corn prices may be getting ready to take off. Martin Pring analyzes the charts of the agricultural complex and shows you the price levels to monitor.... READ MORE

SpaceX's stock price has fallen about 50% from its peak. Has the selloff run its course? Here's a look at the charts and the levels to watch.... READ MORE

The headline indexes don’t reveal everything happening beneath the surface. Mary Ellen McGonagle uncovers where strength is emerging, why equal-weight indexes are holding up better, and what to watch as another big week of earnings begins.... READ MORE
Earnings, tariffs, oil prices, and Treasury yields gave investors plenty to digest this week. By Friday’s close, the S&P 500 ($SPX), Nasdaq Composite ($COMPQ), and Dow Jones Industrial Average ($INDU) had all closed lower for the week, with the Nasdaq taking the biggest hit. This week’s... READ MORE


The StockCharts Screener has arrived. Discover how this powerful new tool can help you quickly narrow thousands of stocks, simplify your research, and transform the way you find new opportunities.... READ MORE

Earnings season is in full swing and, as expected, results were mixed. Tom Bowley looks at four stocks of companies that have reported earnings, and discusses one indicator you should review ahead of earnings reports.... READ MORE

When a stock falls below its 50-day moving average but remains above its 200-day moving average, the next move often determines the longer-term trend. Dave Keller, CMT, explains this "moving average limbo" pattern, using Alphabet, MDY, and Broadcom to identify key technical signals.... READ MORE

Out of the 11 S&P 500 sectors, Utilities is showing the strongest breadth. Arthur Hill does a top-down analysis starting with the sectors, then focuses on the chart of XLU.... READ MORE

Julius de Kempenaer breaks down the latest changes to his RRG Portfolio Framework, including shifts in commodities, bond positioning, sector leadership, and why a stronger U.S. dollar deserves attention.... READ MORE

The stock market remains range-bound as investors weigh earnings, rising oil prices, Treasury yields, and gold's attempt to break higher.... READ MORE
The market has entered a period of consolidation, which is when many investors make costly mistakes. Tom Bowley explains why lowering expectations, staying patient, and avoiding the urge to chase stocks may be the better strategy.... READ MORE

With mega-cap tech earnings on deck and a Fed meeting in July, there are some technical warning signs emerging. Here's one chart all investors should be monitoring closely.... READ MORE

The S&P 500 is getting close, but several important pieces must fall into place before a breakout becomes more likely. Joe Rabil explains the signals he’s watching, then talks key developments in commodities and shares several stock ideas.... READ MORE

The S&P 500's bullish setup is still holding, but key tests remain ahead. Frank Cappelleri reviews the index’s active chart patterns, market internals, and which semiconductor signals could shape the market’s next move.... READ MORE

Julius de Kempenaer presents his weekly update on the U.S. stock market sector rotation using Relative Rotation Graphs®.... READ MORE
Are consumers spending on discretionary goods, or are they more cautious? Martin Pring analyzes the ratio of consumer discretionary to consumer staples stocks and provides insight into what could be a likely scenario.... READ MORE
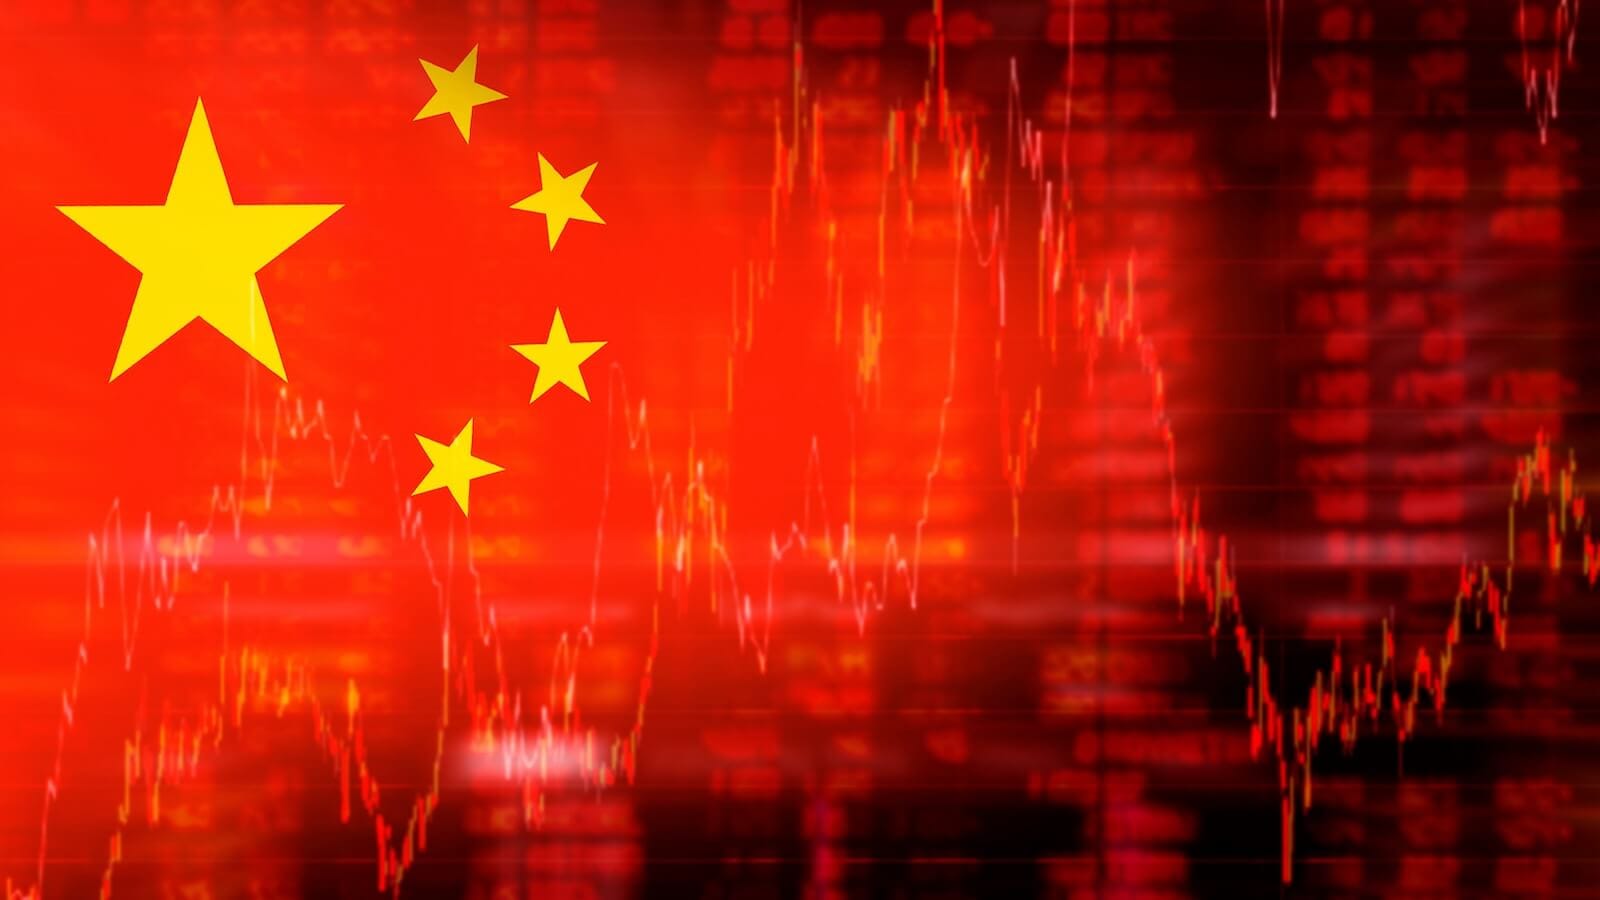
As semiconductor stocks are retreating, China ETFs are displaying strengthening relative strength. Could it be an opportunity to diversify your portfolio during the second half of the year? ... READ MORE

The Nifty 50 traded between 24,000 and 24,368 on the week ending on July 17, 2026. What can you expect in the upcoming week? Find out from Milan Vaishnav's analysis of the Nifty 50 and weekly sector performance.... READ MORE
It was a rough week for the stock market, despite a strong start to quarterly earnings season. Technology stocks came under pressure, oil prices continued to rise, and the Cboe Volatility Index ($VIX) jumped 12.19%, closing at 18.77. With so much uncertainty in the market, the weekend is... READ MORE
Not everything is falling; Mary Ellen McGonagle highlights the sectors, industries, and stocks showing strength despite market weakness. Discover where relative leadership is emerging as earnings season ramps up and volatility increases.... READ MORE
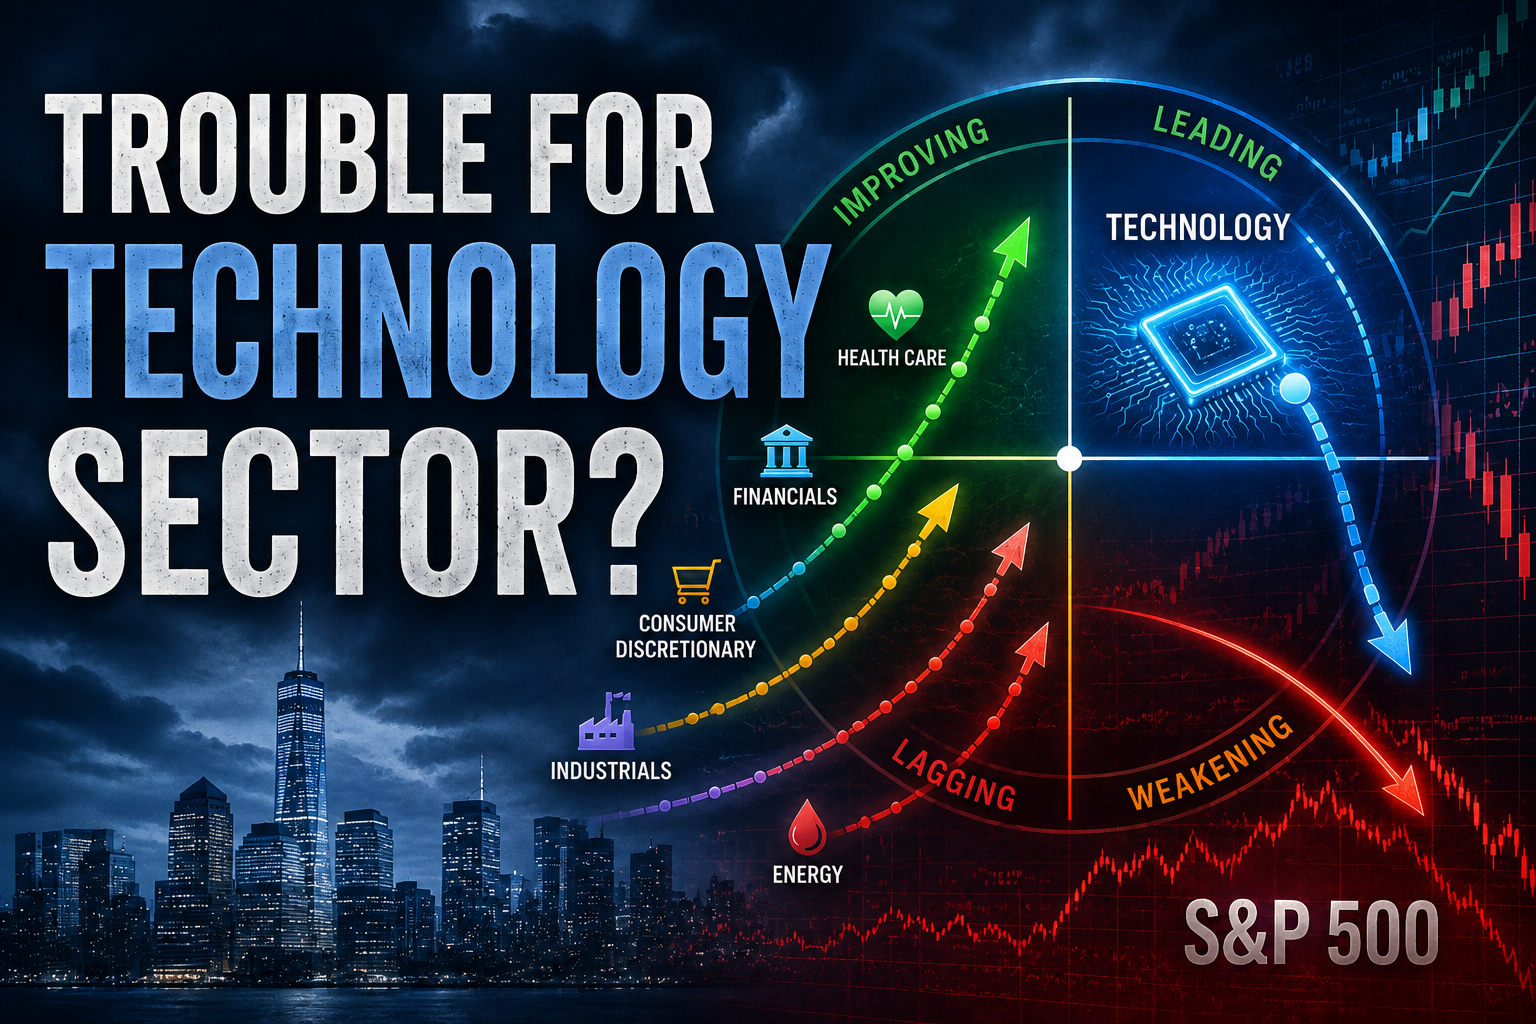
Julius de Kempenaer presents an analysis of sector rotation out of technology and semiconductor stocks and examines how this may impact the S&P 500 index.... READ MORE

The S&P 500 remains locked in a consolidation phase, but that won't last forever. Dave Keller, CMT, outlines four possible market scenarios through the end of August, explaining the technical signals, sector rotation, and macro drivers that could shape the next major move.... READ MORE

Should you rely on AI models to pick your stocks? Discover the pitfalls of relying on AI decisionmaking when trading — and how the tools offered by StockCharts.com can help you make your own best choices.... READ MORE
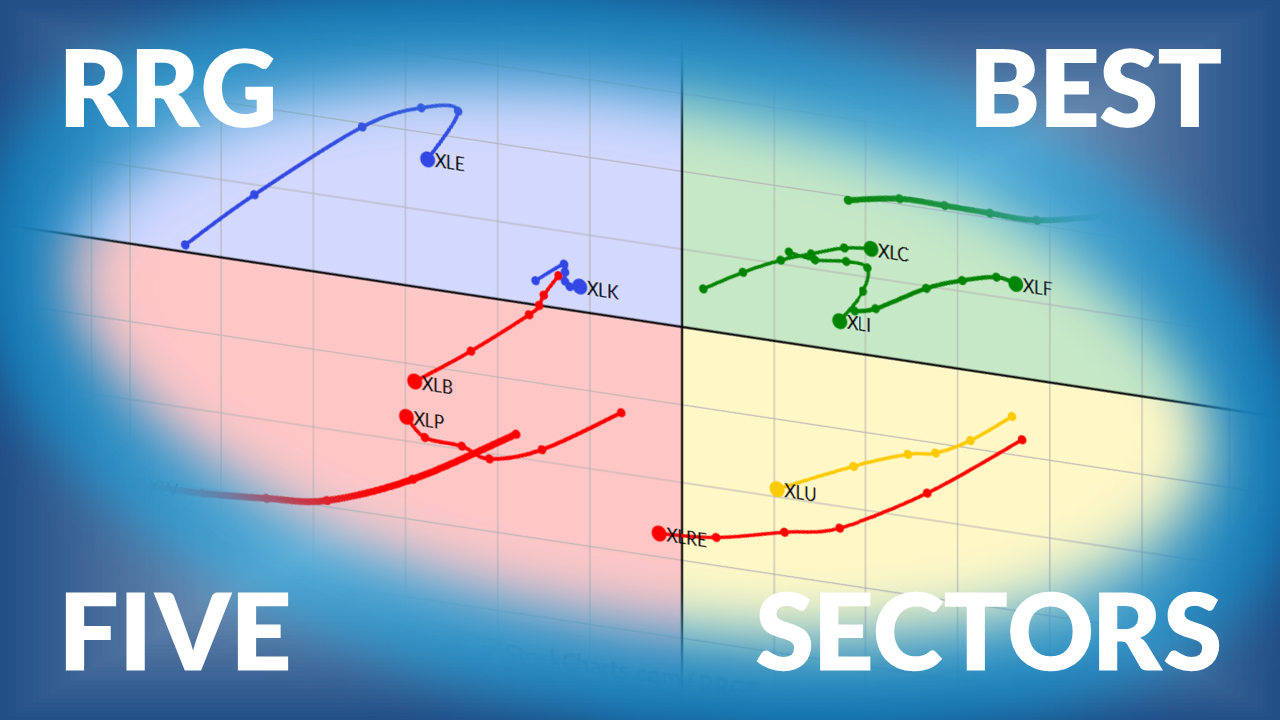
Julius de Kempenaer presents his weekly update on U.S. stock market sector rotation using Relative Rotation Graphs.... READ MORE

Learn how to uncover early opportunities and evaluate options strategies with the StockCharts + OptionsPlay workflow.... READ MORE

Joe Rabil explains why tech weakness may be creating new opportunities and highlights the technology stocks and chart patterns beginning to show early strength.... READ MORE

As semiconductor leadership fades, financial stocks continue to strengthen. Dave Keller, CMT, analyzes Morgan Stanley, Bank of America, and Wells Fargo, highlighting technical patterns, support levels, and momentum signals that could drive further leadership in the sector.... READ MORE

Earnings season can show early signs of weakness emerging beneath the stock market's surface. Here's how you can identify which equities, sectors, and ETFs have deteriorating momentum.... READ MORE

Before We Dive In… It’s easy to get too caught up in the present. Especially when it comes to investing. You’ve got news headlines, economic reports, current price moves, and just about everything to distract from what matters most: context. This is an exploitable blind spot, and not... READ MORE
Financial earnings season is underway, but rising Treasury yields could prove as important as the earnings reports. Dave Keller explains the signals he’s watching, breaking down five financial stocks at pivotal technical levels.... READ MORE

Volatility is relatively low as we approach earnings season, but expect volatility surges in individual stocks ahead of earnings. Mike Zaccardi presents the stocks he's keeping an eye on. ... READ MORE