The S&P 500 Is Rallying. So Why Are Industrials Falling Behind?

Key Takeaways
- The Industrials sector has lagged this summer, with XLI trading 6% below its August record high and bearish momentum building into September.
- Caterpillar flashes warning signs, highlighting growing concerns around the AI-driven capital-spending trade.
- September seasonality favors caution, but strong Q4 trends suggest a potential snap-back rally could emerge in XLI well before the midterms.
It's Jobs Week, and thus traders' eyes are turning back to Wall Street from Jackson Hole, with a slew of major employment updates and a handful of market-moving off-season earnings reports on tap. The S&P 500 ($SPX) is putting the finishing touches on a solid August, up about 3%, with the Nasdaq 100 ($NDX) outperforming with a 4.1% monthly advance. Small- and mid-caps have lagged, each up less than 2%, alongside modest underperformance among international stocks.
Bonds, for all the bearish bluster, have rallied on net, with the iShares Aggregate Bond ETF (AGG) higher by half a percentage point in total return. The US Dollar Index ($USD) was flat in August, but Bitcoin ($BTCUSD) and gold ($GOLD) put on a show, up 23% and 10%, respectively.
Broad-based risk-on activity in August usually bodes well for the SPX during the notoriously rocky September stretch. Poor returns in Q3's final quarter typically follow weak YTD price action and, with the S&P 500 ETF (SPY) returning 13–14% through 2026's first eight months, September is a show-me story for the bears.
Industrials Hits the Brakes
Nevertheless, 'tis the season to call out what's not working so well. Near the top of that list is the bellwether Industrials sector. Powered by GE Aerospace (GE) and Caterpillar (CAT), which together comprise almost 15% of the Industrials Select Sector SPDR Fund (XLI), price action has been stuck in first gear for several weeks. On Friday, the adjacent Utilities sector finished at its weakest mark since January.
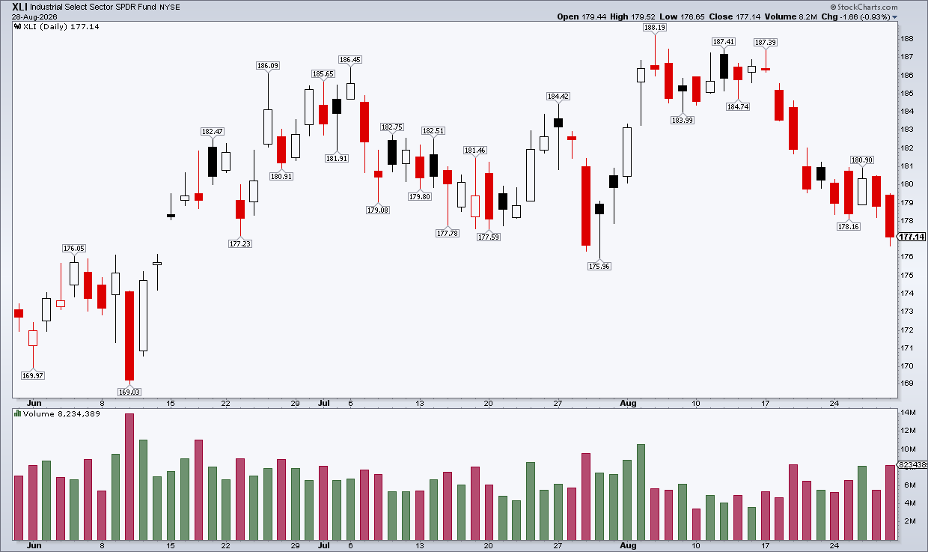
In fact, XLI has traded lower intraday in nine of the last 10 sessions coming into the month's final trading day. That's a negative tell, as it means the bears have owned price action during market hours. In the candlestick chart below, you'll see solid-color real bodies, indicating a share price that opens near the high of the day and closes near the low of the day.
A Laggy Summer
What's more, relative price action has been nothing short of dreadful this summer. Back in Q2, I looked for Industrials to gain traction and help stocks lift to new highs following the March 30 correction low. That did play out over a few brief weeks in June, with XLI outperforming from June 1 to June 25. But the past two months have featured negative alpha for the traditionally cyclical-value sector.
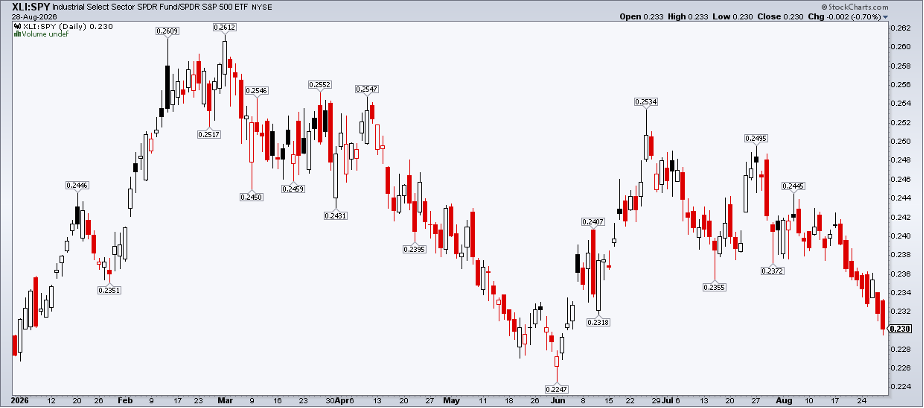
Of course, the space is now more than ever tethered to the AI trade. Industrials is also the most expensive of the 11 S&P 500 sectors on a P/E-ratio basis.
Bears Powering Down the Field
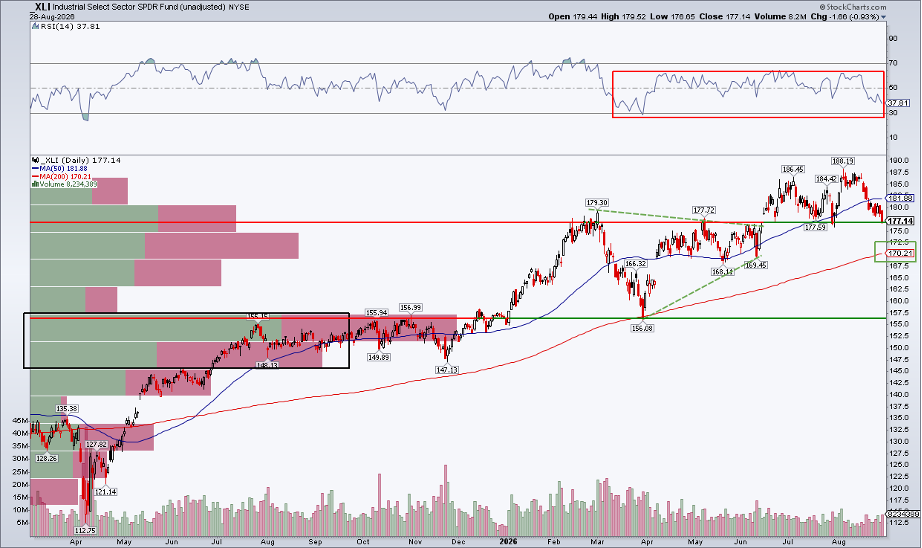
But what do the technicals say right now? Notice in the chart below that XLI is 6% below its August 5 record high. Down eight of the previous 10 sessions coming into August's final trading day, the bears have asserted themselves. Shares closed last week on a bearish note following Fed Chair Warsh's Jackson Hole speech and steep Treasury rate increase, nearly printing their worst settle since June 12. Still, the long-term 200-day moving average is on the rise, suggesting that the bulls control the primary trend. Key support is now in play in the high $170s, which was the range highs over the first half of the year.
That's also near the breakout point from the February-through-early-June consolidation, so we should naturally expect buyers to step up. If they don't, a breakdown below $177 would trigger a downside measured-move price target to $166, based on the prior two months' $11 range.
The RSI Points to a Defensive Posture
In addition, take a look at the RSI momentum oscillator at the top of the SharpChart. It's not a pretty picture if you're an Industrials bull. Ranging from the 30s to the 60s, the bears have a tighter grip here than the bulls. In the short run, the 50-DMA has turned flat in its slope amid the summer doldrums.
Long-term support is way down at $156, which would likely require a full-fledged midterm-year market correction to strike in order for a test there.
A CAT Nap
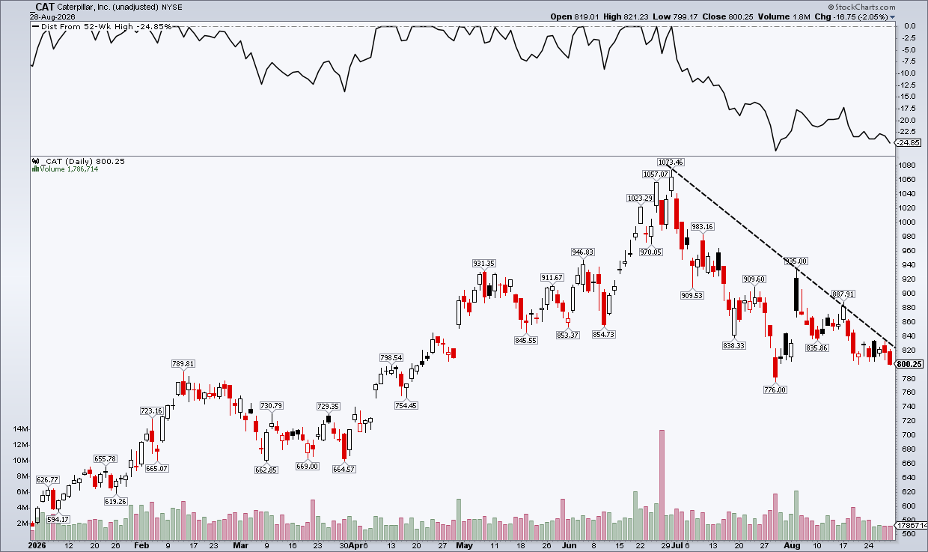
Among the most ominous Industrials sector names is CAT. The Dow Jones Industrial Average stalwart has badly lagged so far in the second half, declining from $1,071 on June 30 to $800 today. It's not so much an indicator of traditional US manufacturing and machinery activity but, instead, a gauge on AI. Right now, the charts instill trepidation, not AI confidence. CAT is on the bears' watch lists, for sure.
Football Season & Bearish Season?
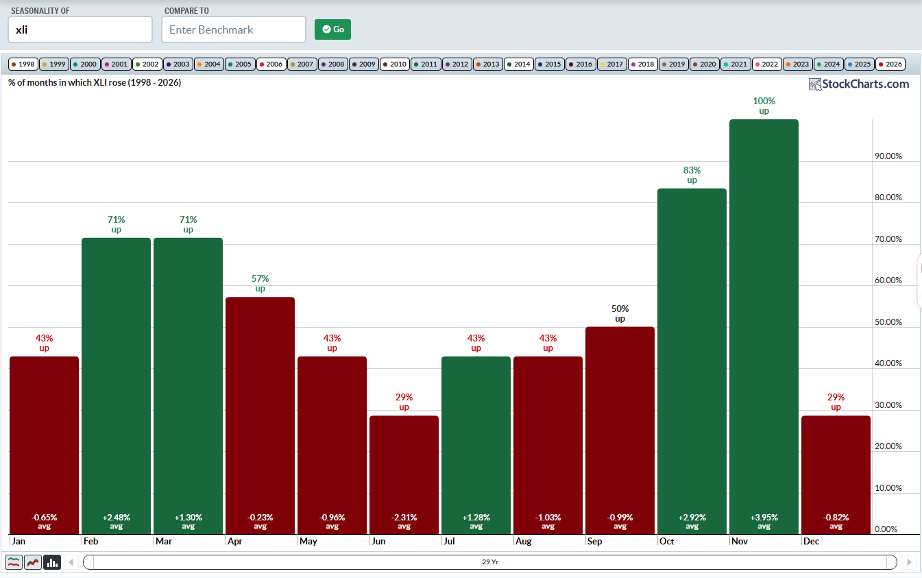
Seasonally, XLI is not immune from the September scaries. In data going back to 1998, the ETF has been up just 52% of the time, posting an average loss of 1.13%. That's weak enough for the worst monthly performance. The good news is that Q4 has been outright bullish in XLI's nearly three-decade history, rallying by more than 1% in each of the year's final three months.
With StockCharts' revamped Seasonality page, we can even focus on midterm years. Simply click to deactivate all years except 1998, 2002, 2006, 2010, 2014, 2018, 2022, and 2026. September still looks dicey (up half the time, -0.99%), but check out October & November: massive gains, with all but one such month positive.
So, near-term trends and momentum favor the bears, but we can't be surprised by a snap-back rally leading into and through the November election.
The Bottom Line
Industrials has been on its back foot all summer. The AI data-center story has wobbled, perhaps due to public outcries and questionable future capex plans. Regardless of the fundamental reason, the charts point to key support in play heading into September. The often-volatile month asserts that traders should be on the defensive, but seasonality suggests a bullish stop-and-reverse play may come sooner than you think.
Disclaimer: This blog is for educational purposes only and should not be construed as financial advice. The ideas and strategies should never be used without first assessing your own personal and financial situation, or without consulting a financial professional.