Retail Earnings Week: Will Walmart and the Consumer Power the S&P 500 to More Record Highs?

Key Takeaways
- Retailer Q2 reports take center stage: Home Depot, Lowe’s, TJX, Target, and Walmart offer fresh clues on consumer spending.
- WMT’s chart flashes caution, with price below key resistance at $118 and $105–$107 support.
- The XRT ETF has retreated from multi-year highs, making this week’s earnings important for the market’s broadening trade.
The S&P 500 ($SPX) enters retailer earnings week on a heater. Despite a small giveback last Friday, U.S. large caps printed a fresh record-high weekly settle during what’s often a sketchy time of year for the bulls. Fundamentally, the data was just what the doves ordered. CPI was cool, PPI was tame, and Friday’s Retail Sales report was far from hot.
We’ll get more color on the consumer this week with a slew of Q2 reports. Home Depot (HD) kicks things off on Tuesday morning, followed by Lowe’s (L), TJX Companies (TJX), and Target (TGT) on Wednesday before the bell. You can check out all the earnings players on the StockCharts earnings calendar.
Blue Light Special
All eyes will be on Walmart (WMT) in Thursday’s pre-market. Shares of the $917 billion market-cap Consumer Staples company have lagged badly since February, despite a resilient consumer and a recent tariff-refund kicker. Technically, there’s much to be desired.
Let’s dive right into what WMT’s chart shows ahead of the firm’s Q2 numbers. We’ll then zoom out and view the broader retail space to see if household spending is likely to hold up through year-end.
Not the Best Chart in the Market
Notice in the chart below that WMT has been a laggard for several months after putting in a bearish double-top feature from February through May. The long-term 200-day moving average is turning flat in its slope, suggesting a battle between the bulls and bears for control over the primary trend (this as the SPX reaches new highs). The 200-DMA has confluence with a historical polarity level of $118. So, as long as the stock is below that, the bias is bearish. Even if we see a post-earnings climb through that spot, the $135 double-top lingers, with a notable area of Volume-by-Price in the 1H range.
Also, look at where key support lies. $105 to $107 is crucial to hold. Now, with WMT trading near $115, it’s unlikely we’ll see such a violent downside reaction, given that the options market prices in a 4.4% swing by Friday’s close. It’s interesting, however, that implied volatility is unusually high at 29% (double the S&P 500’s implied vol). Recall that shares sank 7.3% after the May report. The upshot? There could be more fireworks than you might assume.
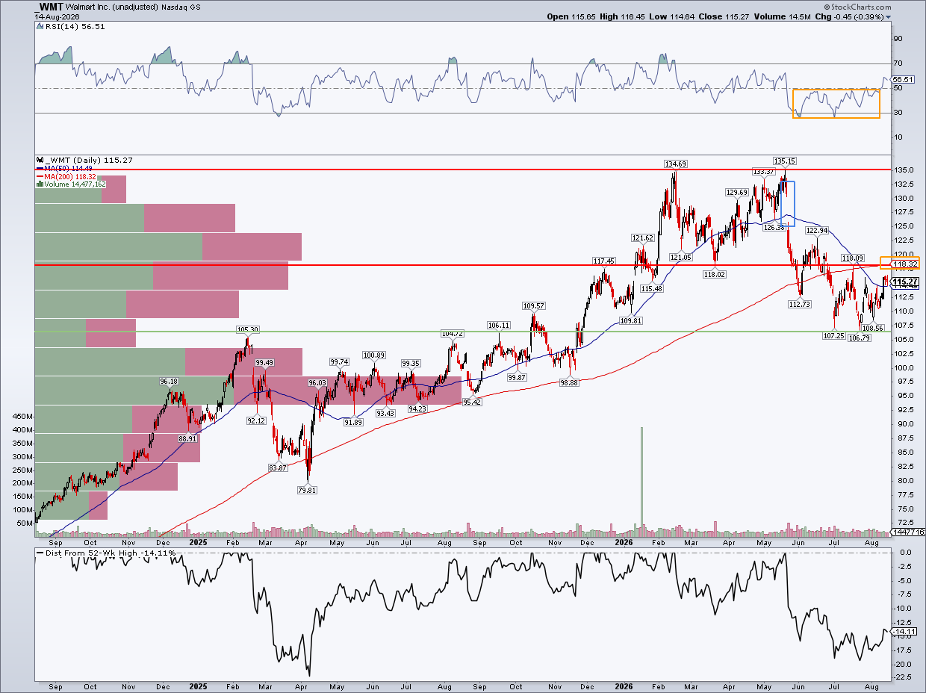
Elsewhere, the RSI momentum oscillator at the top of the SharpChart suggests optimism; it has broken to fresh highs, back to before the May earnings plunge. That’s good news for the bulls who hope to lift WMT from its current 14% drawdown from its 52-week high.
Calendar Trends Are Generally Neutral
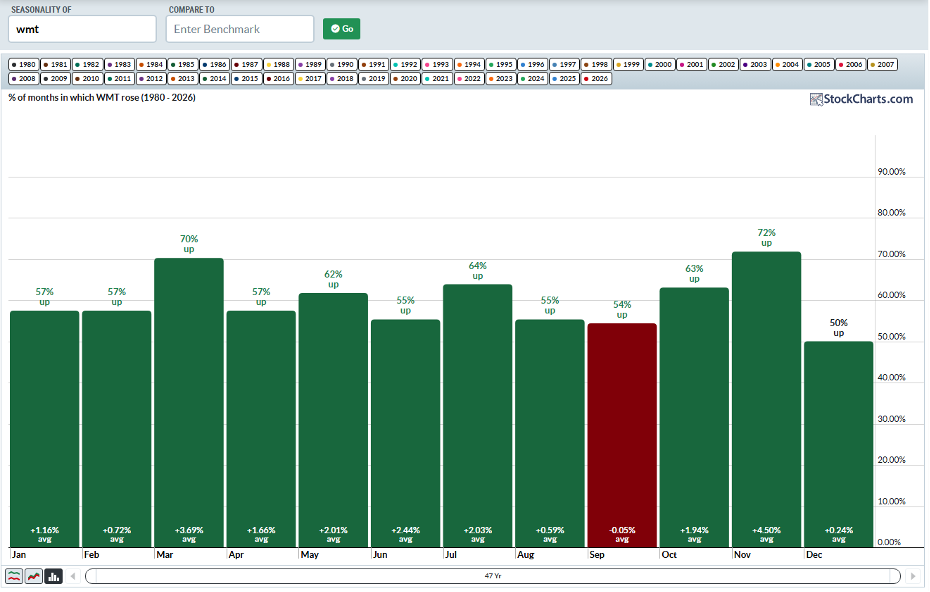
Seasonally, I encourage traders to check out our new seasonality tool, where there is more data and improved viewing options. For WMT, the August-to-September stretch hasn’t been overly dramatic through the decades. Since 1980, the average returns are +59 bps and –5 bps, respectively. Strong gains have come about in Q4, though.
XRT: Fits & Starts Among US Retail Names
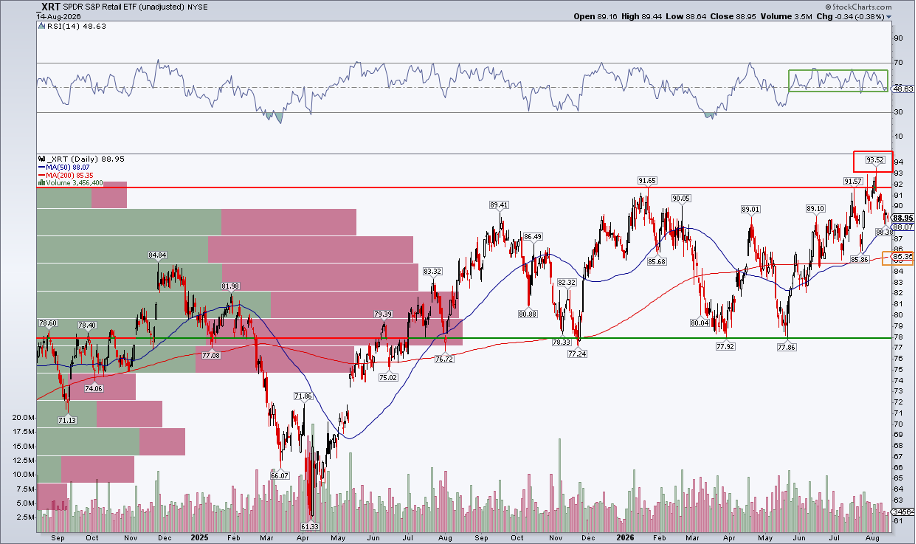
Bigger picture, retail stocks across the market-cap spectrum have been touch-and-go YTD. The SPDR S&P Retail ETF (XRT) comes into this summer earnings period with some shade. The local high of $93.52 (which was the peak back to early 2022) was sold into, and the fund is now testing its rising 50-DMA. Still, there was a bullish golden cross pattern a month ago, while RSI momentum is holding above 40 (often a bull/bear demarcation).
I’m not encouraged by a possible false breakout and, with a high amount of volume-by-price in the $75 to $90 zone, a further giveback would imply more choppy price action ahead. So this week will be key for XRT. A breakout through $92 and new multi-year highs would support the market-wide broadening trade.
Is the “K” Finally Breaking?
At a macro level, there are myriad factors influencing retail stocks and the consumer. A nearly frozen jobs market, healthy spending across income cohorts (the K-shaped economy shows signs of converging), and the wealth effect are tailwinds. As the back-to-school shopping season hits full stride, this past spring’s large tax-refund boost has largely played out. The biggest reported swing factor is arguably gas prices, so let’s wrap up there.
Autumn Relief at the Pump
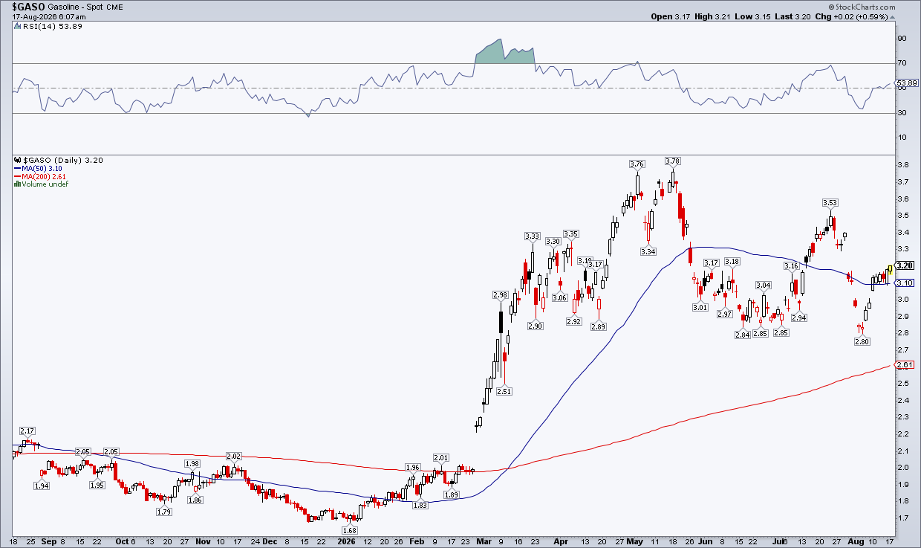
Gasoline futures ($GASO) ticked to MTD highs to begin the week, near $3.20. Add $0.95 to that to arrive at the expected national average in a few weeks. $4+ at the pump frustrates commuters, but there’s hope on the very near horizon.
The RBOB gasoline futures market is about to roll into the cheaper winter blend; the October contract is the first such month. Oct RBOB trades near $2.90, which may offer a modest reprieve (though still well above pre-war levels) starting in mid-September.
The Bottom Line
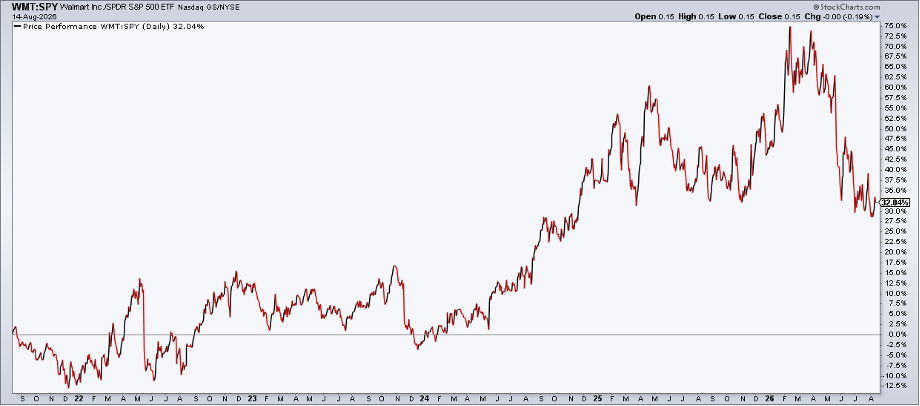
Retailer earnings are in play this week. The home improvement names, discounters, and big-box stores all serve up May through July numbers. WMT’s chart has turned south, with absolute and relative weakness since February, while the XRT retail ETF falls back from its mid-summer multi-year high.
Traders must focus just as much attention on retailers’ technicals as on the macro fundamentals right now, as the charts may offer the first clues on how the rest of the year plays out on the consumer spending front.
Disclaimer: This blog is for educational purposes only and should not be construed as financial advice. The ideas and strategies should never be used without first assessing your own personal and financial situation, or without consulting a financial professional.