Bond Bears Have the Upper Hand. Will Jackson Hole Change the Trade?
Key Takeaways
- Treasury yields remain elevated ahead of this week’s Jackson Hole Economic Policy Symposium, with 5.18% on the 30-year yield emerging as a key level from an intermarket technical perspective.
- PCE inflation and NVIDIA earnings offer near-term equity catalysts, but neither is likely to move markets as much as Friday’s Fed speech.
- Bond-market volatility is tame, suggesting traders are not yet bracing for a major shock in spite of rising long-term yields.
The final full week of August used to be a sleeper on Wall Street, but that's not the case anymore. Amid plenty of fiscal drama, a precious metals and crypto breakout, and stocks holding within earshot of record highs, traders are eyeing the next catalyst. And we might be getting that from a few places.
Following today's presser from Treasury Secretary Scott Bessent, July PCE inflation data hits Wednesday morning, followed by Q2 results from NVIDIA (NVDA). Let's double-click on that for a moment.
NVDA Check-In: Trendless
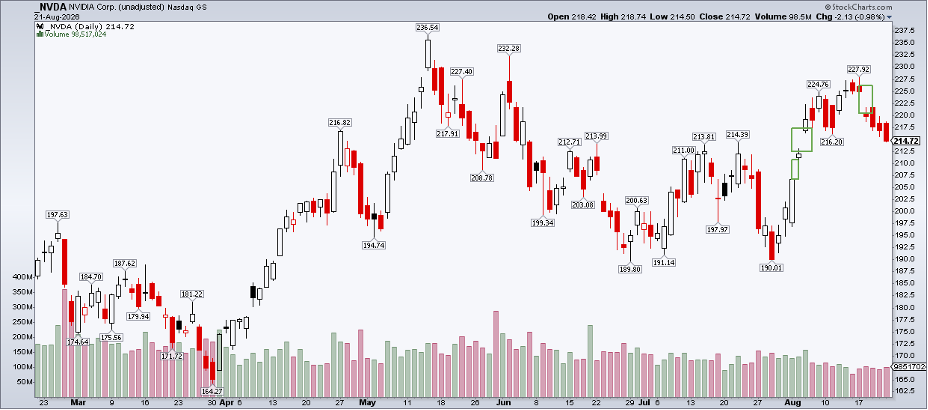
The latest options pricing suggests a 5.2% earnings-related stock price swing for the world's largest company. As I detailed last week, betting on a big NVDA move has been a losing strategy over the last two years. I still see technical upside, but shares are down six sessions running coming into the week (their longest losing streak since the 2022 bear market) and continue churning below the May 14 all-time high.
The upshot: NVDA has turned trendless. Traders must seek other potential sparks.
Key Data: July PCE Price Index On Tap
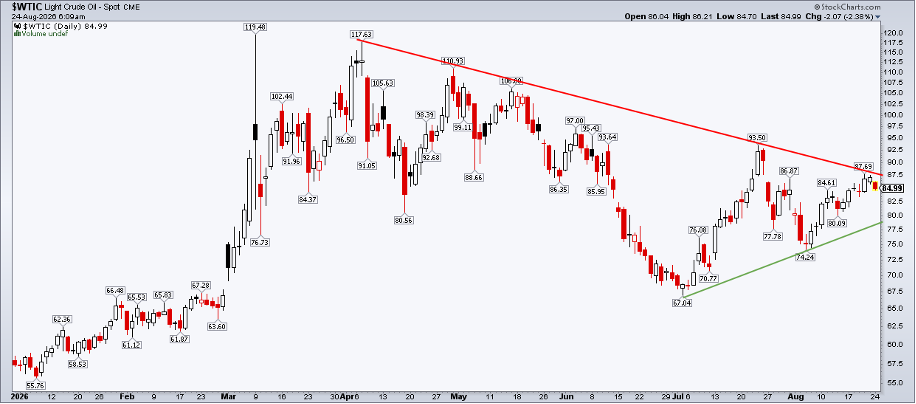
PCE inflation, as is routinely the case, rarely stuns analysts. With July CPI and PPI reports in hand, they have a pretty good bead on where the Fed's preferred inflation gauge will land, both at the headline and core levels. And while oil has rallied from $67 in early July to $85 today, consolidation has been the recent theme, rather than explosive advances.
Spotting Bond Bears in Jackson Hole
Friday morning could be when action strikes. Fed Chair Kevin Warsh will speak from the shadows of the Grand Tetons in Jackson Hole, WY, at 10 a.m. ET. The rookie FOMC chair follows notable addresses from former Chair (now Governor) Jerome Powell. Recall his "painful" eight-minute missive in 2022, warning households that the Federal Reserve had no choice but to continue hiking interest rates to quell inflation.
The following year's vibes improved, but were still uncertain, put poetically by Powell when he said the Fed was "navigating by the stars under cloudy skies." In 2024, Jay teed up what would become a series of (now controversial) policy rate cuts in September, October, and December of that election year.
Fast forward to today and the bond market indeed tests Chair Warsh. We see that both fundamentally and technically, but let's, of course, focus on the latter.
Setting the Rates Storyline Straight
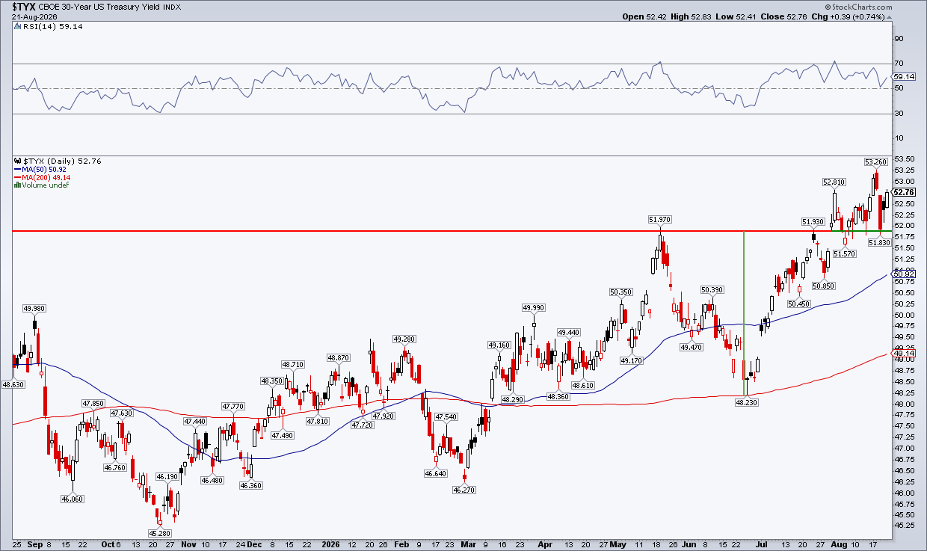
Notice in the chart below that the 30-year Treasury yield ($TYX or $UST30Y), like stocks, is holding near its high. A breakout occurred following the July FOMC press conference, with the long bond's rate stair-stepping higher to a 5.326% peak.
The telling move, so far, wasn't so much the high-water mark, but where the 30-year met support in recent sessions. The polarity principle was at play, meaning that former resistance became new support. Treasury bears defended 5.18%, so that's the macro bogey right now. A dip below that and it might be risk-on for stocks leading into and after Jackson Hole.
Price Matters, and So Does Volatility in Treasuries
All that said, I wouldn't be surprised to see the 30-year yield coil, then make its move after 10 a.m. Friday. It's somewhat steady, right smack in the middle of the range to begin this week near 5.25%. What's interesting is that, despite the long-term rate's breakout, implied volatility remains somewhat muted. Hopping over to the OptionsPlay Strategy Center, we find that the iShares 20+ Year Treasury Bond ETF's (TLT) implied volatility is a mere 11%.
For perspective, the figure reached a March zenith above 16%. Expected volatility over the next 30 calendar days is very average, as is historical volatility. The point? Unlike story stocks and earnings movers, the market doesn't anticipate sharp moves either way in TLT or the 30-year Treasury rate (despite all of the dramatic news stories regarding the national debt and supposedly unstable long-term yields).
Don't Forget About the 10-Year
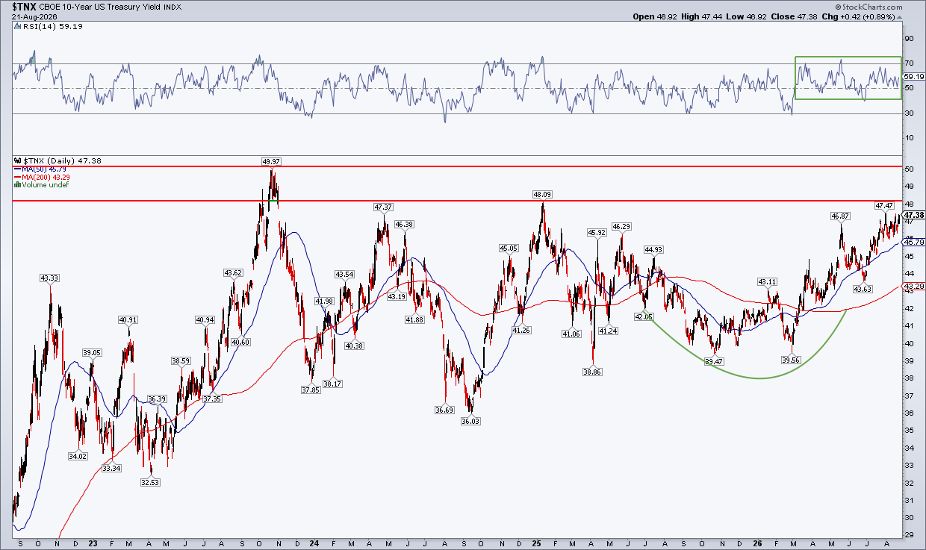
The long-term rates certainly matter, but they're less active than the belly of the curve. The benchmark 10-year Treasury rate ($TNX or $UST10Y) still has a ways to go to scale its October 2023 cycle high of 4.997%. A quarter-point away, the near-term trend is clearly higher, after briefly sporting a 3-handle immediately before the Iran war. Both its 50-day and 200-day moving averages are on the rise, suggesting that bond bears control the price trend, while the RSI momentum oscillator at the top of the SharpChart holds in a bullish range between 40 and 80 (remember: bond prices and yields move in opposite directions).
The next stop would appear to be the 4.809% January 2025 peak, while a breakout through 5% would likely get the bears' attention on an intermarket basis.
The Bottom Line
The bond bears sport some swagger leading into Jackson Hole. This Friday's major macro event will no doubt keep the Treasury market's attention. Still, implied rate volatility is in check, and stocks have done totally fine with steadily climbing global yields. The cliché probably holds water right now: It's not the level of rates, but the speed and direction that matter. Watch 5.18% on the 30-year in the near term, while 5% on the 10-year might get more airtime as Q4 nears.
Disclaimer: This blog is for educational purposes only and should not be construed as financial advice. The ideas and strategies should never be used without first assessing your own personal and financial situation, or without consulting a financial professional.