AI Slowdown Ahead: Are Chip Stocks Heading for a Deeper Selloff?
Key Takeaways
- SMH’s symmetrical triangle is nearing a key technical test around $540.
- A breakdown could expose a steep air pocket toward $427, with $479 as a key Fibonacci level.
- AI uncertainty, September seasonality, this week’s FOMC decision, and Friday’s triple witching could boost market volatility.
It’s Fed Week on Wall Street, but chip stocks are in focus following a coordinated effort by tech executives to tap AI’s brakes. You can read all about comments from Anthropic CEO Dario Amodei, along with support from Elon Musk and OpenAI boss Sam Altman (who ruled out a 2026 IPO), but price action tells the early tale. The VanEck Semiconductor ETF (SMH) plunged more than 4% to kick off options-expiration week, also a stretch that is light on stock-specific volatility catalysts.
A Summer Consolidation Could Be About to End
Let's jump right into the chip trade. Notice in the chart below that SMH enters mid-September still in consolidation mode. It has been a major summer swoon, as the ETF peaked on June 22, bottomed six weeks later amid the Situational Awareness hedge fund fire-sale rescue by Ken Griffin’s Citadel, and then went on to put in a series of lower highs and only modest dip-buying on pullbacks.
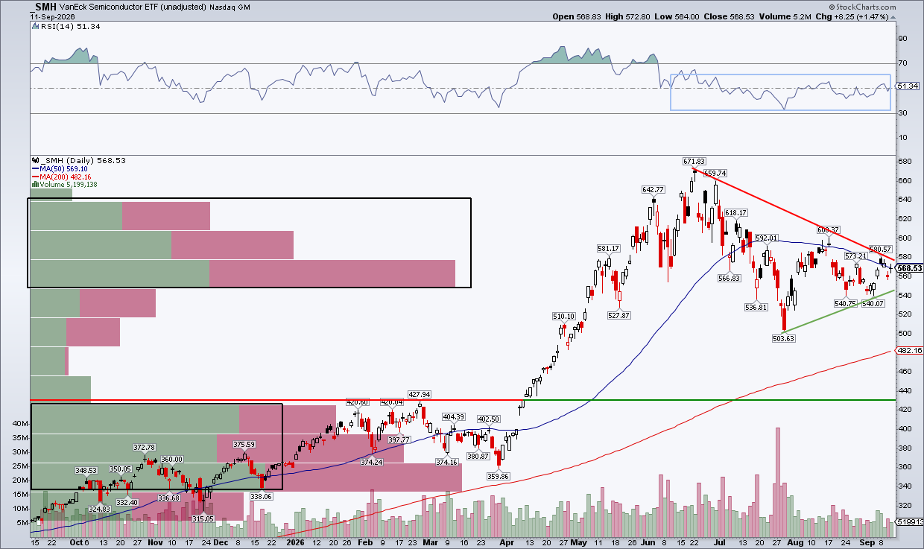
Overall, it’s a classic symmetrical triangle, a feature I detailed with WTI crude oil ($WTIC) at the start of the month. The pattern is generally considered a “continuation” feature, meaning that price should resolve in the trend of larger degree, which would be higher in this case. Still, a bearish breakdown cannot be dismissed, particularly as SMH trades near $545, testing the uptrend support line.
Also look at the near-term 50-day moving average. It’s on the decline, suggesting that the bears control the immediate trend. The chips ETF has struggled to hold rallies above that short-run indicator line. The long-term 200-day moving average, meanwhile, remains on the rise, pointing to a sustained broader uptrend.
Why Volume Matters
Other indicators provide clues on where price will go. And what should particularly concern the AI bulls is that there’s now a high amount of volume-by-price above today’s level, which will presumably make rally attempts tough on the longs. We see several shares traded between $540 and $640, increasing the chance that the summer choppiness will turn out to be a bearish distribution.
On the downside, there’s a significant volume air pocket from $540 down to the Q1 range high of $428. In short, it wouldn’t take much selling to see SMH fall sharply now through year-end, potentially erasing a chunk of the March 30 to June 22 surge. The polarity principle asserts that $428 would attract buyers, however.
SMH: $479 Could Be In Play Sooner Than Traders Think
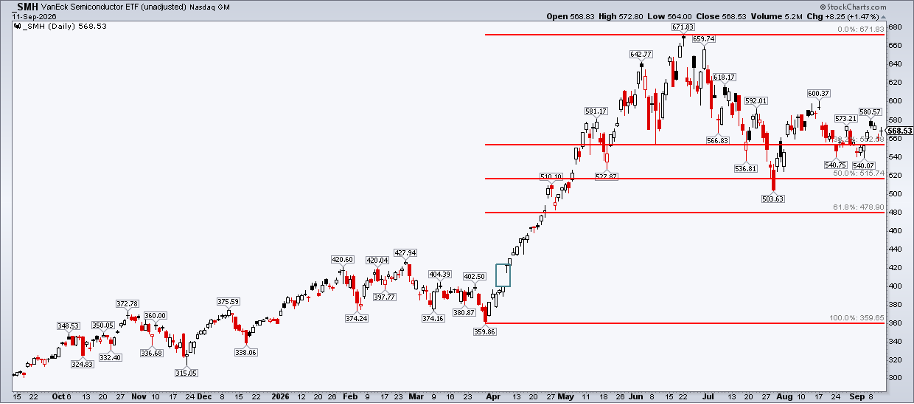
Now, let’s clear the chart and apply Fibonacci retracement lines. SMH actually gave back more than half of the aforementioned rally during the mid-year momentum trade's unwind. The 61.8% Fibo retracement is untested, though, currently at $479. Such a plunge would clear out weak hands and stops below the July nadir. Upon an even more violent decline, the April 8 gap lingers at $399.9.
Seeing September Red
Big picture, it’s spooky season in the stock market. The second half of September is notoriously the worst on the calendar. Goldman Sachs notes that the median two-week return starting in the middle of this week is –0.5% in data back to 1950. Citadel Securities’ Scott Rubner put out a viral chart last month, calling out how bearish pre-midterm activity has, on average, reached a crescendo on September 30.
While seasonality comes second to price, this is the time of year when slip-ups tend to happen. Of course, Carson Group’s Ryan Detrick has repeated that September is much less scary when the S&P 500 is in an uptrend and has posted solid YTD gains.
The Market’s One Big Trade
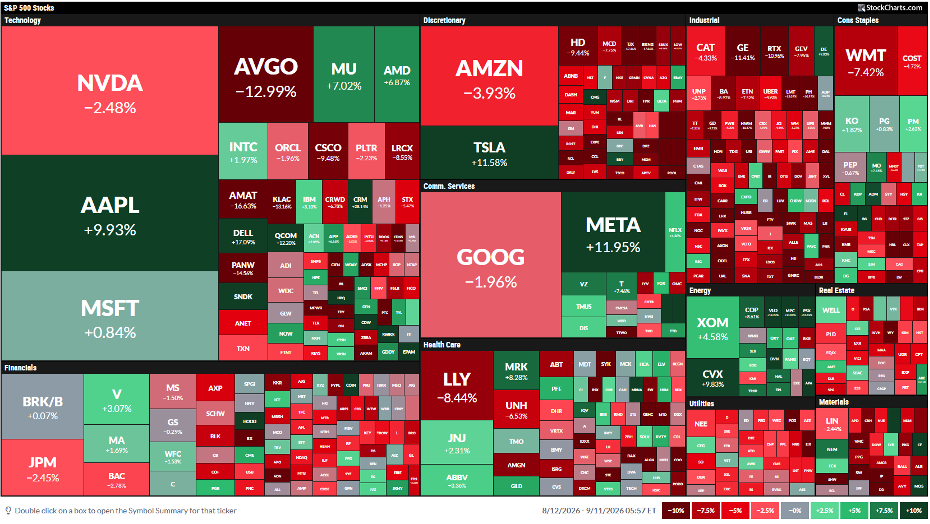
Yes, there are many ways to slice and dice this, but cap-weighted U.S. large caps hinge on how the likes of NVIDIA (NVDA), Broadcom (AVGO), and Micron (MU) trade. Emerging markets, as well, are increasingly driven by Taiwan Semiconductor (TSM), SK Hynix (SKHY), and Samsung. Even Europe has material AI exposure through ASML (ASML) and Arm Holdings (ARM).
And then there are the domestic data center/power plays in the badly lagging Industrials sector. Caterpillar (CAT), GE Vernova (GEV), Eaton (ETN), Vertiv (VRT), and fresh S&P 500 entrant Bloom Energy (BE) trade heavy, too.
Sector Rotation & 2026’s Market Seesaw
The saving grace, so far, is this year’s enduring intramarket dispersion. Goldman notes that the S&P 500 realized average stock correlation remains on the mat. That feature helps prevent so-called “washout” days in which 90% or more of S&P 500 stocks fall at once. Indeed, Monday’s internals were not bad, with Energy, Consumer Staples, Utilities, Health Care, and Financials posting green in the early going.
Tools of the Trade
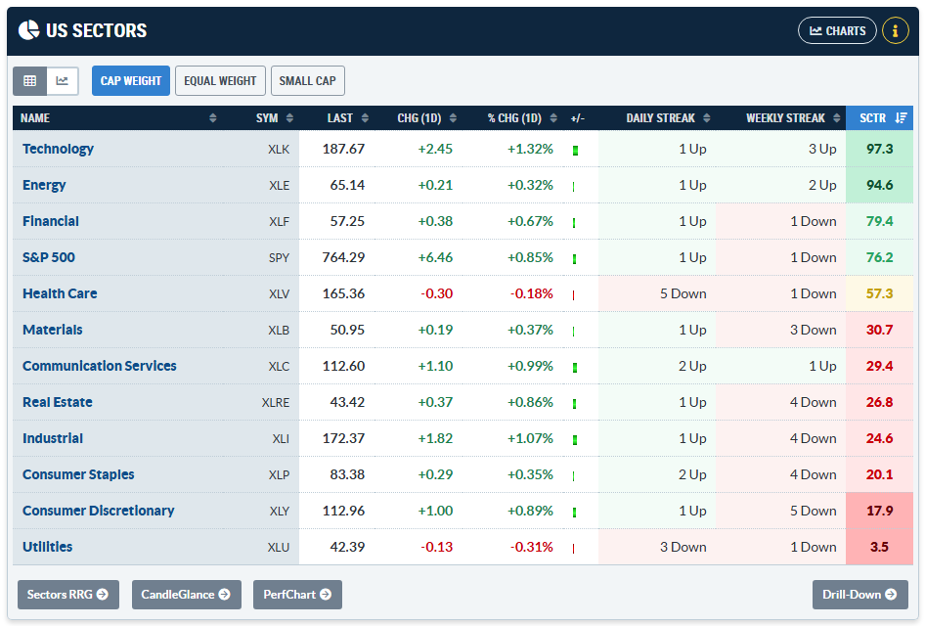
I encourage traders to be on the lookout for sector rotation shakeups. For that, there are two places to monitor. The first is StockCharts’ RRG Charts. The scatter plot look helps you identify leading, lagging, improving, and weakening areas of the market (not just the 11 S&P 500 sectors, either).
Second, and this is more in the “keep it simple” camp, you can interpret sector ETF trends on the Market Summary page. Scroll down halfway and you’ll see the US Sectors box, which includes daily & weekly winning streak data, along with sector SCTR scores (a key measure of momentum). I review these data at the close each session.
The Bottom Line
SPX gains are going to be capped so long as SMH coils. A rally through $600 would be bullish for the global chips ETF, but chances grow that a bearish breakdown could be in the works... now almost three months removed from the ETF’s all-time high. Rosh Hashanah began last Friday, and the back half of September can be treacherous. AI dominates the headlines, and the Fed decision looms, but watch price first.
Disclaimer: This blog is for educational purposes only and should not be construed as financial advice. The ideas and strategies should never be used without first assessing your own personal and financial situation, or without consulting a financial professional.