Stocks Stumble Into CPI Day and Fed Week as September Scaries Arrive

Key Takeaways
- September weakness has spread, with RSP, retail, transports, and several cyclical & defensive areas flashing technical warning signs.
- Rising oil prices and interest rates are pressuring economically-sensitive areas as investors brace for CPI and the Fed.
- Key technical levels have given way, raising the possibility that a broader seasonal September pullback is underway.
September has shown its true colors in recent days. Both the Dow Jones Industrial Average ($INDU) and the Invesco S&P 500 Equal Weight ETF (RSP) were red three days running, just a day before the August CPI report. The two blue-chip measures posted their worst three-day losing declines since last March. Blame it on higher oil and rising rates, I suppose. Traders remain focused on geopolitical developments between the U.S. and Iran and are braced for at least a warm inflation report on Friday and a potential Fed rate hike on Wednesday, the 16th.
There’s no apparent path to a resolution in the Middle East, while global yields just keep creeping higher. All of it appears to be taking a toll on economically-sensitive spaces. For RSP specifically, the holiday-shortened week may have turned technically costly.
RSP Loses Its Rate of Trend
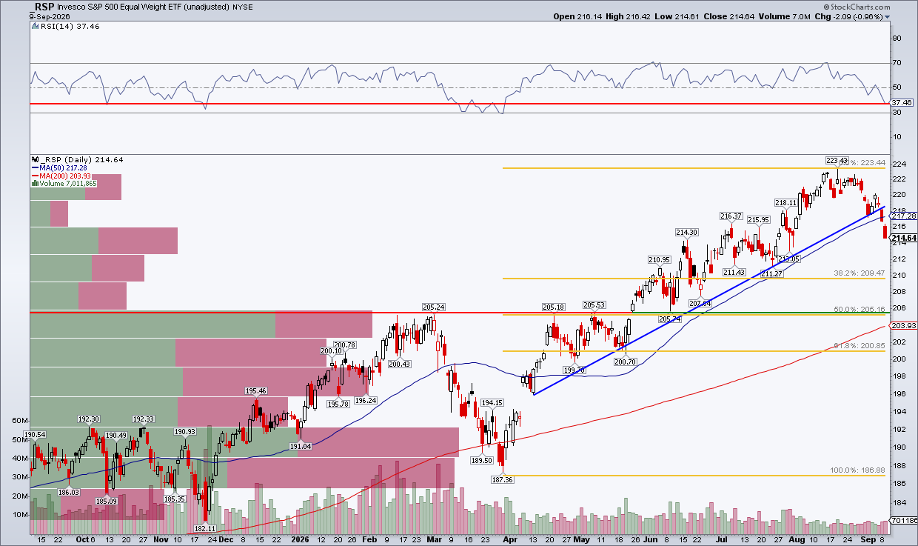
Notice in the chart below that RSP broke an uptrend support line that dated back five months. Tuesday and Wednesday price action was outright bearish, with smallish red marubozu candles and a breach of RSP's 50-day moving average. What’s more, the RSI momentum oscillator at the top of the SharpChart sank to its lowest level since the late-March YTD low. Is a broader SPX EW dip now underway, right on schedule (seasonally speaking)? A few sector and industry ETFs are pointing in that direction.
Pain at the Register
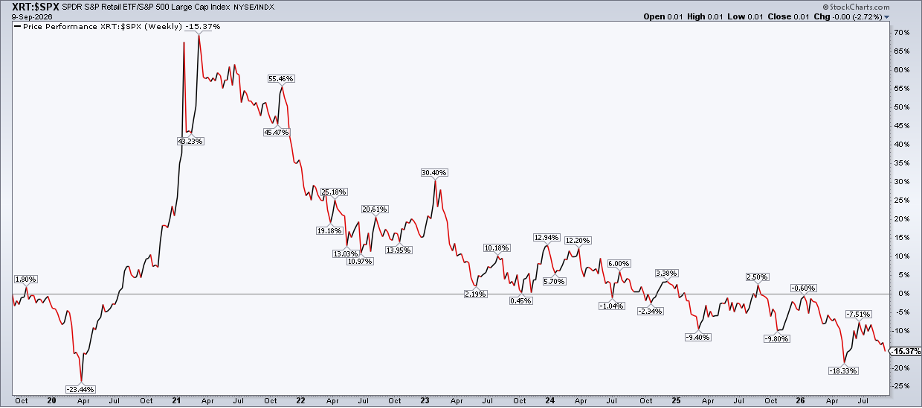
Amid RSP’s rate of trend break, you won’t find a messier chart than that of retailers. The SPDR S&P Retail ETF (XRT) shed 3.8% between Tuesday and Wednesday, tallying its worst settle in more than three months. Specialty consumer company Q2 earnings reports continue to trickle in, and it has been a mixed bag in terms of overall household spending trends and executives' outlooks.
If you zoom out the chart and plot it against the S&P 500, you'll find there is a clear downward trend. XRT has been lagging the SPX for more than five years, and the latest run-up in energy prices and interest rates appears to be the latest negative catalyst.
Transports Hit a Pothole
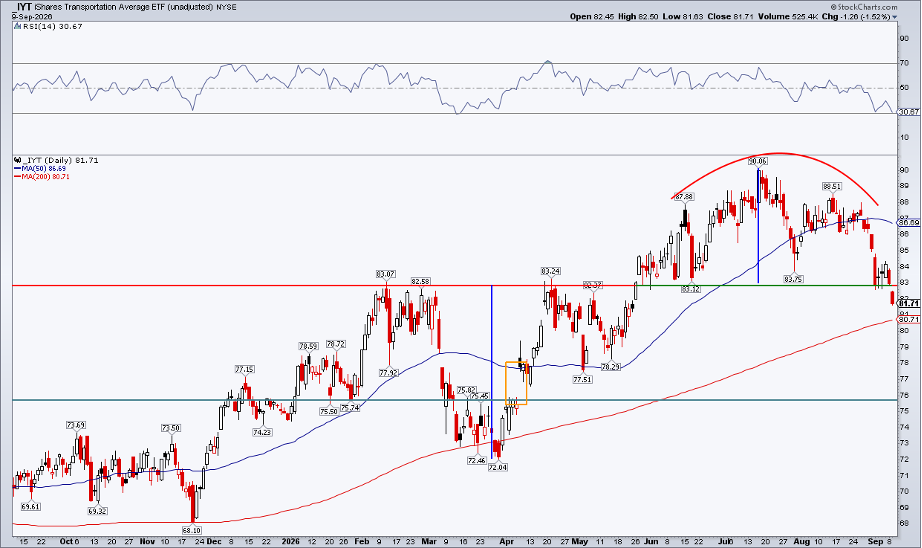
Transports ride the pain train, too. The iShares Transportation Average ETF (IYT). Dow Theory enthusiasts should look away, as the one-year look will certainly spark the September scaries. A bearish rounded top feature was confirmed on Wednesday with a breach of the $83 level. Even novice technicians can identify a head-and-shoulders reversal signature, and the measured-move downside price objective is $76, based on the distance from the neckline to the $90 July peak, with that $7 range subtracted from $83 (that would be a tidy early-April gap fill, too).
Also consider that the opposite pattern played out over the first half of the year, with a $91 target almost tagged earlier in the second half. IYT’s RSI is now very close to a 52-week low, with its rising 200-DMA in play ahead of CPI and the Fed. Once again, oil bulls are having a field day from the short side with domestic transport names.
No AI Love for Industrials
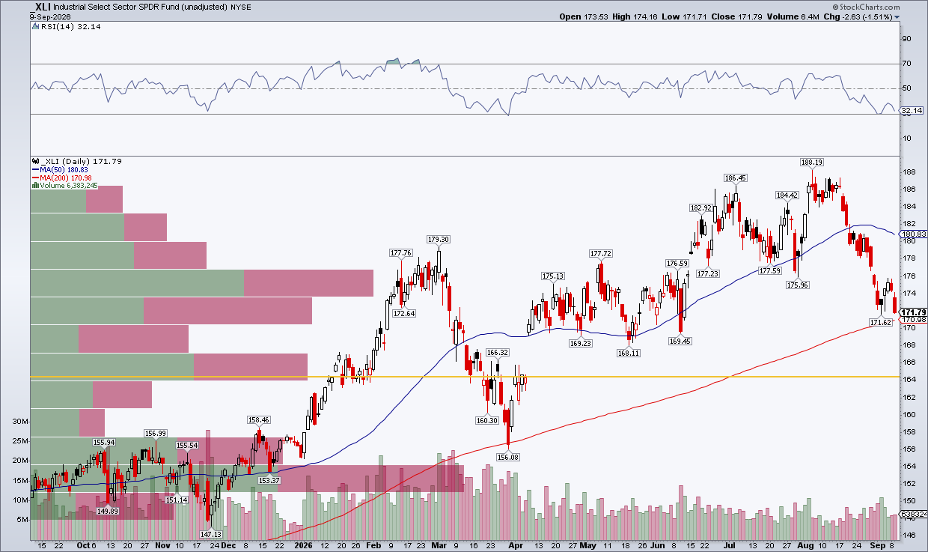
The skittish list goes on, unfortunately. I recently opined on the Industrials Select Sector SPDR Fund (XLI), and it’s worth a brief update. Naturally, with transports tanking, XLI is under pressure.
The added wrinkle in the past month is that AI has turned from a tailwind to a headwind for this cyclical sector. Stocks like Caterpillar (CAT), GE Vernova (GEV), and Eaton (ETN) have been on the offer for much of the summer, whereas the industrial-AI trade was red hot in 1H. Aerospace & Defense has nosedived; conglomerates can’t catch a bid; and airlines have taken a bearish trip. Thank you, $100 Brent and record ULSD prices. XLI is flirting with correction territory, too.
Real Estate Takes the Staircase Down
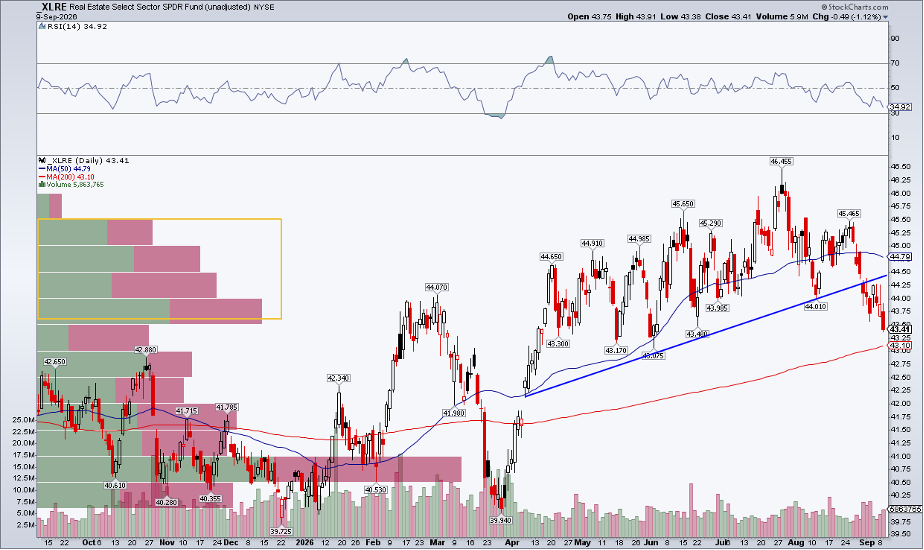
Elsewhere, there's more red on the screen. The Real Estate Select Sector SPDR Fund (XLRE) hasn’t been stung as much by rising energy as by steadily rising interest rates. XLRE and REITs writ large looked great as the calendar flipped to the second half. It has been a different story with autumn on the doorstep.
XLRE was down nine of 10 sessions coming into Thursday. CNBC’s Michael Santoli has spoken of the market being primed (perhaps overly so) for hawkish data and Fed action, and, with Real Estate on the verge of testing its 200-DMA, price action agrees. Noteworthy here is that a significant amount of volume-by-price now hovers above the current level.
And then there’s Consumer Staples. Another defensive sector is on its back foot. Same macro catalysts. The “safer” slate of consumer stocks finished Wednesday under its 200-DMA for the first time in eight months.
Bad Breadth, Bellwether Groups Trade Heavy
Big picture, just 38.2% of SPX stocks trade above their respective 50-DMAs, the fewest in five months. I assert that we’ll find out the next leg soon, perhaps post-CPI this week or by the close on Fed Day.
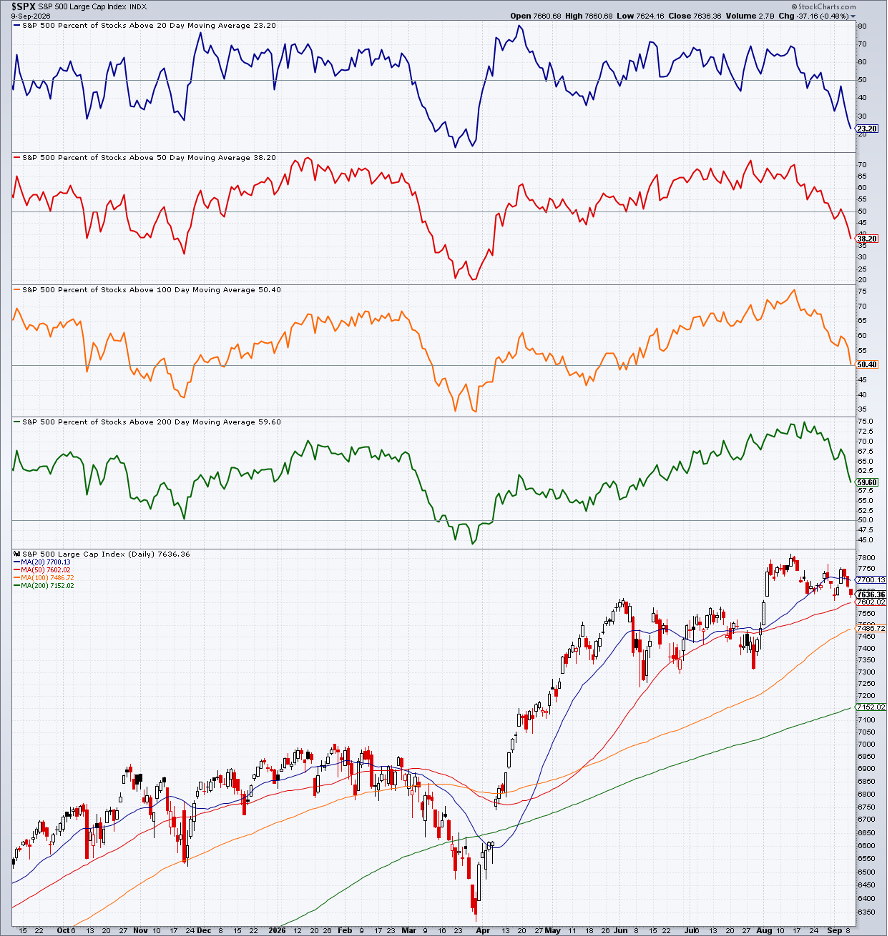
As for the winners of late? Energy is +14% m/m, while Health Care is barely green. Tech is flat, and the SPX has shed a modest 1.4% from a month ago. Regional banks, semis, and homebuilders are other lagging bellwether groups.
The Bottom Line
US stocks are limping into CPI Day and Fed Week amid a relentless offer in global bonds. Earnings season is done; the conference calendar is packed; and concerning charts appear right on cue with this part of the calendar.
If you enjoy learning about the stock market, you'll love our Articles & Videos page. It's packed with approachable insights and charting guidance.
Disclaimer: This blog is for educational purposes only and should not be construed as financial advice. The ideas and strategies should never be used without first assessing your own personal and financial situation, or without consulting a financial professional.