Post-Labor Day Playbook: Hot Commodities, Cooling AI, And Higher Rates' Impact

Key Takeaways
- Copper and commodities remain big, fueled by the AI buildout, geopolitical risks, weather disruptions, and rising global shipping costs.
- Stocks hold near records but with ebbing momentum, while higher yields pressure small caps and other rate-sensitive areas.
- September brings fresh catalysts, including inflation data, Fed policy, and major tech conferences.
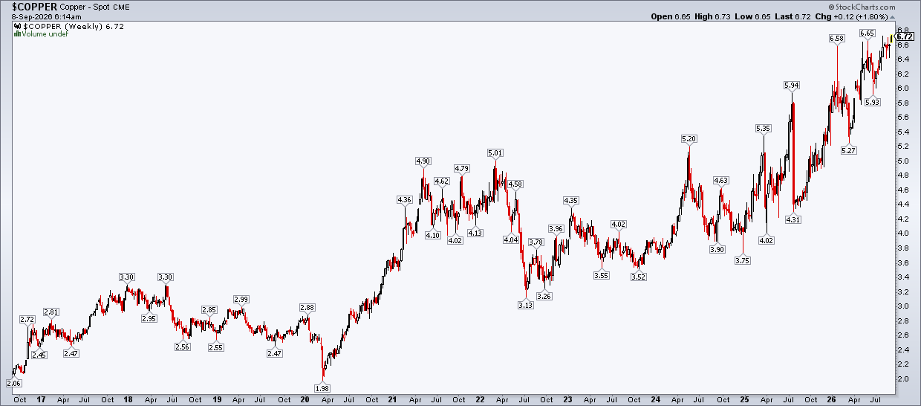
LME copper climbed to record highs as Americans enjoyed their Labor Day respite. With less than two weeks of summer left, it has been a season to be long commodities. Brent crude oil draws closer to $100, domestic retail gasoline prices are at record levels for this time of year, and wild price action in the grains market has kept futures traders busy managing risk.
A Perfect Storm for Commodities
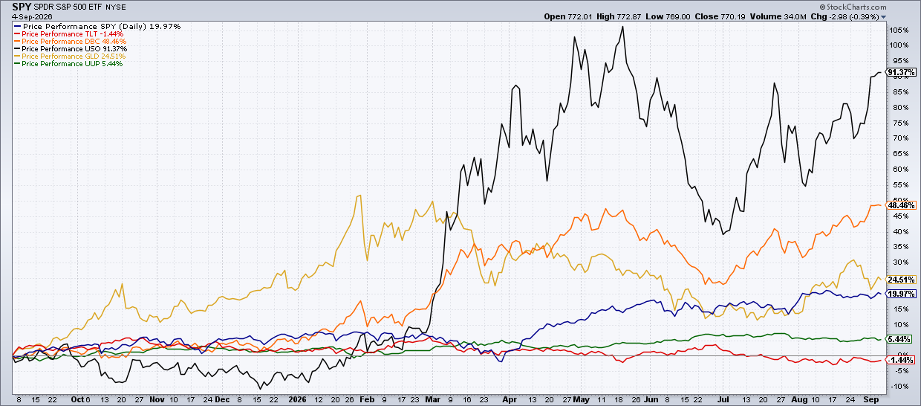
We have a confluence of factors supporting the raw materials space. The conflict in Iran, now enduring for more than six months, is front and center, along with the de facto Strait of Hormuz closure. While tankers are creative in transporting oil out of the Middle East, it's a tall and costly task compared to a year ago. Insurance rates are up, along with global shipping fees.
Mother Nature is adding her own risks to the commodities space. What could be the most powerful El Niño event in recorded history has been triggering severe drought in Africa, weak monsoon seasons in India and Southeast Asia, and dry weather in South American growing regions. Florida homeowners aren't complaining, though, as this year's Atlantic hurricane season is pacing to be among the five calmest on record dating back to the 1800s.
The Tariff Man Appeareth Once Again
President Trump adds his own set of wildcards. The "Tariff Man" appears back on his front foot, unsettling what's already a precarious global trade situation. Now with less than 60 days until the midterms, rumors swirl that the GOP-controlled Congress will move to put forward a pre-election stimulus package.
There's a lot of macro noise (with perhaps some signal). For traders, price action has actually been straightforward lately. Stocks are near record highs but no longer on a clear path upward, just as global yields steadily (not sharply) ascend. Commodities are seemingly moving in lockstep with rates (which is textbook during inflationary intermarket regimes), while the dollar is keying more off apparent "yenterventions" in Japan.
AI Takes a Summer Breather
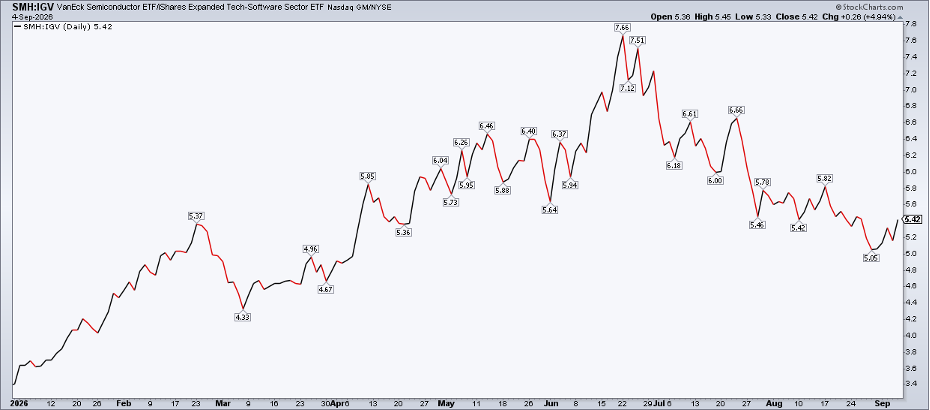
As for the AI mega-theme, it's sort of on pause. I monitor the ratio chart of the VanEck Semiconductor ETF (SMH) against the iShares Expanded Tech-Software ETF (IGV). We can see chip stocks continue to retreat off their relative high notched on June 22, yet another summertime trend that just won't budge. With NVIDIA (NVDA) and Broadcom (AVGO) earnings reports in hand, traders are searching for new catalysts.
Sparks could fly this week: the Goldman Sachs Communacopia Technology Conference 2026 will get underway today in San Francisco, followed by IBC 2026 on Friday. NVIDIA is slated to present at both events, with three more corporate gatherings for Jensen Huang and the team before Q3 is out. Apple (AAPL) is in play, as well, with its new iPhone launch on Wednesday, though shares tend to struggle around such releases.
Fed Watch & Volatility Implications
And then there's the Fed. Last Friday's strong August jobs report nudged bond traders toward pricing in a rate hike when the FOMC convenes Tuesday next week. There remains a slight lean to a hike when the statement publishes at 2 p.m. ET Wednesday, September 16. I'm not sure it really matters; just look at bond volatility.
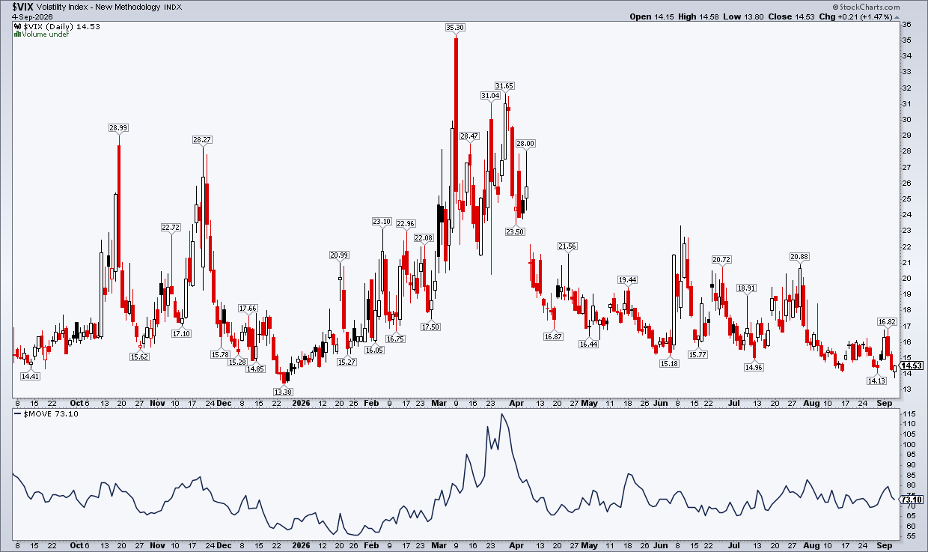
The ICE MOVE Index ($MOVE) settled at a soft 73 last week, well below the one-year range's midpoint. What's more, the Cboe Volatility Index ($VIX) still appears stuck in summer mode, wobbling in the mid-teens amid a slew of macro volatility catalysts.
Checking on the Market's Innards
Now let's get more granular.
I want to guide you to StockCharts' Market Summary page. Toggle the Timeframe button to the One Month detail. Scroll through the revealing nugget and you'll see that the rates backdrop may be doing more market heavy-lifting than first thought.
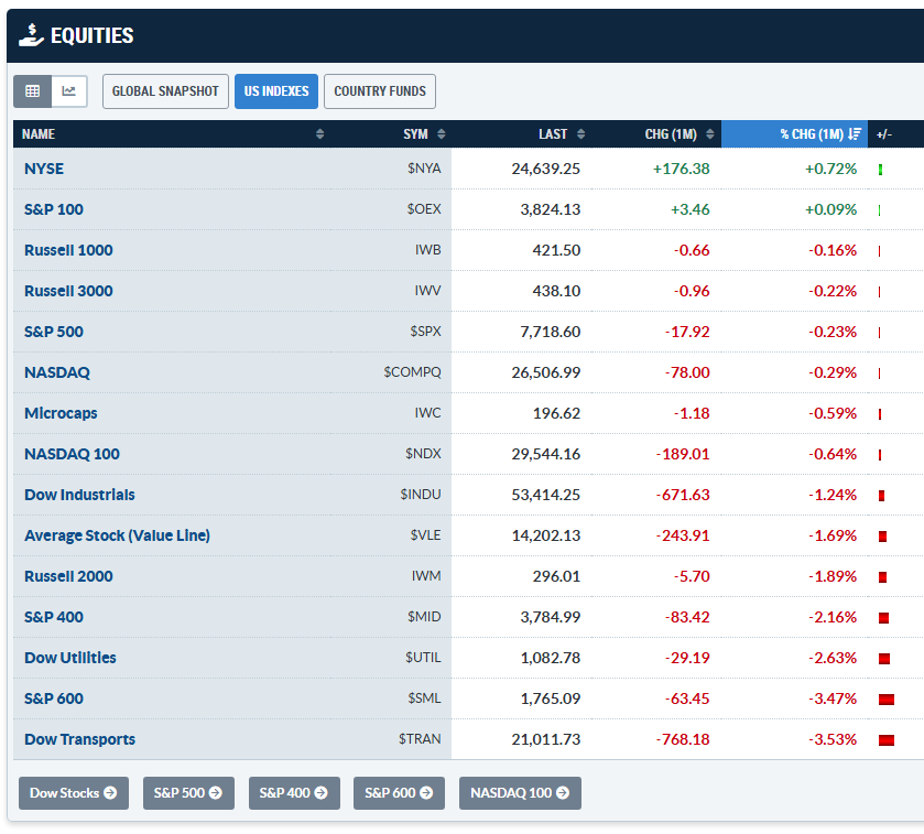
Since August 8, the most yield-sensitive areas have fared the worst. On the US Indexes view under Equities, only the NYSE and the S&P 100 are green, while the cyclical Dow Transports and debt-reliant SMID caps are materially in the red. The Average Stock (Value Line) is now below its 20-EMA, too.
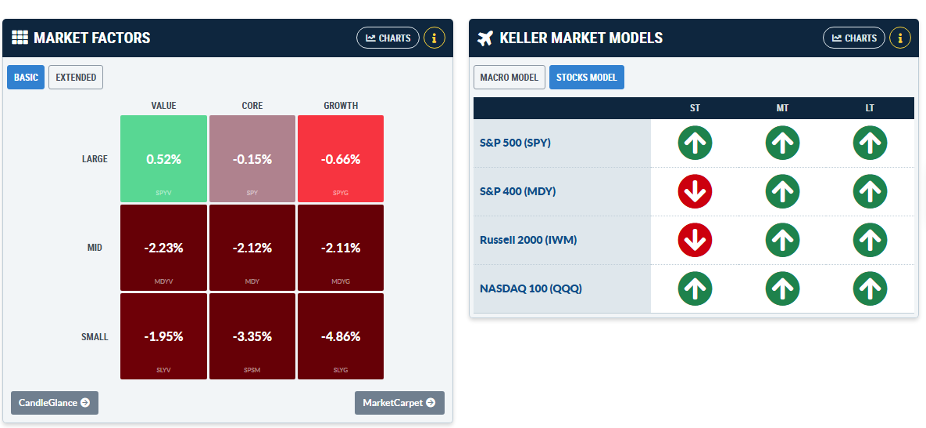
Next, the Market Factors performance box illustrates the point. Domestic small- and mid-cap stocks are deep red, with only US large-cap value marginally higher. Not the best setup heading into Rosh Hashanah this Friday. On the right, the S&P 400 (MDY) and Russell 2000 (IWM) flipped to down arrows, per Keller's Market Model.
A Few Weak Spots
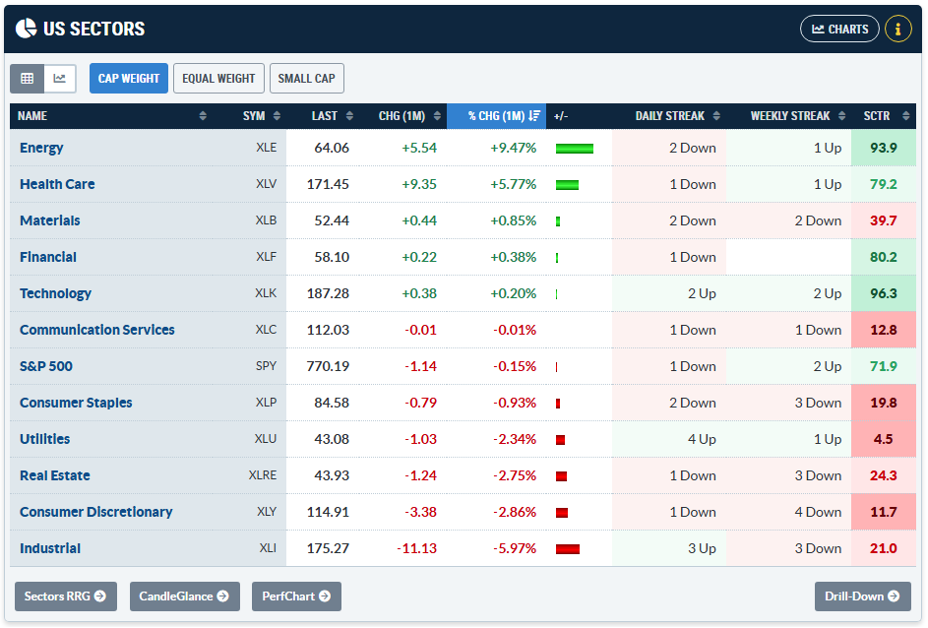
I encourage traders to dig into the Breadth tools and Bullish Percent Charts, but I will wrap up with a sector overview. Over the past month, economically sensitive sectors such as Industrials (XLI) and Consumer Discretionary (XLY) have traded sloppy. The former is down almost 6%, dragged by Machinery names and Aerospace & Defense, and the latter has been stung by downright bearish action in travel stocks, apparel/retail, home improvement stores, and other retail tape-bombs of late.
Oil & Gas, Pharma Alpha
What's working? Energy tallies one record high after another; Health Care is on a heater (with hardly any help from stalwart Eli Lilly (LLY), making its gain all the more impressive, in my view), and Materials is holding up (despite its weak longer-term SCTR score). Circling back to what I mentioned at the onset, copper and other resources are broadly up and to the right.
The Bottom Line
Investors often need a reset and an intramarket check-up coming off a holiday weekend. Seasonality is notoriously weak over the balance of the month. Still, there are pockets of strength across asset classes and within sectors. An active week of inflation data and industry conferences will keep macro analysts and equity traders busy.
Get the full market story in one stop. Visit the Market Summary page to see what's leading, what's lagging, and what's quietly shifting beneath the surface.
Disclaimer: This blog is for educational purposes only and should not be construed as financial advice. The ideas and strategies should never be used without first assessing your own personal and financial situation, or without consulting a financial professional.