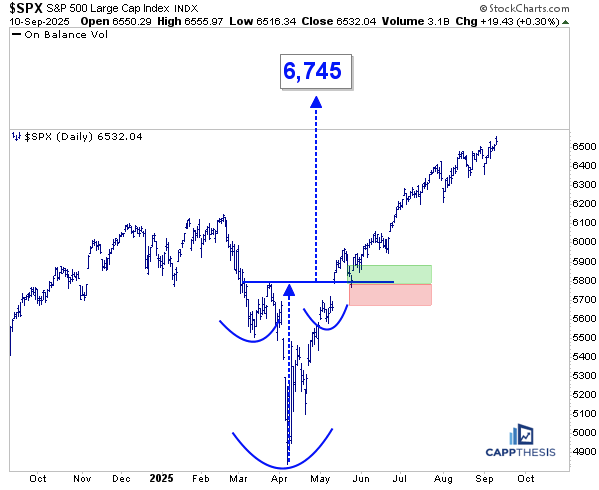
6,555 Target Hit!
Almost immediately on Wednesday, the S&P 500 reached the 6,555 level — our upside target from the inverse bullish head-and-shoulders pattern triggered on May 12. Notably, the gap that initiated the breakout was never filled, meaning the breakout zone wasn't truly retested. We highlighted this at the time, marking the risk zones during the first few weeks of the move.
Hitting this target is a significant achievement, especially given how lofty the level appeared when we first published it. At the time, we received some pushback, and understandably so — the target was not only well above the most recent highs but also seemed like a stretch from where the market was trading then…
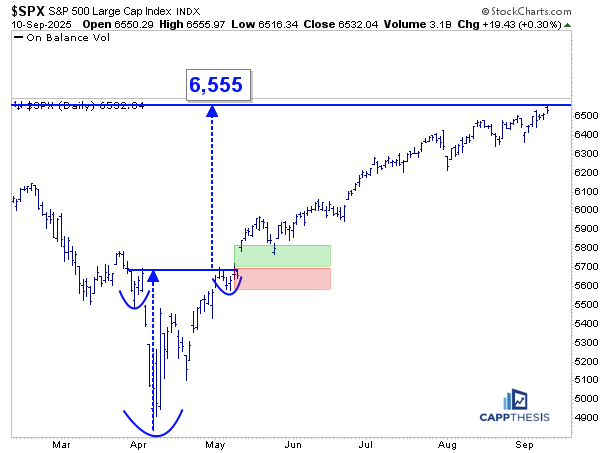
Not to mention, at the time the S&P had already advanced 18% in just four weeks from the April low — a huge move in a short span. That made it pretty hard to envision a price target more than 15% above the then-current levels (near 5,700).
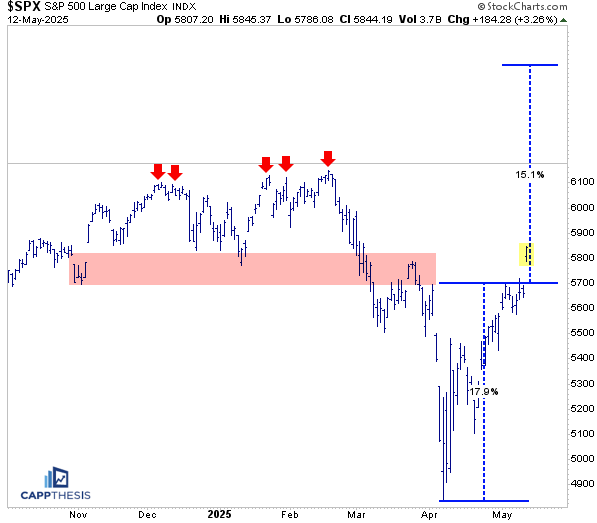
Adding to the doubts, the 5,850-zone looked like formidable supply. The index had failed there in March, breaking down through that same area earlier in the month, and it had also stalled there in January 2025, as well as November and December of the prior year. These repeated failures made it reasonable to expect the pattern not to work. On top of that, the S&P soon hit overbought territory for the first time.
Even if it managed to clear 5,850, the 6,100-area was widely viewed as impregnable. As we now know, that zone, too, was overtaken, and the target now has been achieved.
Third Upside Target Hit
This also marks the third major upside target the S&P has achieved since the lows. The first came from the inverse head-and-shoulders pattern that was most visible on the 60-minute chart. Once the index broke out, it rallied to 5,840 by May 12 — the point at which the just-discussed latest target was triggered.
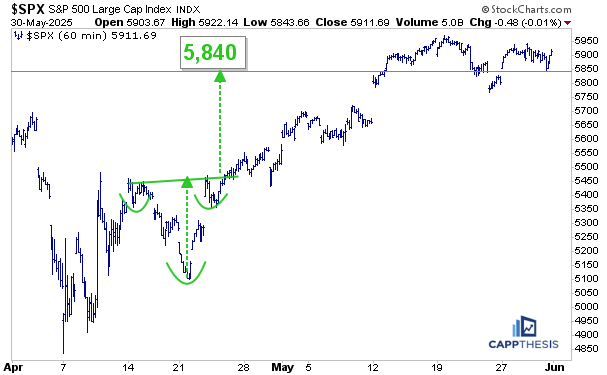
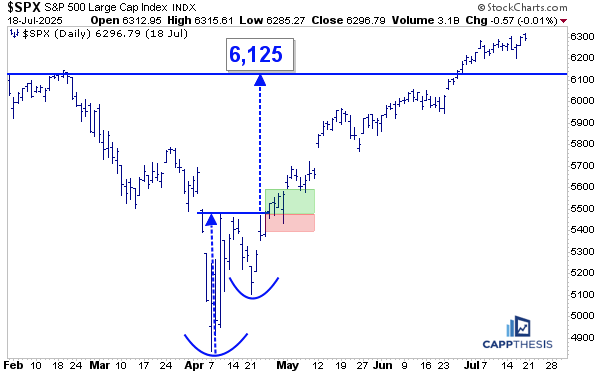
Along the way, the first bullish pattern on the daily chart became clear when the S&P broke above 5,500. That breakout was tested immediately and held each time, ultimately producing a target of 6125, which was achieved in late May.
Live Bullish Patterns
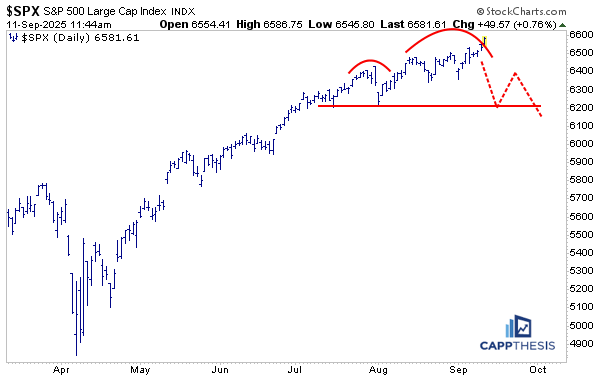
Even though the S&P 500 finished off the highs, the most recent bullish pattern we’ve been tracking also was triggered. The key now is whether the index can hold above this area. If it does, the 6,665-target will remain in play.
It’s worth noting, however, that two smaller bullish setups have already failed over the past few weeks. For this rally to extend meaningfully, we will eventually need to see smaller formations start to succeed again.
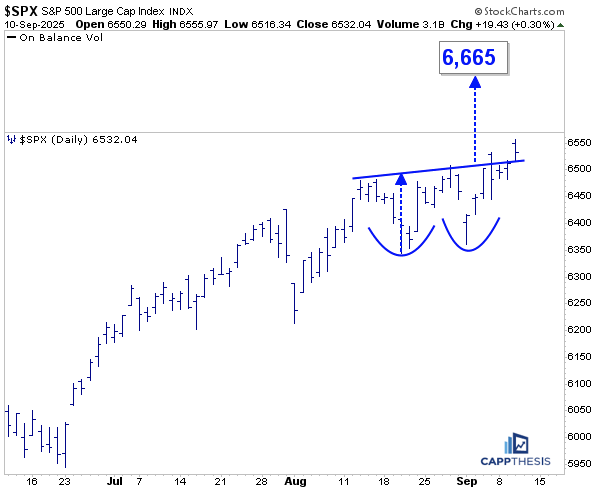
This gives us two live patterns…
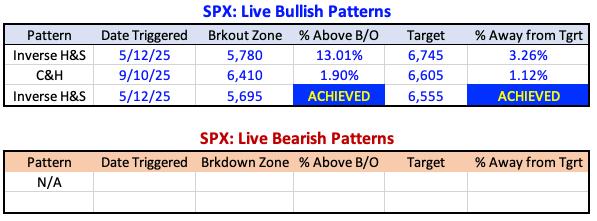
….and NO bearish patterns… The last potential bearish setup was this one.
Regardless of the market environment, we track bearish patterns just as closely as bullish versions. Why? In uptrends, bullish patterns work and bearish fail. When that changes, the trend will change. But not before.