MEMBERS ONLY
Week Ahead: Lack Of Leadership: This Resistance Cluster May Test Nifty’s Patience

by Milan Vaishnav,
Founder and Technical Analyst, EquityResearch.asia and ChartWizard.ae
The Nifty continues to be range-bound, oscillating in a narrow 476.65-point range. Will the index break above its resistance level? Milan Vaishnav shares his thoughts....
READ MORE
MEMBERS ONLY

Are Bearish Momentum Divergences Warning of a Market Top?

by David Keller,
President and Chief Strategist, Sierra Alpha Research
Bearish RSI divergences are appearing across market leaders from semiconductors to financials. Dave Keller, CMT, explains how weakening momentum can signal a change of character, what confirms a true trend reversal, and why RSI remains a critical tool for monitoring market leadership....
READ MORE
MEMBERS ONLY

QQQ Jumps Up (and Over)

by Bruce Fraser,
Industry-leading "Wyckoffian"
QQQ has reached the top of the bull market channel and broken above it. Will QQQ return to the channel and break below it? Bruce Fraser analyzes the chart of QQQ through a Wyckoffian lens. ...
READ MORE
MEMBERS ONLY

The U.S. Dollar Holds Firm as Long-Term Signals Turn Positive

by Martin Pring,
President, Pring Research
With the U.S. Dollar Index is looking bullish, Martin Pring analyzes the index using KST, Special K, and a diffusion indicator in order to judge the overall direction for the dollar.,...
READ MORE
MEMBERS ONLY

The Market Isn't Buying the Headlines

by Tom Bowley,
Chief Market Strategist, EarningsBeats.com
The headlines are painting one picture, but the market is telling a very different story. Tom Bowley explains what falling Treasury yields, sector rotation, and semiconductor leadership may really be signaling for investors....
READ MORE
MEMBERS ONLY

Can Micron’s Big Earnings Beat Bring the Mojo Back to Tech Stocks?

by Jayanthi Gopalakrishnan,
Director of Site Content, StockCharts.com
Micron’s earnings beat could help revive tech stocks, but PCE inflation data may decide what comes next....
READ MORE
MEMBERS ONLY

These Stocks Are Flashing the Same Signal

by Joe Rabil,
President, Rabil Stock Research
Joe Rabil highlights several stocks showing the same technical signal as money begins to flow into select areas of the market. He explains the patterns, momentum clues, and relative strength characteristics that have his attention right now....
READ MORE
MEMBERS ONLY
Breakout or Breakdown? Why Last Week’s Rally Raises Red Flags
by Martin Pring,
President, Pring Research
As false breakouts take place in some of the major indexes, Martin Pring reviews breakouts in the Dow Jones Industrial Average and Value Line Geometric Average and identifies key areas to monitor....
READ MORE
MEMBERS ONLY

The Dollar Breakout Is Here. What It Means for Stocks, Bonds, and Commodities
The US dollar broke through a resistance level after Fed Chair Kevin Warsh's first meeting. Find out what this means for international stocks, homebuilders, and commodities....
READ MORE
MEMBERS ONLY

Week Ahead: Truncated Weekly Likely to Keep NIFTY in Broad Range, No Sustained Directional Bias
by Milan Vaishnav,
Founder and Technical Analyst, EquityResearch.asia and ChartWizard.ae
The Nifty is trapped within a broad trading range with the medium-term trend in a neutral-to-cautious zone. Milan Vaishnav analyzes key resistance levels and shares his view on what to expect next week....
READ MORE
MEMBERS ONLY
Not Even Bad News Could Stop This Rally

by Mary Ellen McGonagle,
President, MEM Investment Research
Mary Ellen McGonagle explores what’s keeping the market resilient and where new opportunities may be emerging beneath the surface....
READ MORE
MEMBERS ONLY
These Breakouts Could Signal New Market Winners
by Joe Rabil,
President, Rabil Stock Research
Joe Rabil highlights breakout patterns emerging across several sectors as new market winners begin to stand out. He explains the relative strength, momentum, and technical signals he’s watching as leadership starts to broaden....
READ MORE
MEMBERS ONLY
The Bears Had Their Chance. Now What?

by Frank Cappelleri,
Founder & President, CappThesis, LLC
Frank Cappelleri analyzes the failed bearish setups, the return of buyers, and the technical signals that have pushed the S&P 500 back toward new highs. Was this pullback just another pause in the uptrend?...
READ MORE
MEMBERS ONLY

Three Breadth Signals That Help Confirm Market Trends
by David Keller,
President and Chief Strategist, Sierra Alpha Research
Market breadth often reveals what headline indexes miss. Dave Keller, CMT, explains the three breadth indicators at the core of his process - cumulative advance-decline lines, McClellan Oscillator, and percentage of stocks above key moving averages - and how they help confirm market trends....
READ MORE
MEMBERS ONLY

The Best Opportunities May Not Be in Tech Anymore
by David Keller,
President and Chief Strategist, Sierra Alpha Research
Technology continues to dominate the headlines, but some of the strongest rotations may be happening where few investors are looking. Dave Keller explores the sectors quietly improving beneath the surface and the signals that could reveal where leadership goes next....
READ MORE
MEMBERS ONLY

Lower Oil, Lower Treasury Rates: What Charts Say About What the Fed Faces This Week
With a tentative peace deal between the U.S. and Iran, we could see lower oil prices and interest rates. Which sectors could benefit? Find out here....
READ MORE
MEMBERS ONLY

These Areas are Attracting Money Right Now
by Mary Ellen McGonagle,
President, MEM Investment Research
As market participation broadens beyond big tech, new opportunities are emerging across the stock market. Mary Ellen McGonagle highlights sectors attracting fresh money flows and talks which areas show the strongest relative strength as investors look beyond traditional leaders....
READ MORE
MEMBERS ONLY

Small-Caps Lead, Breadth Improves as SPY Pulls Back; Bullish Setup for Industrials

by Arthur Hill,
Chief Technical Strategist, TrendInvestorPro.com
As the SPY pulls back, Arthur Hill makes an important note about its breadth; he also takes a look at how small-caps are faring and how industrials are setting up....
READ MORE
MEMBERS ONLY

Everything Just Changed In This Market — Now What?
by Tom Bowley,
Chief Market Strategist, EarningsBeats.com
After months of technology and semiconductor leadership, the market suddenly changed character. Tom Bowley explains what the recent rotation may be signaling—and where investors should focus next....
READ MORE
MEMBERS ONLY

S&P 500 Approaches Next Support as Market Jitters Rise: What Comes Next?
by Jayanthi Gopalakrishnan,
Director of Site Content, StockCharts.com
Stocks sold off as headline risk rattled investors. Discover what the S&P 500, Nasdaq, semiconductors, and oil are signalling next. ...
READ MORE
MEMBERS ONLY
Money is Flowing into These Areas Right Now
by Joe Rabil,
President, Rabil Stock Research
While the market works through a pullback, some stocks and sectors are showing surprising resilience. Joe Rabil highlights stocks that continue to attract buying interest despite recent market weakness....
READ MORE
MEMBERS ONLY

The Summer of Small-Cap Value? This Market Corner is Heating Up
Small-cap value ETFs are starting to heat up as mega-cap and AI stocks stumble. Here's an in-depth analysis of this asset group and one small-cap value ETF investors should closely monitor....
READ MORE
MEMBERS ONLY

Did the Stock Market's First Domino Just Fall?
by Martin Pring,
President, Pring Research
Inflation, weakening breadth, and buyer exhaustion in technology stocks raise warning signs as key stock market indicators point to growing risk....
READ MORE
MEMBERS ONLY

Week Ahead: NIFTY Set to See Weak Start; Watch Price Action Against This Zone
by Milan Vaishnav,
Founder and Technical Analyst, EquityResearch.asia and ChartWizard.ae
The 23,000–23,100 zone is a key support area for the Nifty Index. A violation of this support area could damage the technical structure of the chart. Milan presents the key levels to monitor in the week ahead....
READ MORE
MEMBERS ONLY
Why This Selloff Has My Attention

by Julius de Kempenaer,
Senior Technical Analyst, StockCharts.com
The stock market remains in a long-term uptrend, but Julius de Kempenaer explains why this recent selloff has his attention, and the signals that suggest patience may be the better strategy right now....
READ MORE
MEMBERS ONLY

Four Scenarios for the Nasdaq 100 After This Week’s Pullback
by David Keller,
President and Chief Strategist, Sierra Alpha Research
After a sharp June pullback, investors are reassessing the outlook for growth stocks. Dave Keller, CMT, outlines four possible paths for the Nasdaq 100 through late July, exploring how sector rotation, interest rates, and market leadership could shape the next move....
READ MORE
MEMBERS ONLY
This Market Selloff May Be Telling Us Something
by Mary Ellen McGonagle,
President, MEM Investment Research
Rising Treasury yields, inflation concerns, and renewed volatility triggered a sharp market selloff. Mary Ellen McGonagle shares what may be behind the weakness, where investors are rotating, and the areas still showing strength despite the pressure....
READ MORE
MEMBERS ONLY

The Hindenburg Omen Is Sounding Again. Should Investors Be Concerned?
by David Keller,
President and Chief Strategist, Sierra Alpha Research
A second Hindenburg Omen confirmation has emerged as market breadth weakens beneath new highs in the S&P 500 and Nasdaq. Dave Keller, CMT, explains why the signal should be viewed as an early warning sign, not a prediction, and how investors can prepare for rising risk....
READ MORE
MEMBERS ONLY

The Market Still Looks Bullish — But Something Changed
by Tom Bowley,
Chief Market Strategist, EarningsBeats.com
Technology stocks surged and growth continued leading the market, but some key leadership trends weakened late in the week. Tom Bowley explains what changed, what he’s watching, and why he’s still not turning bearish....
READ MORE
MEMBERS ONLY
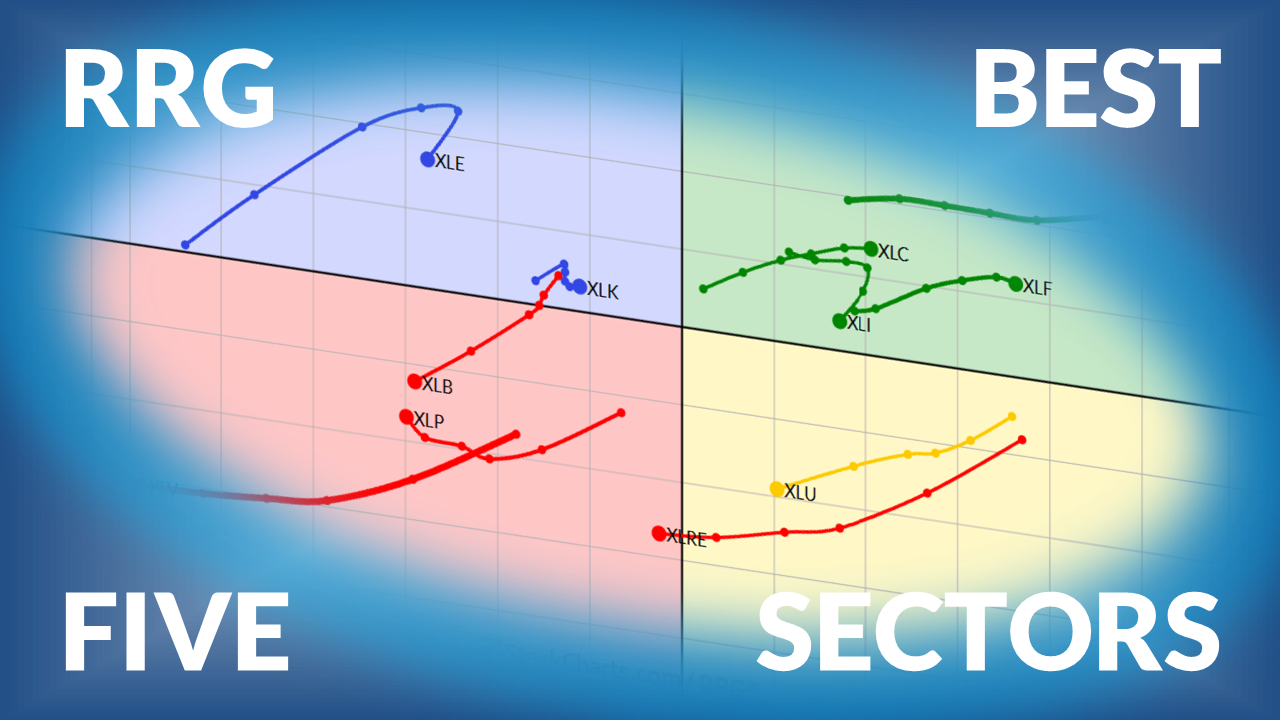
The Best Five Sectors This Week #68
by Julius de Kempenaer,
Senior Technical Analyst, StockCharts.com
Julius presents his weekly update on US sector rotation, using Relative Rotation Graphs, with Technology now leading the rankings and real estate entering the top five....
READ MORE
MEMBERS ONLY
These Sectors Could Be Next in the Rotation
by Joe Rabil,
President, Rabil Stock Research
In this video, Joe Rabil highlights a key sentiment warning signal and explains why several sectors may be next in the rotation. He reviews relative strength, momentum, and technical setups that could soon become much more important....
READ MORE
MEMBERS ONLY

Bitcoin Eyes Crucial Support: What If It Fails?
by Martin Pring,
President, Pring Research
Could Bitcoin provide a sign that the bear market is over? Martin takes a look at the $BTCUSD chart to examine what it means if Bitcoin breaks support -- and also what it means if it doesn't....
READ MORE
MEMBERS ONLY

Here's Why Market Rotation Matters More Than Ever
by Frank Cappelleri,
Founder & President, CappThesis, LLC
The S&P 500 keeps hitting bullish targets, but fewer stocks are driving the rally. Frank Cappelleri explains why broader participation may be needed and where leadership could emerge next....
READ MORE
MEMBERS ONLY

The AI Rally Left Industrials Behind. Here’s Why That May Not Last
Though industrials have lagged the S&P 500 this year, technicals suggest a trend reversal in the works. Mike Zaccardi explains why looking beyond AI trades may prove rewarding....
READ MORE
MEMBERS ONLY

These Fibonacci Levels Could Define Your Next Trade
by David Keller,
President and Chief Strategist, Sierra Alpha Research
Dave Keller explains how Fibonacci retracements can help identify support, resistance, price targets, and risk management levels. Using examples from MSFT, LULU, and AT&T, he shows when Fibonacci analysis is most effective and how traders use these key levels to plan their next move....
READ MORE
MEMBERS ONLY

Week Ahead: MSCI Rebalance Inflicts Technical Damage; Drags Resistance Down To These Levels
by Milan Vaishnav,
Founder and Technical Analyst, EquityResearch.asia and ChartWizard.ae
The Nifty closed near the lower end of its weekly range, mainly due to MSCI rebalancing. Milan Vaishnav analyzes the Nifty and shows why it's likely the index could trade within a consolidation zone....
READ MORE
MEMBERS ONLY

AI Is Reaching New Corners of the Market
by Mary Ellen McGonagle,
President, MEM Investment Research
AI-driven market leadership is expanding beyond software and semiconductors. Mary Ellen McGonagle highlights stocks and sectors benefiting from the next phase of the AI trade....
READ MORE