MEMBERS ONLY

If AI Stalls Here, These 10 Groups Could Take Over

by Tom Bowley,
Chief Market Strategist, EarningsBeats.com
AI stocks and semiconductors are rebounding, but can the rally last? With key resistance levels approaching, there could be a shift in leadership.
In this video, Tom Bowley highlights 10 industry groups and stocks that could benefit if market rotation picks up again. Using relative strength rankings, Tom identifies groups...
READ MORE
MEMBERS ONLY

Week Ahead: After Nifty's Vertical Rally, Focus Shifts to Holding Recent Gains

by Milan Vaishnav,
Founder and Technical Analyst, EquityResearch.asia and ChartWizard.ae
The Nifty had a strong directional move to the upside last week. Where is its next resistance level? Milan Vaishnav identifies the next key levels to monitor and the sector rotations taking place in the Indian market....
READ MORE
MEMBERS ONLY

Tech Is Losing Ground. What’s Leading Now?

by Mary Ellen McGonagle,
President, MEM Investment Research
A sharp sector rotation is reshaping the market beneath the major indexes. Mary Ellen McGonagle follows the relative strength shifts to uncover what’s now standing out....
READ MORE
MEMBERS ONLY
Russell 2000 ETF Hits Inflection Point Amid Battle to Hold Long-Term Uptrend: Plan Your Trade

by Arthur Hill,
Chief Technical Strategist, TrendInvestorPro.com
Small- and mid-cap stocks are at inflection points. Arthur Hill analyzes the charts of small- and mid-cap stocks and identifies the key levels to watch for breakouts....
READ MORE
MEMBERS ONLY

The Market Is Rallying Without AI. Here’s What’s Leading
by Tom Bowley,
Chief Market Strategist, EarningsBeats.com
AI stocks and semiconductor stocks are lagging even as the broader market rallies. Tom Bowley breaks down the rotation, from Nvidia and AMD to the sectors attracting money now. ...
READ MORE
MEMBERS ONLY

Tech Is Breaking Down. So What’s Keeping the S&P 500 Afloat?

by Frank Cappelleri,
Founder & President, CappThesis, LLC
Frank Cappelleri looks at the signals that could determine whether the disconnect between the S&P and the tech sector holds or finally gives way....
READ MORE
MEMBERS ONLY

Election Uncertainty Is Shaking Stocks: Is Your Portfolio Prepared?

by Jayanthi Gopalakrishnan,
Director of Site Content, StockCharts.com
Election uncertainty is shaking the stock market. Discover key support levels, market trends, and signals to watch to help protect your portfolio....
READ MORE
MEMBERS ONLY

StockCharts Added RRG Scanning. Here’s How to Use It

by Julius de Kempenaer,
Senior Technical Analyst, StockCharts.com
Julius de Kempenaer, creator of RRG charts, introduces StockCharts' new RRG scanning functionality and to use it, then reviews the results of his chosen scans....
READ MORE
MEMBERS ONLY

AI on the Ropes: Can Tech Stocks Stage a Year-End Comeback?
Semiconductor stocks fell sharply in October as investors rotated into defensive sectors such as Health Care, Consumer Staples, and Utilities. With midterm elections, a jobs report, and earnings from semiconductor companies on deck, will there be a rebound in AI-related stocks? Find out here....
READ MORE
MEMBERS ONLY

Week Ahead: Sector Rotation Hints At Leadership Change; NIFTY’s Behavior Against This Level Important To Watch
by Milan Vaishnav,
Founder and Technical Analyst, EquityResearch.asia and ChartWizard.ae
The Nifty closed above the psychologically important 23,000 level. Can it defend this level and develop into a more meaningful upward move? Milan Vaishnav breaks down the chart of the Nifty and the sector rotations within the broader market. ...
READ MORE
MEMBERS ONLY

'Tis the Season To Be Bullish
by Tom Bowley,
Chief Market Strategist, EarningsBeats.com
From a seasonality perspective, November is a bullish month, especially for the Financials sector. Tom Bowley breaks down his analysis using the StockCharts Seasonality Charts. ...
READ MORE
MEMBERS ONLY

QQQ Derails with Outsized Decline, Defensive Groups Lead, Biotech Breaks Out
by Arthur Hill,
Chief Technical Strategist, TrendInvestorPro.com
Some noteworthy rotations took place in the stock market in October. Health Care and Energy are the strongest sectors while Technology is the weakest. Arthur Hill analyzes the Biotech ETF IBB and shows a correction may be in the works. ...
READ MORE
MEMBERS ONLY
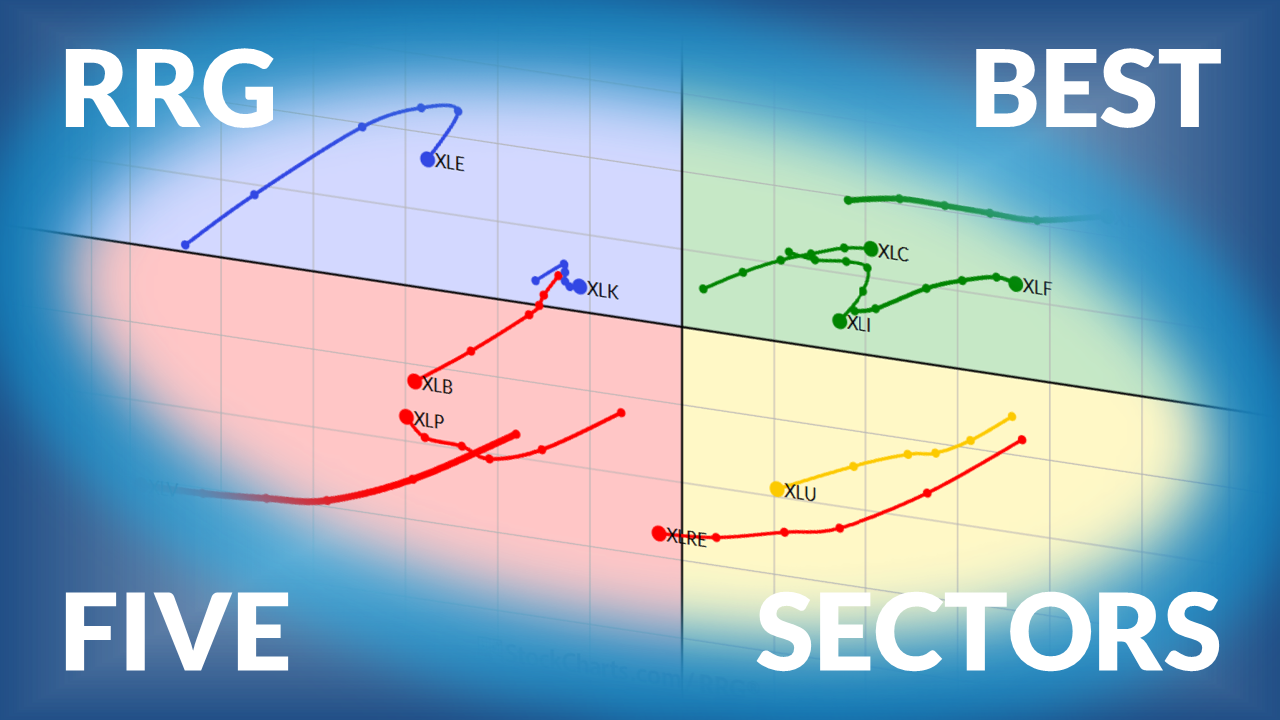
The Best Five Sectors This Week #86
by Julius de Kempenaer,
Senior Technical Analyst, StockCharts.com
Your weekly update on U.S. sector rotation using Relative Rotation Graphs....
READ MORE
MEMBERS ONLY

Energy Sector Power Play: Why Exxon and Chevron Could Win Into Year-End
As crack spreads ease, Exxon Mobil and Chevon are two stocks that could benefit from this development. These bullish chart patterns and seasonality trends favor further upside moves in Chevron and Exxon Mobile stock prices....
READ MORE
MEMBERS ONLY

It’s Crunch Time for the Transports

by Martin Pring,
President, Pring Research
Is a bullish run ahead for transport stocks? Martin Pring breaks down the iShares Transportation Average ETF (IYT) charts to find out....
READ MORE
MEMBERS ONLY

The Setup for a Year-End Rally Is Getting Stronger
by Tom Bowley,
Chief Market Strategist, EarningsBeats.com
Tom Bowley explains why improving earnings, falling rates, and healthy sector rotation may be strengthening the setup for a year-end rally....
READ MORE
MEMBERS ONLY
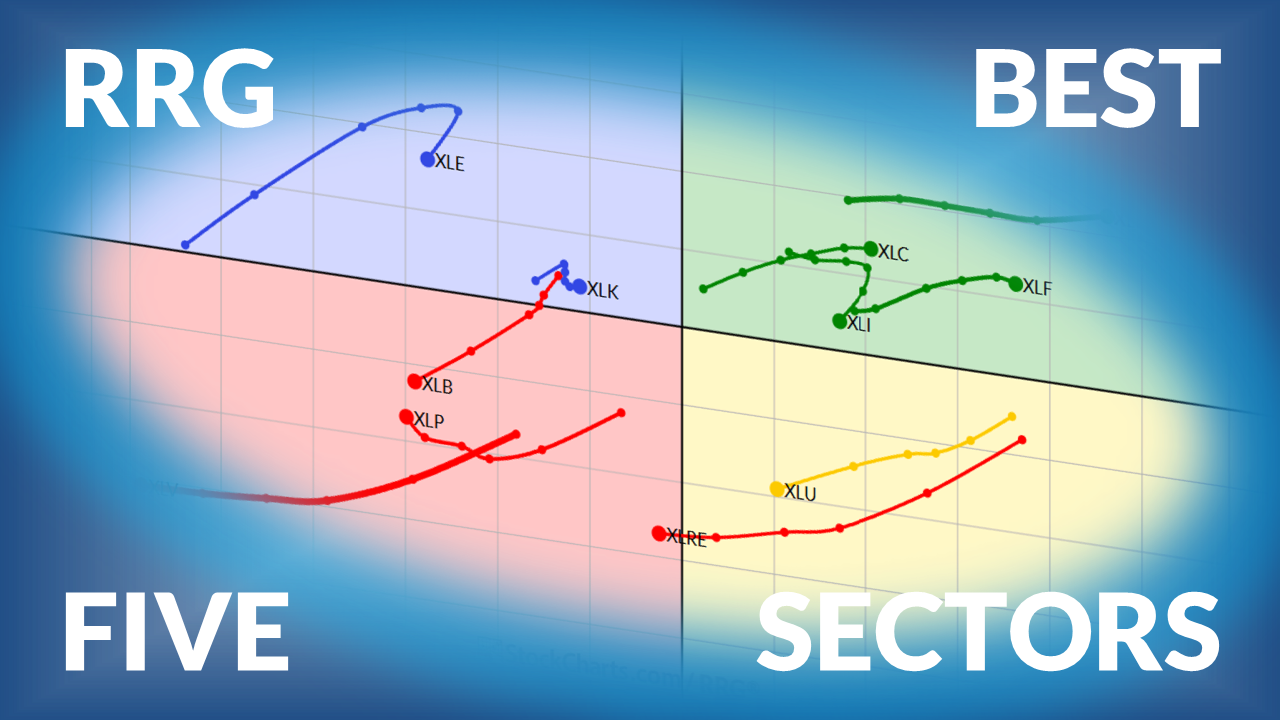
The Best Five Sectors This Week #85
by Julius de Kempenaer,
Senior Technical Analyst, StockCharts.com
Julius de Kempenaer, creator of Relative Rotation Graphs, presents his weekly update on US sector rotation. Technology has lost its #1 position after 20 weeks, with Energy and Health Care taking over....
READ MORE
MEMBERS ONLY

Week Ahead: Nifty Avoids a Structural Breakdown; Recovery Faces Its Next Technical Test
by Milan Vaishnav,
Founder and Technical Analyst, EquityResearch.asia and ChartWizard.ae
The Nifty reclaimed its 200-week moving average after slipping in previous weeks. But has the trend truly reversed?...
READ MORE
MEMBERS ONLY

AI Stocks Just Took a Hit. Here’s What’s Holding Up
by Mary Ellen McGonagle,
President, MEM Investment Research
Mary Ellen McGonagle breaks down the sharp hit to AI stocks and the risks behind the tech selloff. But the selling isn’t everywhere; she also analyzes the parts of the market that are still holding up....
READ MORE
MEMBERS ONLY
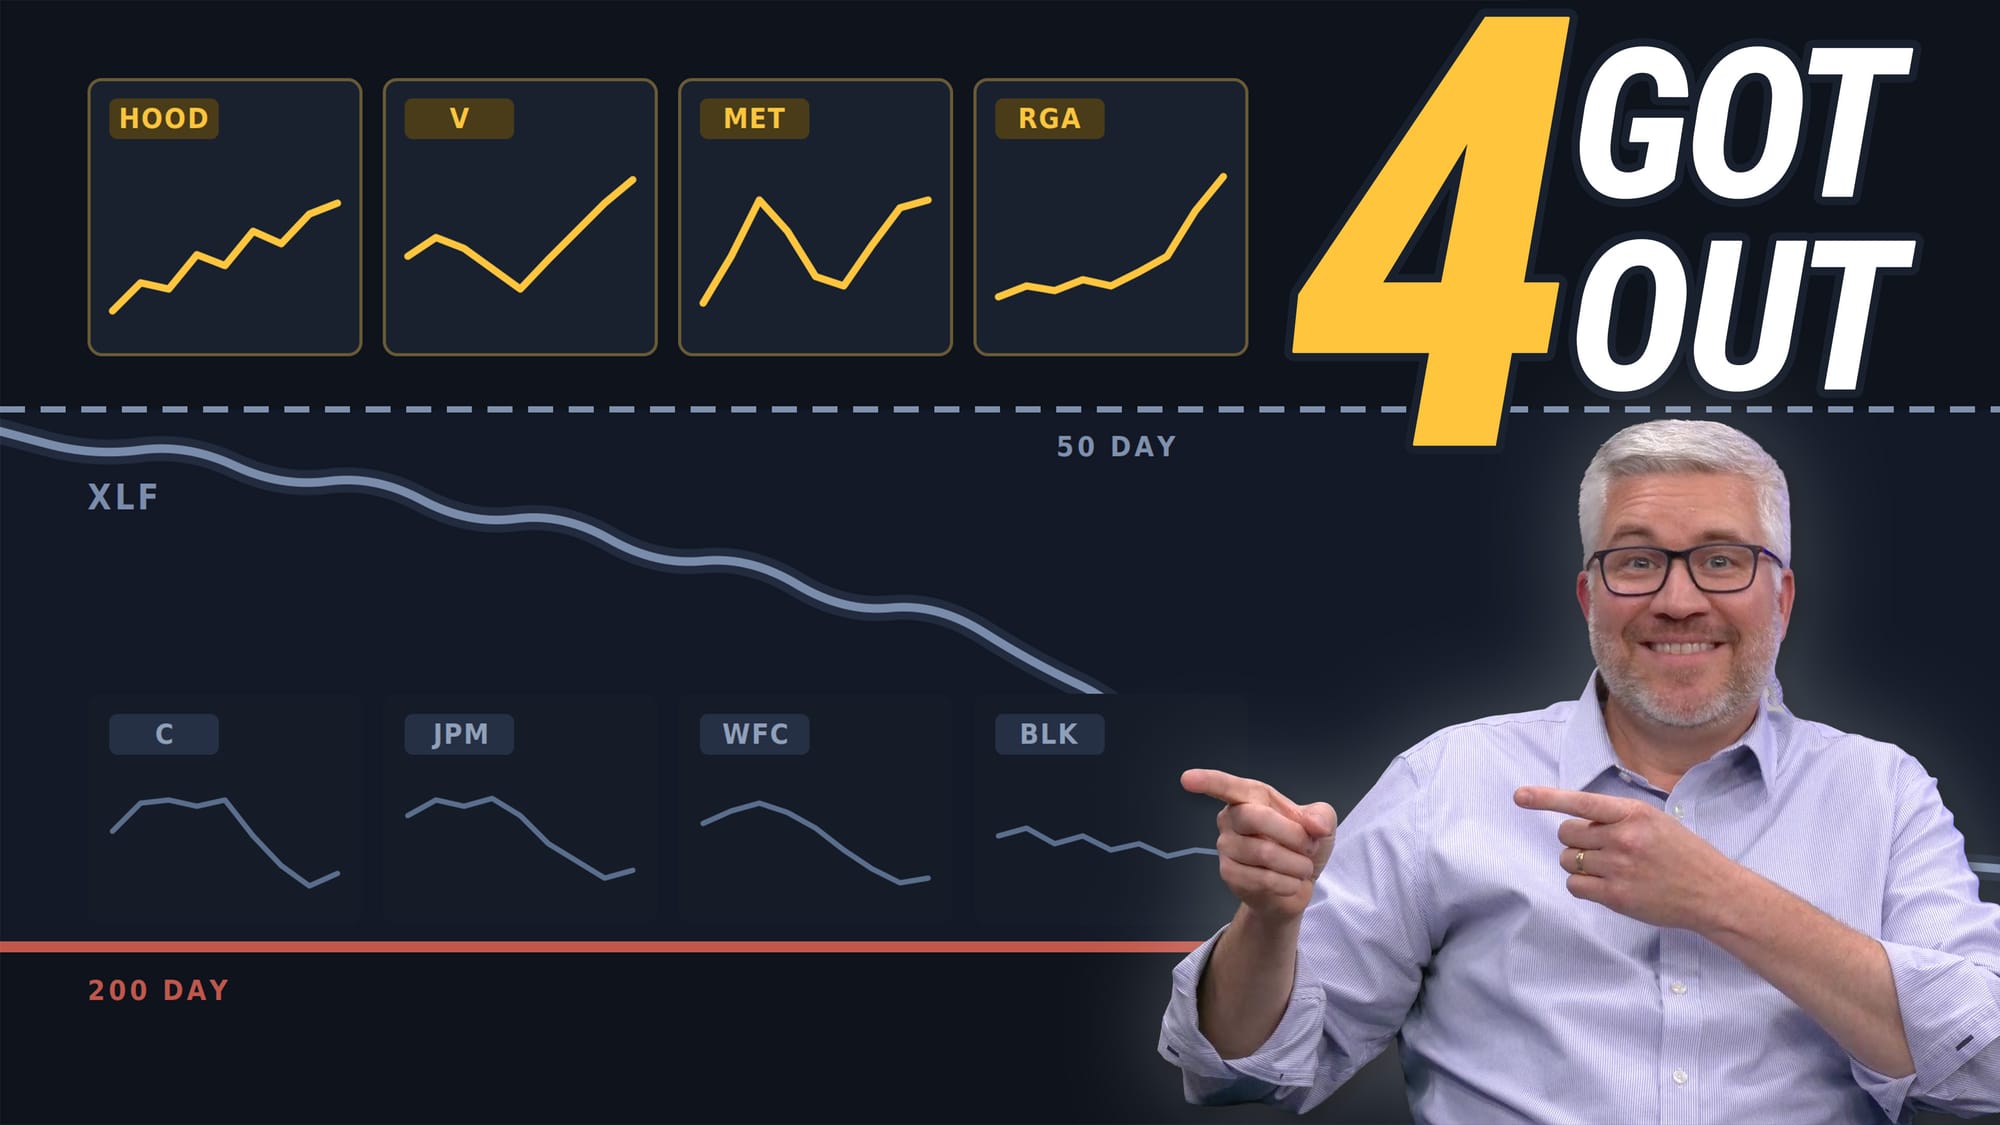
Banks are STRUGGLING. These 4 Financial Charts Look BETTER.

by David Keller,
President and Chief Strategist, Sierra Alpha Research
As many major banks enter earnings season in questionable shape, Dave Keller examines key financial charts and what to watch as results come in....
READ MORE
MEMBERS ONLY

Bank Earnings on Tap: Is the Financials Sector Selloff a Q4 Buying Opportunity?
XLF has been rallying. If Q3 earnings can carry this rally further, there could be buying opportunities in the sector. Here are the charts you should be watching....
READ MORE
MEMBERS ONLY

Week Ahead: Nifty Snaps 8-Week Losing Streak; Sustaining Above This Point Crucial for Sustaining Rebound
by Milan Vaishnav,
Founder and Technical Analyst, EquityResearch.asia and ChartWizard.ae
The Nifty is marking its first positive week after 8 weeks of decline, but the recovery remains tentative; Milan analyzes what the coming week has in store....
READ MORE
MEMBERS ONLY

The Market is Getting Defensive, But Not Where You Think
by Mary Ellen McGonagle,
President, MEM Investment Research
Mary Ellen McGonagle tracks the shift beneath the surface of the markets and explains why the most important moves may not be where investors expect....
READ MORE
MEMBERS ONLY

The Great Rotation: Wall Street Buys the Consumer Without Abandoning Big Tech
by Mary Ellen McGonagle,
President, MEM Investment Research
Is market leadership beginning to broaden? As areas besides technology show signs of accumulation, Mary Ellen McGonagle focuses on two sectors with potential....
READ MORE
MEMBERS ONLY

Another Record High, But Consumer Strength is Lacking
by Tom Bowley,
Chief Market Strategist, EarningsBeats.com
The S&P 500 has been reaching new highs but consumer strength is lacking. So if consumer discretionary stocks lack momentum, it may be time to turn to other areas especially as earnings season kicks off....
READ MORE
MEMBERS ONLY

Three Non-Tech Stocks Showing Bullish Potential
by David Keller,
President and Chief Strategist, Sierra Alpha Research
Technology remains the market's dominant sector, but compelling setups are emerging elsewhere. Dave Keller, CMT, highlights charts of Visa, Steel Dynamics, and Clorox to show how breakouts, support levels, and momentum divergences can reveal potential Q4 leaders beyond tech....
READ MORE
MEMBERS ONLY

Week Ahead: Nifty Violates Key Support; Still Stays Prone To Imminent Rebound
by Milan Vaishnav,
Founder and Technical Analyst, EquityResearch.asia and ChartWizard.ae
The technical structure of the Nifty has weakened. Is a rebound likely? Keep an eye on these key zones in the Nifty. A break above or below these levels can indicate which direction the index is likely to move....
READ MORE
MEMBERS ONLY

The 5% Treasury Yield: It's Here and How It'll Affect Stocks
by Tom Bowley,
Chief Market Strategist, EarningsBeats.com
The 10-year U.S. Treasury yield has climbed above 5%. See how higher rates are affecting stocks, driving sector rotation, and shaping the market outlook....
READ MORE
MEMBERS ONLY

The Market Isn't Breaking. It's Rotating!
by Tom Bowley,
Chief Market Strategist, EarningsBeats.com
Sector rotation is keeping the S&P 500 and Nasdaq 100 resilient as yields rise. See where strength is building and which sectors are weakening....
READ MORE
MEMBERS ONLY

Why Now’s the Time to Own Small Caps: Q4 Levels to Watch on IWM
Small caps pulled back from August highs, but October's bullish midterm seasonality could signal a reversal. Explore what's next for IWM and other small-cap stocks and ETFs....
READ MORE
MEMBERS ONLY

XLK: Thrust or Exhaustion?
by Martin Pring,
President, Pring Research
Is XLK approaching the later stages of an advance? Martin Pring analyzes price thrusts in different asset groups and discusses why the momentum extreme in XLK could be a major stock market pivot point....
READ MORE
MEMBERS ONLY

The Bond Selloff Is Getting Ugly. Could Utilities Be the Tell?
The rise in U.S. Treasury yields has put tremendous pressure on utility stocks. If buyers step in and accumulate positions in the Utilities ETF (XLU), it could be a strong indication that yields have reached a peak. Be sure to add these charts to your watchlists....
READ MORE
MEMBERS ONLY

Week Ahead: Short Week, Critical Levels as Nifty Braces for a Decisive Move
by Milan Vaishnav,
Founder and Technical Analyst, EquityResearch.asia and ChartWizard.ae
The Nifty is approaching a technically significant support cluster. What does the shortened week ahead hold? Find out here....
READ MORE