A Deep Dive into the Health Care Sector

The Health Care sector rallied sharply last week on the news of Pfizer’s agreement with the White House to lower prices on several medications in exchange for a three-year exemption from certain tariffs. Sentiment was also boosted by several biotech companies receiving Breakthrough Therapy Designation, which often signals strong innovation momentum in areas investors are watching for future growth. Despite that favorable background, Health Care has still underperformed most other sectors since the beginning of the year. Even so, it’s still reasonable to ask the question of whether recent action should be sold into or treated as a buying opportunity.
Health Care Breaks Out
Chart 1 features the SPDR Health Care ETF (XLV) from the turn of the century, which indicates the price has alternated between consolidation formations and the breakout markup phases that separate them. It has paid to own healthcare stocks after all four of the post-2000 breakouts. That said, the 2019 break initially proved to be problematic, thanks to the pandemic-influenced recession of 2020. It is in that context that we see the early 2024 break only now coming into its own.
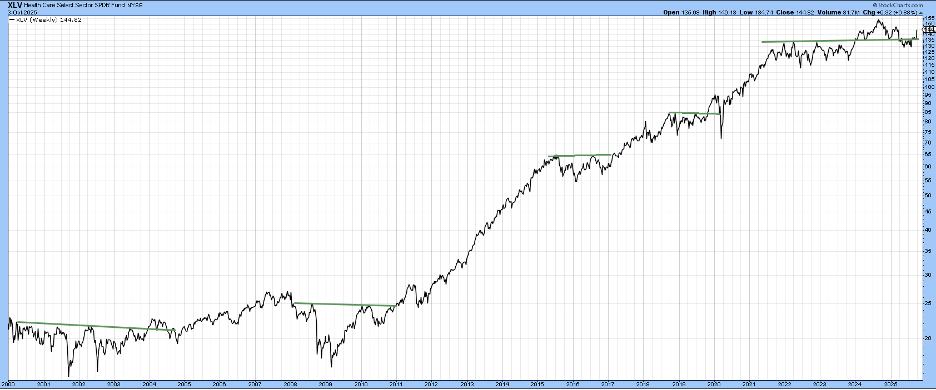
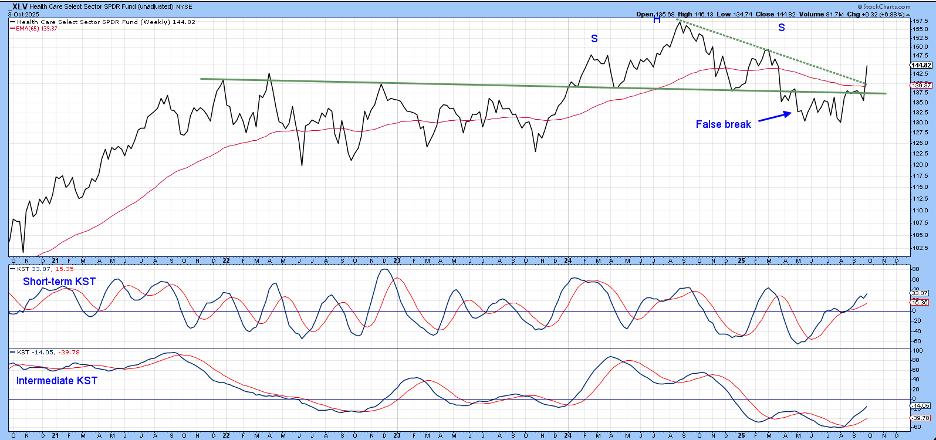
Chart 2 features recent action in greater detail. A perfect-looking breakout occurred right at the 2024 open, only to be followed by the formation and eventual completion of a head-and-shoulders top. However, there was no downside follow-through, and early October price action has now pushed the price back above the extended neckline. The break above the dashed green 2024–2025 down trendline and recapture of the 65-week EMA indicate the downside break to have been a whipsaw.
In most instances, false moves are followed by an above-average move in the opposite direction to the false break, as traders scramble to get back to the right side of the market. Note that the short- and intermediate-term KSTs are both in a positive mode, thereby giving credibility to the rally. The regaining of the 2021–2025 green trendline is also of huge importance as it represents a significant pivotal point, having turned back numerous rallies and reactions over the last three years or so. Last week’s action, therefore, reaffirms the original January 2024 breakout.
Healthcare may have done well in an absolute sense since the turn of the century. However, on a relative (to the S&P Composite) basis, it’s literally gone nowhere, as demonstrated by the horizontal blue arrow in Chart 3. The second point reiterates the comment made earlier about above-average price moves following whipsaws. In that respect, Chart 3 features a false downside break in 2021 and a fake move on the upside in 2022.
The RS line has been in an almost straight-line downward trajectory since 2022. As a result, it is currently positioned well below its 12-month MA. The long-term KST is also still bearish. Consequently, it is far too early to conclude that the RS line has bottomed out with any degree of certainty.
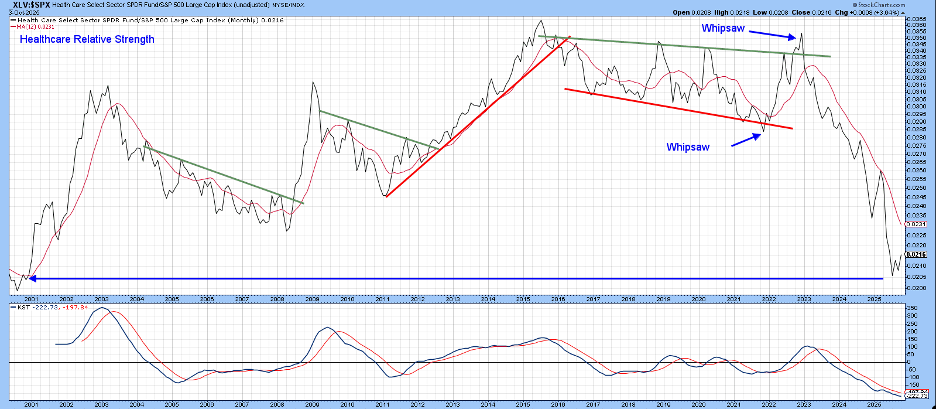
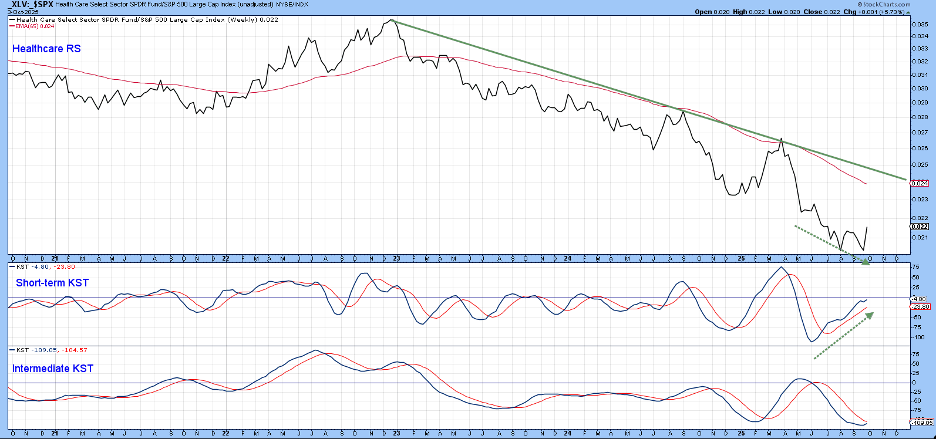
Chart 4 emits a similar message since the down trendline and 65-week EMA are a long way from last Friday’s close. Nonetheless, the technical position is definitely improving as the short-term KST is diverging positively with the price, and its intermediate counterpart looks set to go bullish at any time.
Analyzing Biotech
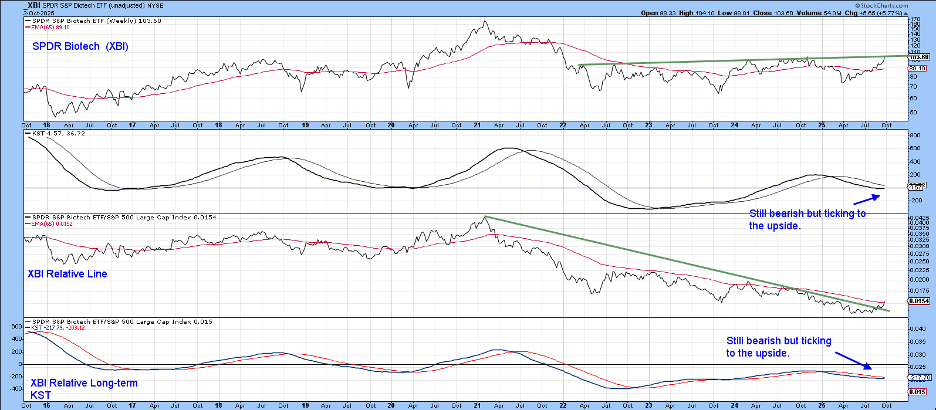
A relative revival for healthcare stocks may be some way from an actual signal, but biotech stocks look to be much closer to this reality, as displayed in Chart 5. The upper window indicates that the SPDR Biotech ETF (XBI) is right at its 2022–2025 resistance trendline. The absolute KST, just below it, has started to reverse. However, it is not yet above its 26-week EMA for a full-fledged buy signal. The same can be said for the RS KST in the bottom window; however, the RS line itself has violated its four-year down trendline and looks ready to regain its 65-week EMA.
The Bottom Line
After several years of consolidation, the SPDR Health Care ETF looks set to move higher. Its relative strength line is extremely oversold at a time when it has reached mega support. However, unless you are prone to catching falling knives, it is far too early to call a very long-term relative reversal. In the meantime, biotechs are a good place to monitor this sector’s relative performance going forward.
Good luck and good charting,
Martin J. Pring
The views expressed in this article are those of the author and do not necessarily reflect the position or opinion of Pring Turner Capital Group of Walnut Creek or its affiliates.


