A Relief Rally or Rebound? What the Charts Are Saying Now

Key Takeaways
- The relief rally may be encouraging, but major indexes are still trading below their 200-day moving averages.
- Elevated volatility and oil prices are continuing to pressure stocks.
- Monitor key levels and wait for stronger confirmation to indicate a reversal of the downward trend.
After a difficult stretch, the stock market is starting to show signs of green shoots. Is this the turnaround investors have been waiting for?
Earlier this week, investors seemed to think that the war in Iran might end soon. After President Trump’s speech on Wednesday night, though, those hopes faded. Before the market opened, oil prices rose and stocks sold off. But there was a shift in regular trading hours, as stocks recovered, the S&P 500 ($SPX) and Nasdaq Composite ($COMPQ) closed higher, and the three major indexes snapped a five-week losing streak.
That sounds encouraging, but determining if this is really a turnaround will require looking beneath the surface.
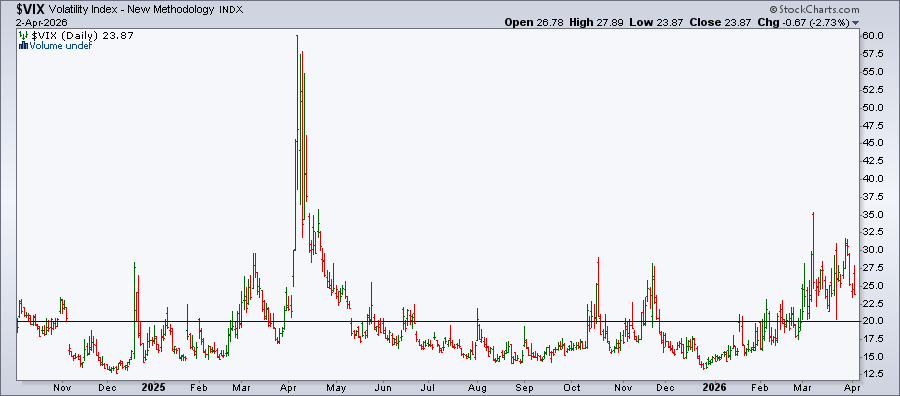
The Cboe Volatility Index ($VIX) pulled back from its highs and closed at 23.87. It shows that investors aren’t too fearful, but it’s still above the comfort level of 20. The VIX hasn’t reached the +50 level it reached during the April low, but it has had wide-ranging moves, similar to the pre-April moves.
There’s still too much uncertainty surrounding the macro picture. This week’s relief rally may give the impression that the market may be starting to show signs of turning around, but the major indexes have yet to break through some important resistance levels. Until they do, it’s best to stay defensive.
The S&P 500: Improving, But Not Yet In the Clear
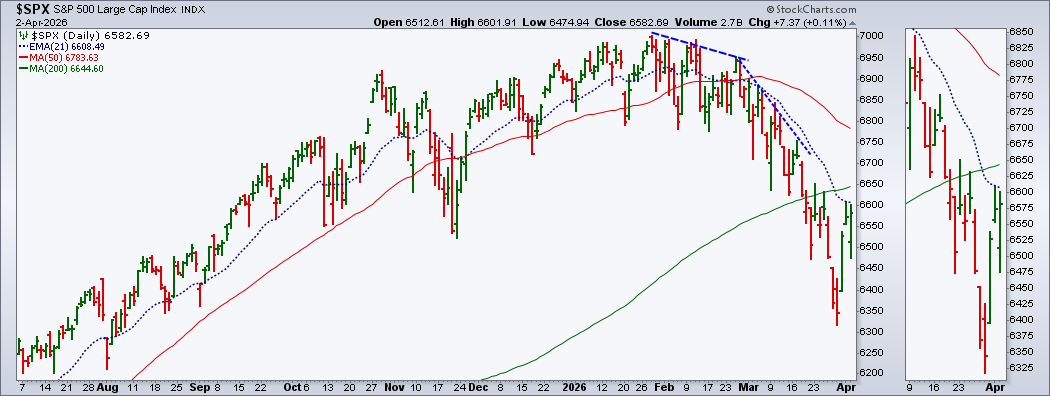
The S&P 500 ($SPX) has bounced more than 4.0% from its March 30 low, but it’s still trading below its 200-day simple moving average (SMA). On the daily chart, the 21-day exponential moving average (EMA) is acting as a strong resistance level. Overall, it looks like the index is trying to find firm ground but still has a downside bias.
Nasdaq Composite: Up Against Resistance
The Nasdaq Composite ($COMPQ) is in a similar position as the S&P 500. It’s trading below its 200-day SMA and facing resistance at the 21-day EMA.
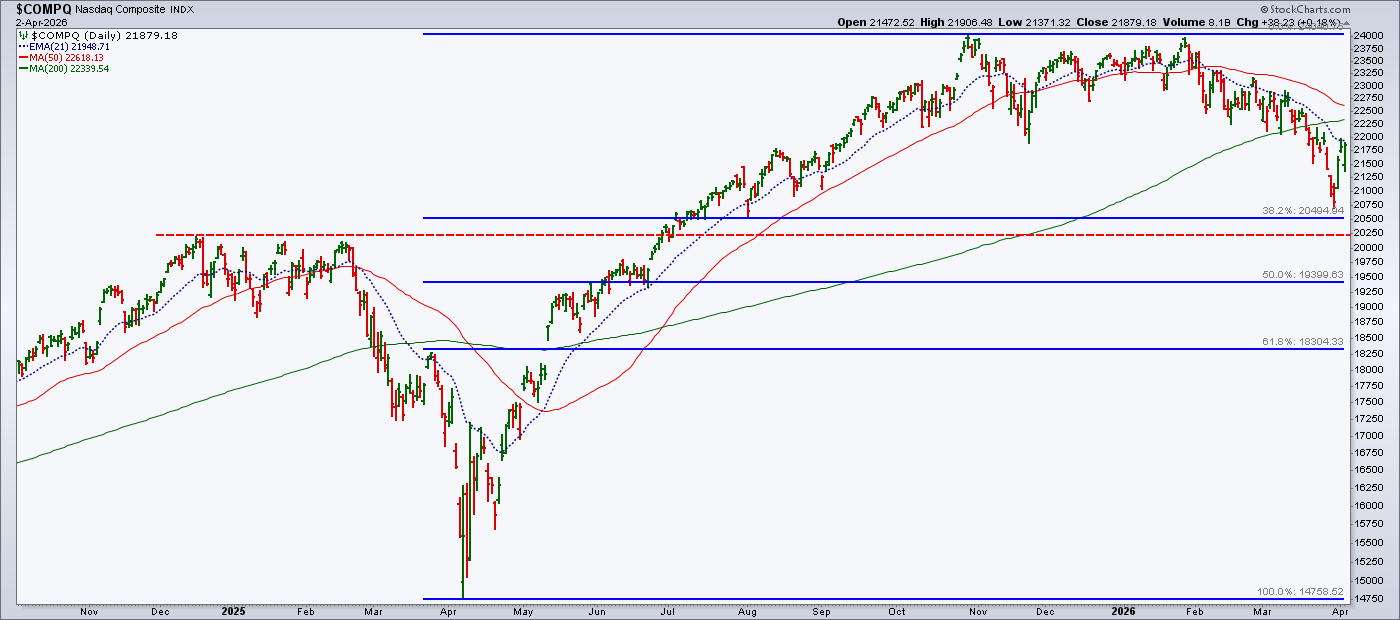
An encouraging sign is that the Nasdaq came close to its 38.2% Fibonacci retracement before bouncing higher. The key here is whether the Nasdaq will break above the 21-day EMA and 200-day SMA. If it doesn’t, it could move back toward the 38.2% retracement level, or even lower. I’ll be watching the December 2024 highs (red dashed line).
Dow Industrials: Same Story
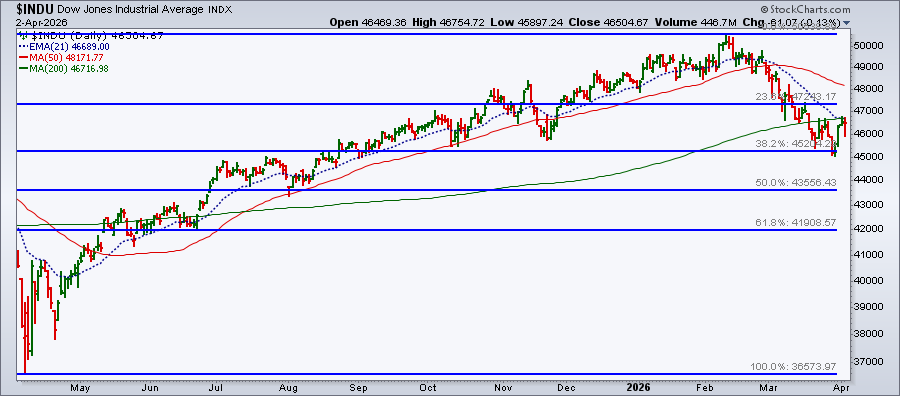
The Dow Industrials also bounced off its 38.2% Fibonacci retracement level, but is now facing resistance from the 200-day SMA and 21-day EMA. It has to break through this resistance level before showing signs of an upside move.
Looking at the charts of the three major indexes, they’re all echoing a similar message: the bigger trend still needs to improve.
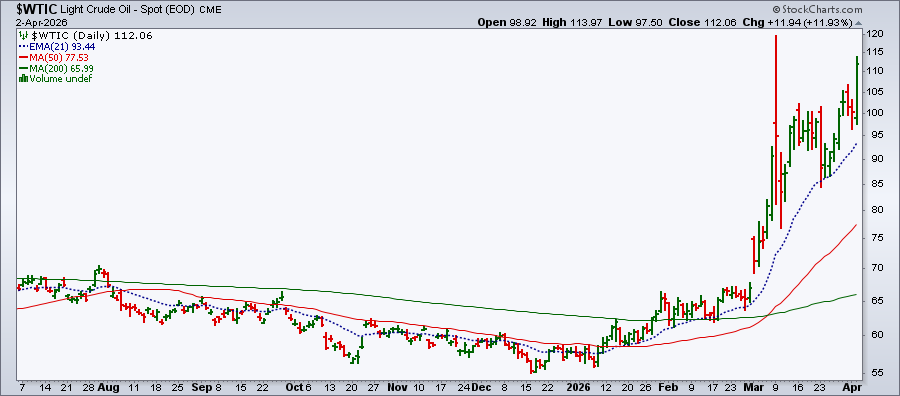
Oil Prices Still Matter
As long as oil prices remain high, stocks can continue to be pressured. Spot Light Crude closed at $111.63 per barrel, which is extremely elevated. Thursday’s +11% spike in $WTIC is a reminder of how sensitive energy markets are to the Middle East conflict.
Is Now the Time to Accumulate Long Positions?
Not quite. Even though the S&P 500, Nasdaq Composite, and Dow Industrials snapped a five-week losing streak, and the Nasdaq and S&P 500 had their best week of the year, we’re not out of the woods. Until the VIX settles down to around 20 and the charts of the major indexes show that a reversal to the upside is in play, I would stay away from opening any new long positions.
Track the overall trend in the major indexes, monitor support and resistance levels, and keep an eye on volatility. Once these flash a green light, you can move on to which individual stocks and ETFs you will want to add to your portfolio.
Disclaimer: This blog is for educational purposes only and should not be construed as financial advice. The ideas and strategies should never be used without first assessing your own personal and financial situation, or without consulting a financial professional.


