A Year of Market Fear — and Resilience: Breaking Down the VIX in 2025

Key Takeaways
- From trade wars to Fed drama, volatility surged, then faded — rewarding disciplined traders
- A VIX spike above 60 tested nerves, but long-term market resilience ultimately prevailed
- 2025 proved that ignoring headlines and trusting price action still pays
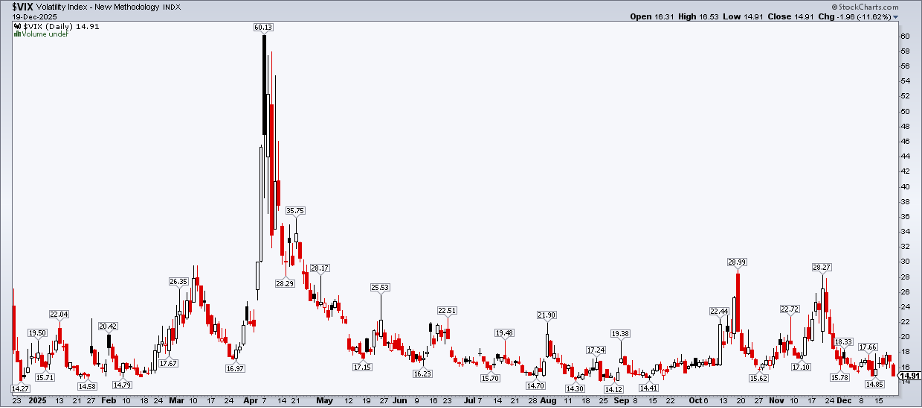
Tender and mild. That seems to be the market’s mantra as we set to close up shop for the year. The Cboe Volatility Index ($VIX) has eased to 15 — not quite a silent night, but sleepy enough after what has been a “spiky” 2025 in terms of equity-market anxiety.
Today, let’s revisit the year’s major volatility catalysts and gain some insight into what new ones could be in store next year.
A Calm Start to 2025
We’ll begin by zooming out. A year ago, the VIX plunged leading into Christmas. Santa’s big scene was not a dramatic one on the floor of the New York Stock Exchange. The fear gauge cratered from 26 to 14 over just a few sessions before creeping back up into mid-January.
Step back in time to early 2025, and the vibes were rather holly-jolly. Consumer and business confidence readings were sanguine, with investors anticipating deregulation, lower taxes, and maybe a reasonable dose of increased tariffs. “Normal” was the word. The VIX ranged between 14 and 22 through mid-February, just as the S&P 500 hit a short-term peak.
Trade Rhetoric Rekindles Volatility
The first true bout of market jitters hit over the back half of the first quarter. While the DeepSeek AI event in January was digested without widespread concern, President Trump ratcheted up trade-war rhetoric over the first two months of his second term.
It seemed that any time Peter Navarro, White House senior counselor for trade and manufacturing, was in front of a camera, the S&P 500 traded heavy. Conversely, Treasury Secretary Scott Bessent was a voice of calm. In the middle was Commerce Secretary Howard Lutnick.
Early-Year Macro Tidbits
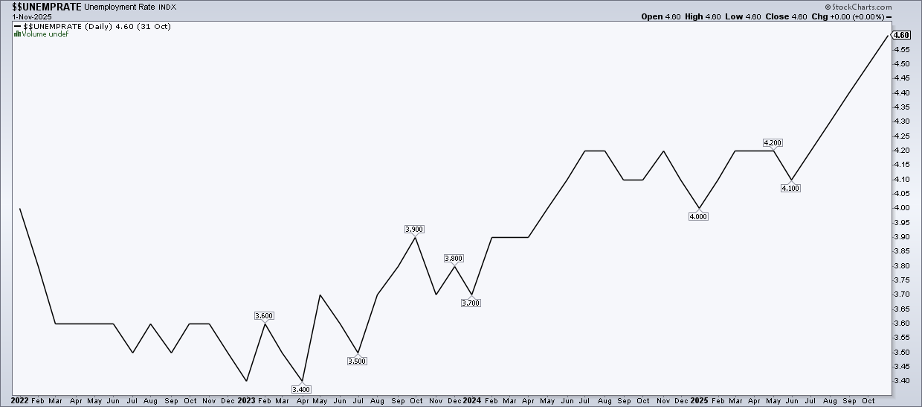
Volatility cooled with generally healthy jobs and inflation data through March. Recall that the unemployment rate, while inching higher since April 2023, was still modest. At the same time, jobless claims were low, despite steep layoffs at the federal level, courtesy of the Department of Government Efficiency. The “slow to hire, slow to fire” labor market became the macro narrative. Corporate earnings growth was also strong.
Liberation Day Shock
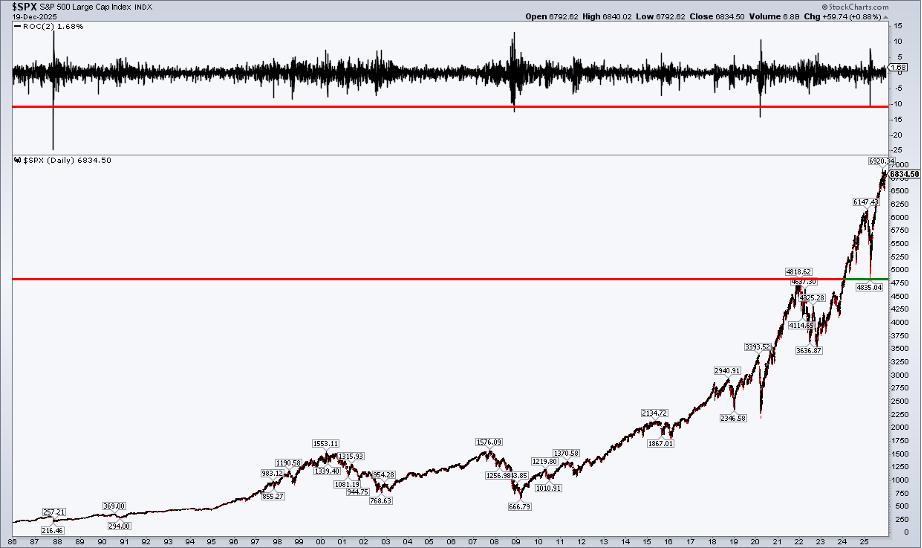
Then came “Liberation Day.” The VIX skyrocketed from under 17 to above 60 over just eight trading sessions. The S&P 500’s more than 10% two-day decline was among its worst since the 1987 stock market crash. Technically, the SPX held its previous all-time high from early 2022 of 4818. Those able to stomach intense up-and-down moves were rewarded as 2025 progressed.
The “TACO” Trade and the April Rebound
The VIX retreated almost as quickly as it rose, as has often been the case around V-bottoms in U.S. stocks over the past 15-plus years. President Trump noted a “yippy” bond market when speaking with a White House gaggle on April 9, arguably the first (and most potent) instance of what would soon be dubbed the “TACO” trade.
As always, investors were rewarded for ignoring politics and focusing on price action.
Why 60+ on the VIX Matters
Historically, VIX spikes to 60+ signal tremendous buying opportunities, and April 2025 was no different. A more-than-35% broad rally has played out. What’s more, from May through today, the highest the Volatility Index scaled was just 29 on a closing basis. Tariffs gradually moved from top-of-the-fold to a page-two story.
More traditional economic issues, like the jobs situation, inflation, and the Fed, drove headlines. But the bulls could always hang their hat on record-high corporate earnings and a resilient, battle-tested market.
Summer Fed Noise, Little Signal
A brief two-day VIX spike occurred in early August. A dreadful July jobs report prompted the president to call for the dismissal of the head of the Bureau of Labor Statistics. Former Fed Governor Adriana Kugler resigned at about the same time, leaving an open seat that Stephen Miran would later fill. Trump turned up the heat on the Fed — namely, Chair Powell — ultimately touring ongoing Fed building renovations, all while hinting at seeking to fire the man he appointed in 2017.
It was mostly theatrics, and traders looked beyond the show. More impactful negative price action occurred in October. Renewed U.S.-China trade-war fears coincided with the now-infamous “cockroaches” comment from JPMorgan Chase CEO Jamie Dimon. Regional banks were once again under the macro microscope for their exposure to potentially bad loans.
It wasn’t March 2023 Part 2, though. The VIX tagged 28.99, but traders faded it.
The Fed Takes Center Stage — Again
The Fed was back in focus in late October and November. Stubborn inflation trends and a precarious labor market drove division among the 12 FOMC voting members. Powell didn’t mince words at his October 29 press conference, confirming that a December cut was not a foregone conclusion — “far from it.”
The Fed Funds futures market began pricing out the chance of a third straight quarter-point ease, just as investors dumped AI stocks en masse. The VIX approached 30 once again, but New York Federal Reserve President John Williams assuaged hawkish fears. His November 21 speech laid the groundwork for the year’s final rate cut in December.
A Surprisingly Normal Year in Retrospect
That brings us to Christmas Week on Wall Street. Despite intense fear in early April, 2025 may appear extremely normal in retrospect (at least as far as S&P 500 price action is concerned). Yes, the VIX hit 60, which is rare, but the market’s max drawdown was just 19%, while the year’s total return is likely to land in the 15–20% range.
The Bottom Line
Investors were well served by downplaying the headlines and focusing on price action in 2025. That’s almost always good advice, but macro noise seemed louder this go-round than in recent years. I expect the same in 2026, given the politically charged backdrop. Less cable news and more charts might be your most profitable New Year’s resolution.
Disclaimer: This blog is for educational purposes only and should not be construed as financial advice. The ideas and strategies should never be used without first assessing your own personal and financial situation, or without consulting a financial professional.


