After a 144% JPM Winner, Another Bearish Setup Is Taking Shape

Key Takeaways
- JPM may be setting up for another move lower as the stock struggles near the $300 level.
- The bearish case is supported by technical and fundamental pressure, including concerns around private credit, consumer lending, and the upcoming earnings report.
- A long put offers a direct way to express the bearish view, giving options traders a defined risk strategy with potential upside if JPM breaks down.
A little over a month ago, we published a bearish thesis: JPMorgan Crumbles As AI Disruption Hits Wall Street Fortress. We outlined a structural breakdown in JPM and structured a defined-risk bearish options trade to capitalize on it.
The trade worked! It delivered a 144% return on capital, turning a $7.60 premium into an $11 profit. And if you missed that trade, you're in luck. The market has just handed us a second chance to turn a nice win into a home run.
While our initial thesis focused on software displacement, the macroeconomic clouds gathering over the banking sector have grown significantly darker. There are two big risks to watch here. First, stress may be building in the private credit market. If that spreads, it could pose a very real systemic risk to the large banks. Second, consumer lending could come under pressure. For a bank like JPM, which has built a highly lucrative consumer credit division, a 10% regulatory cap would weigh on profit margins at a time when consumer delinquency rates are starting to tick higher.
The fundamentals are flashing red and, with JPM's Q1 earnings report looming on April 14th, the catalyst for a severe repricing is right around the corner.
What's the JPM Chart Saying?
The technical setup on JPM is one of the most reliable patterns in trading: the "re-test and reject."
When JPM initially broke below the critical $300 support level last month, the stock staged a weak relief rally and drifted back up to "kiss" the $300 level from underneath.
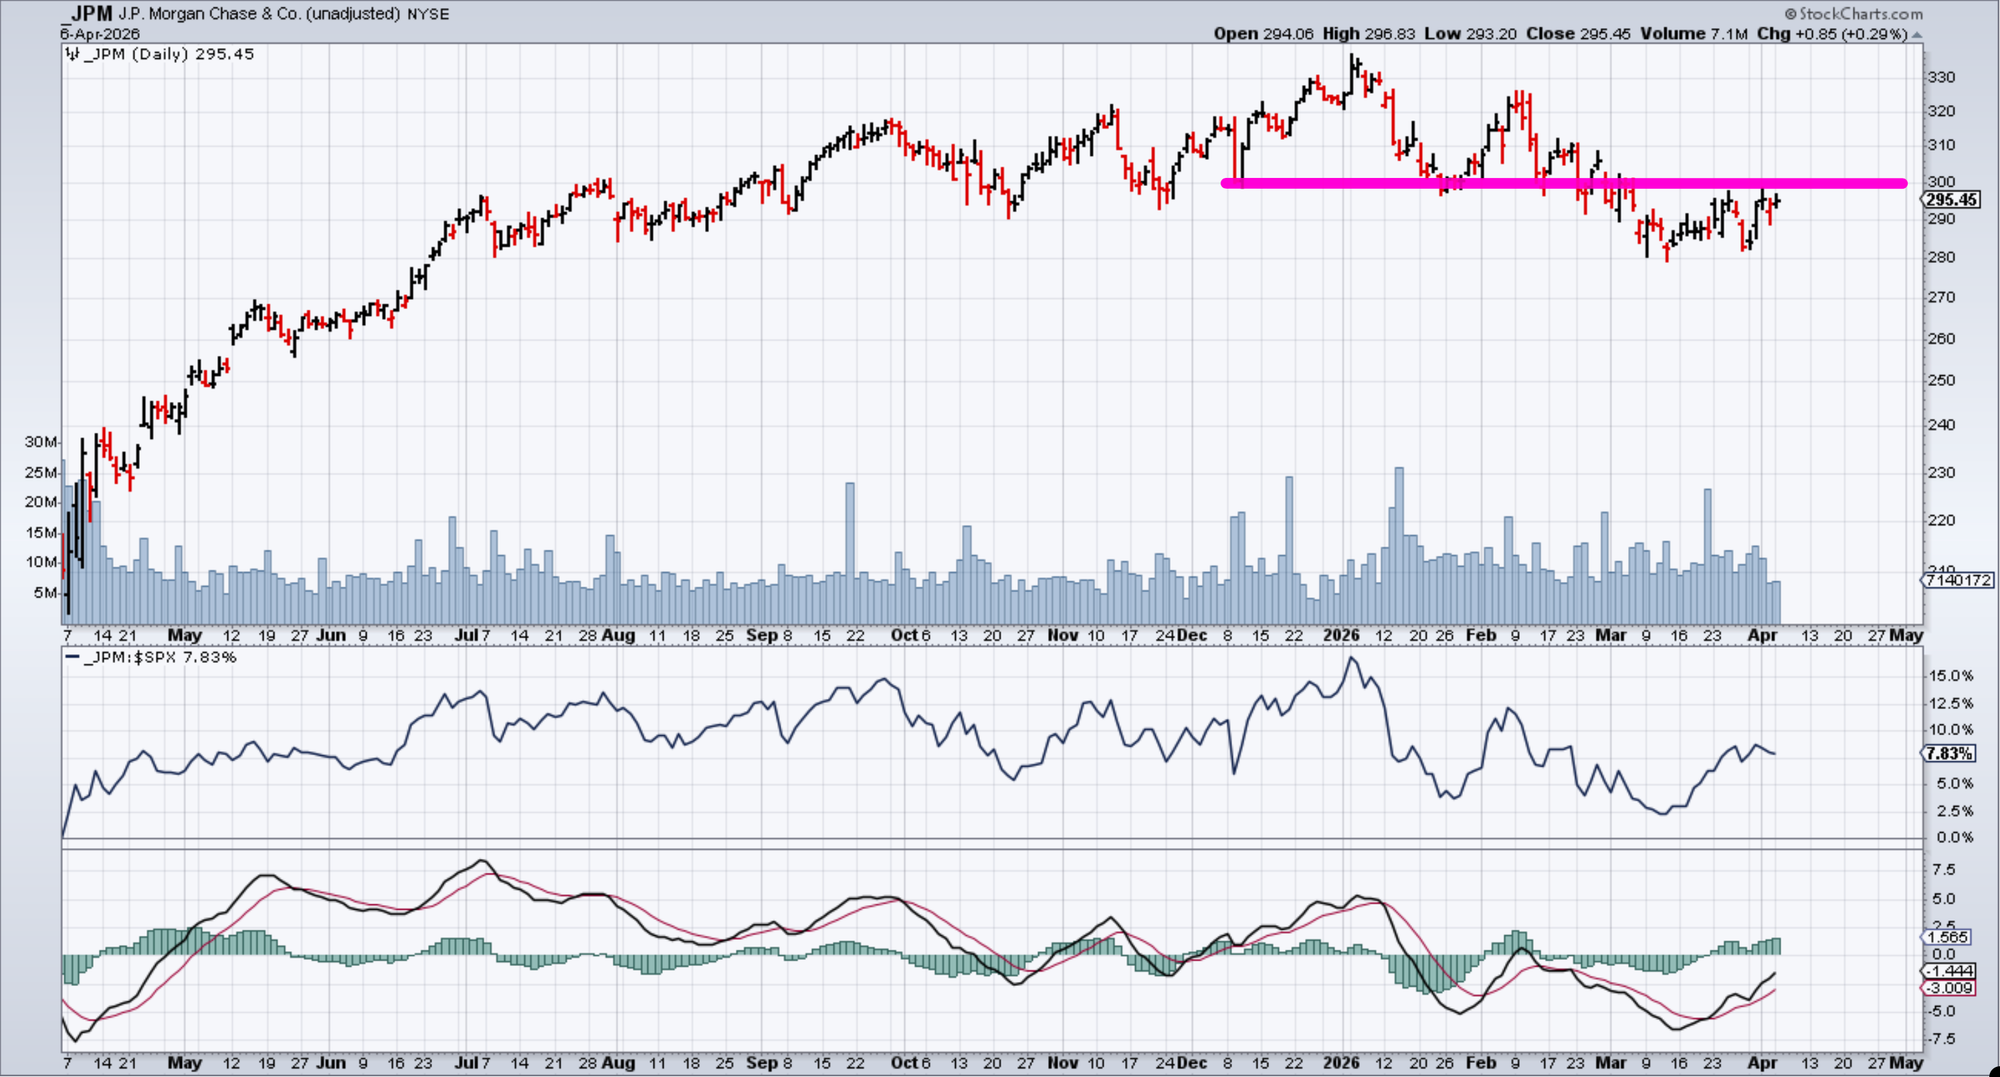
In technical analysis, broken support becomes new resistance. We are seeing JPM perfectly reject this $300 ceiling. Momentum is rolling over, and buyers are exhausted. The stock is positioned for its next violent leg lower.
One Way to Structure the Trade
In our last trade, we used a put spread to reduce cost. This time, because JPM is positioned right at a resistance level with a fundamental catalyst (earnings + regulatory fears) on deck, we want uncapped downside potential.
We identified an optimal Long Put strategy that gives us pure directional exposure to the breakdown.
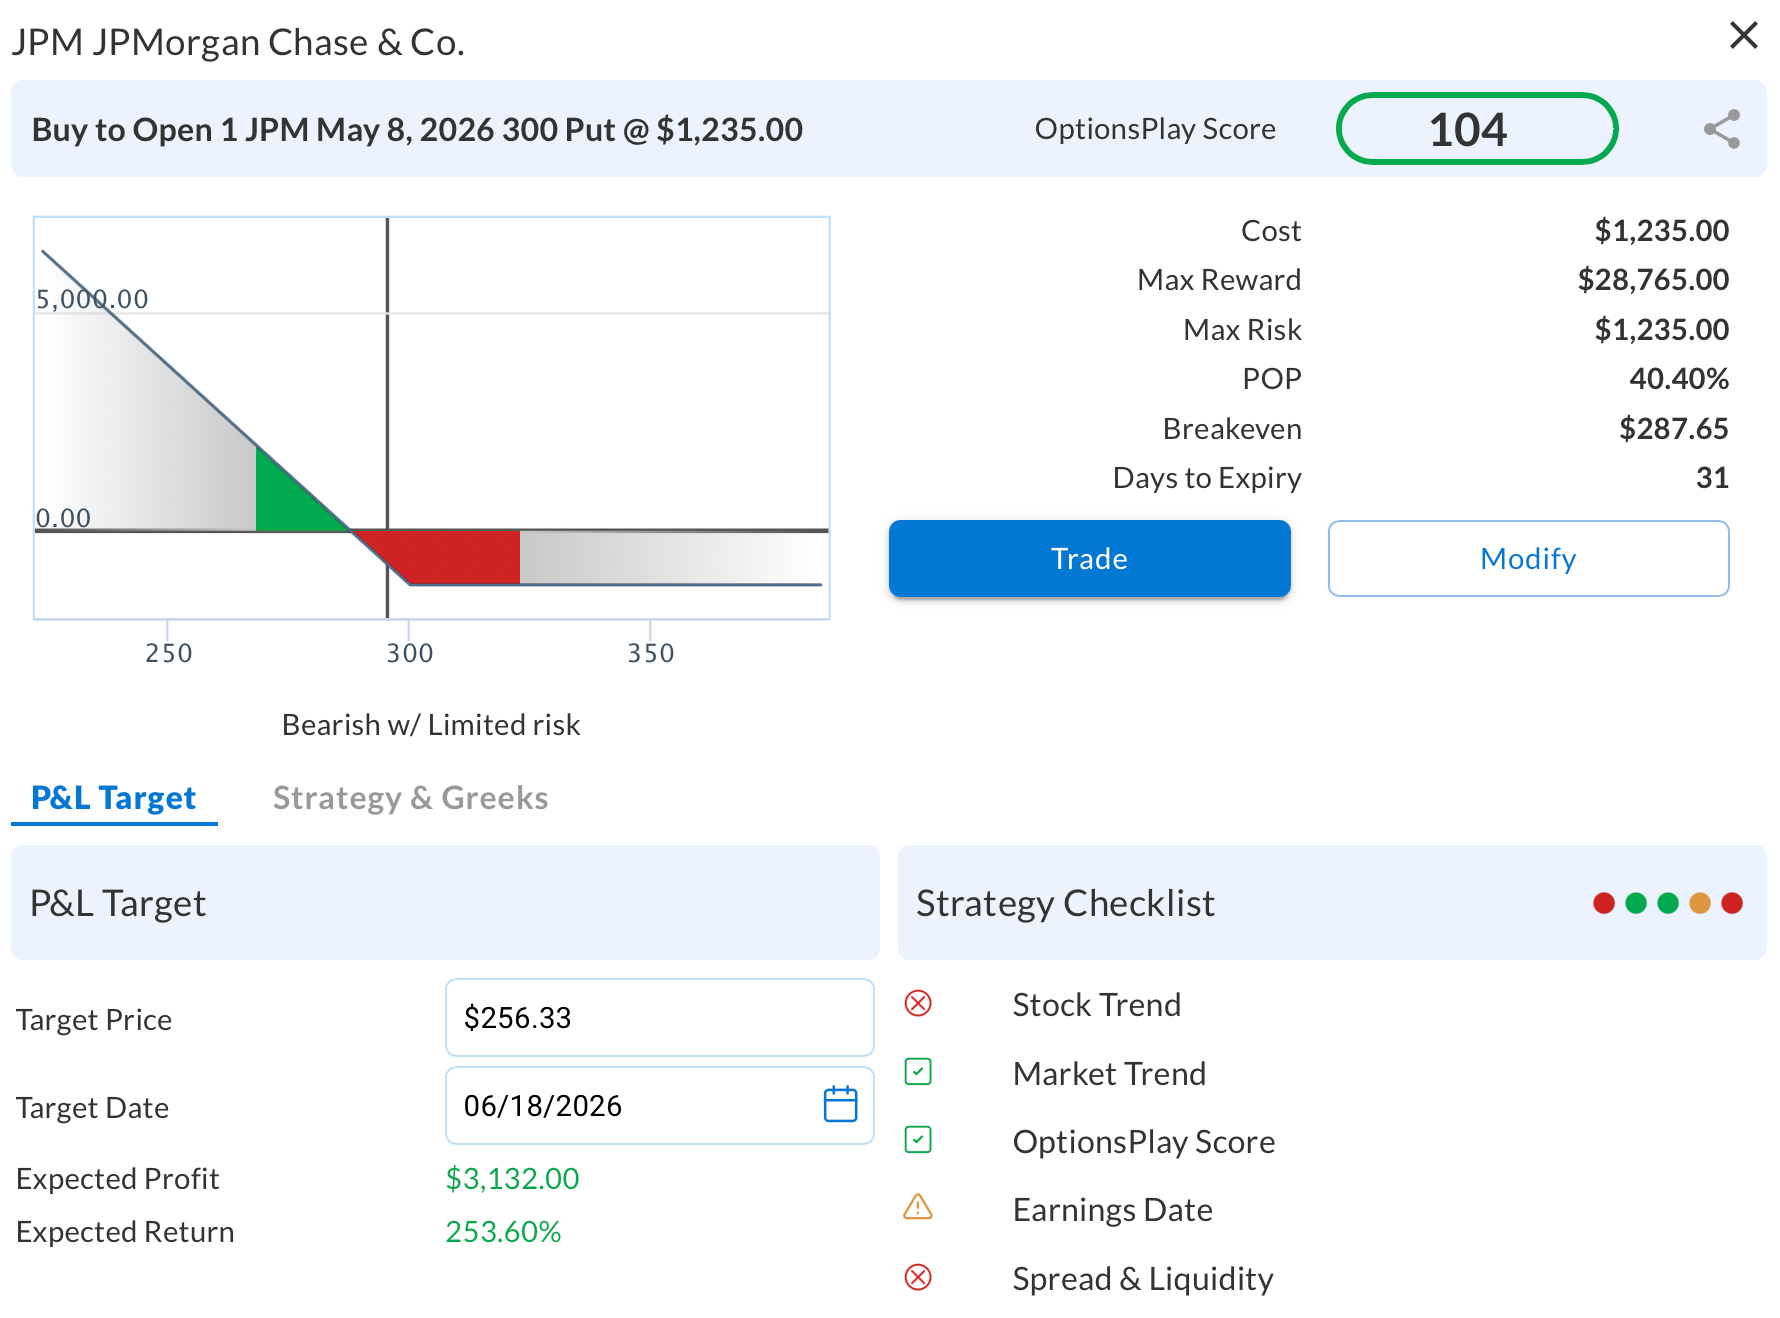
The Trade:
- Strategy: Long Put
- Expiry: May 08, 2026 (31 Days)
- Strike: $300 Put
- Cost: ~$12.30 ($1,230 per contract)
- Breakeven: $287.70 (Just -2.62% from current price)
Why Is This Setup Attractive?
- Optimal Risk to Reward: We are entering the trade at the $300 resistance line. This gives us a defined invalidation point. If JPM closes above $300, our thesis is wrong, and we exit quickly. If it rejects as expected, the downside is wide open.
- Uncapped Reward: By buying a long put, our profit potential accelerates the further JPM drops. If the impending earnings report reveals the true impact of consumer credit stress, this trade could explode in value.
- Low Hurdle Rate: Because we are buying an at-the-money option, we only need a modest 2.62% drop over the next month just to break even.
Finding Trades Like This in Under 5 Seconds
Traditional workflow to find setups like this:
- Scan for breakouts/breakdowns → 50-100 stocks
- Research fundamentals → Narrow to 10-15
- Analyze options chains → Check liquidity
- Build spreads → Calculate risk/reward
- Compare → Pick the best one
- Time: 3-5 hours.
- Confidence: Low to Medium (always wondering what you missed).
What we did:
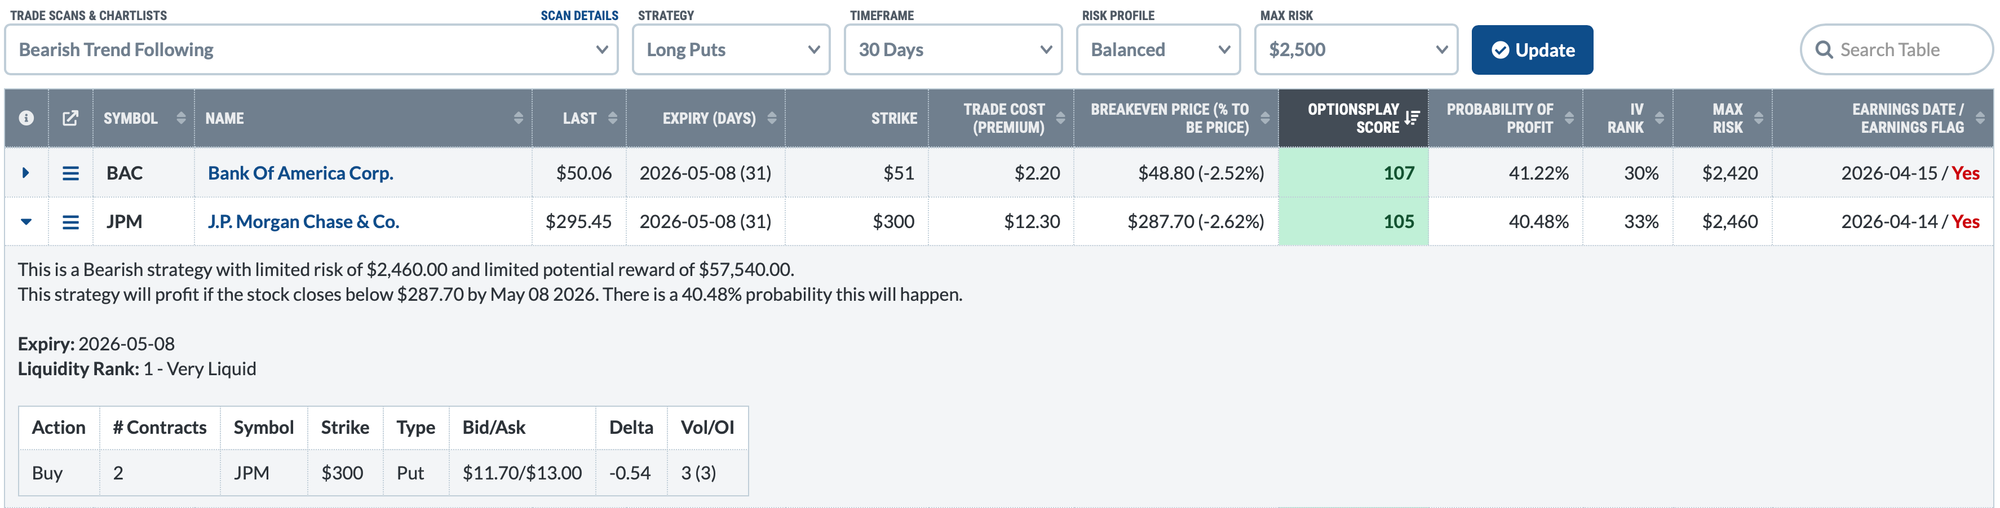
- OptionsPlay Strategy Center → "Bearish Trend Following" scan
- Strategy: "Long Puts"
- Timeframe: "30 Days" / Risk: "Balanced"
- Click "Update"
- Time: 5 seconds.
- Result: JPM at the top with score 105.
The OptionsPlay Strategy Center scans for stocks with optimal technical setups, liquid options, optimal strikes for current IV, and the best expirations for theta/time value balance. Instead of hoping good charts have good options trades, you start with the best options opportunities; then validate the thesis.
The Bottom Line
We already locked in a 144% gain shorting JPM's initial breakdown. Now, the stock has rallied back to re-test the key resistance area at $300 just as regulatory and systemic risks are mounting against its core credit businesses.
The $300 long put expiring in early May gives us a vehicle to capture the next potential leg down, placing us in position before the critical April 14th earnings report.
And we found it in 5 seconds, not by luck, but by starting with the best options opportunities and validating the thesis. That's the workflow transformation.
The OptionsPlay Add-On for StockCharts is available for $40/month and includes the Strategy Center, OptionsPlay Explorer, and hundreds daily curated trade ideas.