AI’s Reality Check: Oracle and Broadcom Earnings Take Center Stage

Key Takeaways
- Oracle and Broadcom earnings offer insight into AI spending discipline and tech leadership.
- Technicals show software struggling while semiconductors maintain strong trends and fresh highs.
- This week’s reports (more importantly, stock-price reactions) may determine whether chips continue outperforming software into 2026.
It’s the last big week of earnings season. Traders might feel like that’s said each week after the bulk of the Mag 7 companies report. But this Wednesday and Thursday will be key to upcoming price action in two slices of the tech space.
First, Oracle (ORCL) issues its Q2 2026 revenue and earnings (and remaining performance obligations) Wednesday night, along with a conference call that begins at 5 p.m. ET. The one-two earnings punch concludes with Broadcom (AVGO) Thursday after the bell. CEO Hock Tan and others may voice important updates on their earnings call, also beginning at 5 p.m. ET.
AI Spending Gets Scrutinized: Investors Beginning to Value Discipline
Together, ORCL and AVGO offer telling clues on the latest in the AI arms race, one from the software side, the other more directly related to semiconductors. But the battle for AI supremacy has become complicated.
Companies are no longer being rewarded for simply throwing money at chips. Investors appear to be placing a higher value on capital-allocation discipline, akin to Meta Platforms’ (META) 2023 “year of efficiency.” Will that be the tech playbook in 2026? It may be too soon to tell, but perhaps we’ll have a firmer bead on it after the ORCL and AVGO reports.
The macro speculators can duke it out on that front. For us, let’s inspect technicals with ORCL and AVGO, and take a broader look at the iShares Expanded Tech-Software Sector ETF (IGV) and VanEck Semiconductor ETF (SMH).
What ORCL’s Technicals Say About the Next Leg
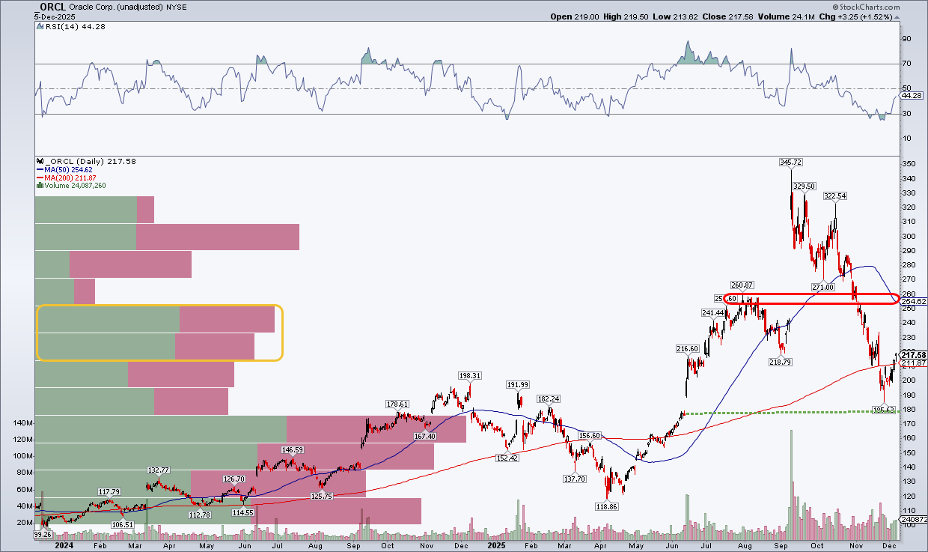
First up is ORCL. The $620 billion market-cap systems software company in the Information Technology sector is down more than 35% from its September 10 all-time high. Recall that shares soared almost 40% after its fiscal Q1 report in September, its best day since the early 1990s. The surge also briefly lifted founder Larry Ellison’s net worth above that of Elon Musk, a classic sign of a top. The Tesla CEO now commands a nearly $200 billion lead on Ellison.
As for ORCL, notice in the chart below that the $186 low may be the crucial spot to watch. The stock is back above its long-term 200-day moving average (which is on the rise, suggesting the bulls still control the primary trend).
That dip to the mid-$180s also entered the gap from the June earnings reaction — the bulls defended that level. Now above $220 as of Monday’s premarket, there remains a significant amount of volume by price up to the now-falling 50dma.
AVGO’s Momentum Puzzle: When Price Climbs but RSI Doesn’t
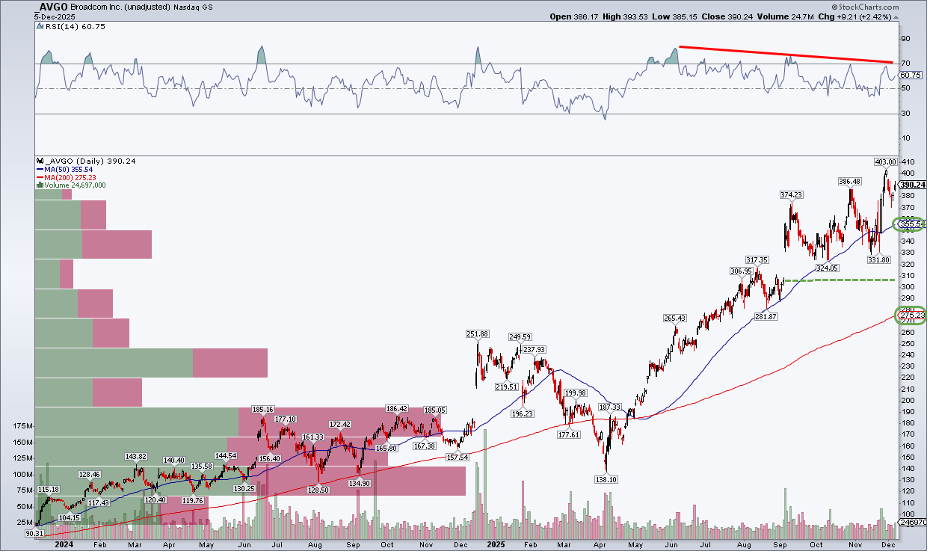
Turning to AVGO, shares of the nearly $2 trillion custom-chip design company are up almost threefold from the April low. The 200dma and 50dma are upward-sloping — always a positive. But look at the RSI momentum oscillator at the top of the chart. It has printed a series of lower highs, all while price stair-steps higher.
That’s bearish divergence between momentum and price, but I’d caution traders not to assume a negative price move post-earnings. RSIs commonly resolve in the price trend of larger degree. So I’d classify it as a yellow flag. Moreover, AVGO bears have not been able to penetrate the September earnings gap on a pair of attempts so far this quarter.
Inside IGV: Software’s Volatile Year Meets a Final Exam
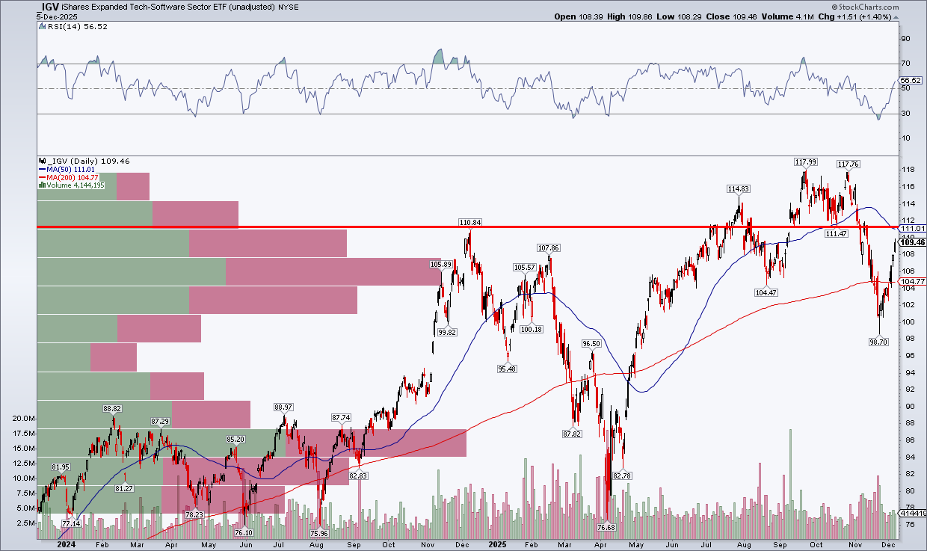
Zooming out, let’s inspect the IGV software ETF, of which ORCL is a significant 5.6% weight. The fund is essentially unchanged from 12 months ago, right before it plunged 30% to a post–Liberation Day low of $76.68.
The 200-dma has flattened, pointing to an ongoing battle between the bulls and bears. Still, the recent reversal and run-up since before Thanksgiving has been impressive, taking the ETF toward its September–October range low of $111–$112. I’d say the onus is on the bulls right now.
Semis Still Rule: SMH Sending Technical Signals
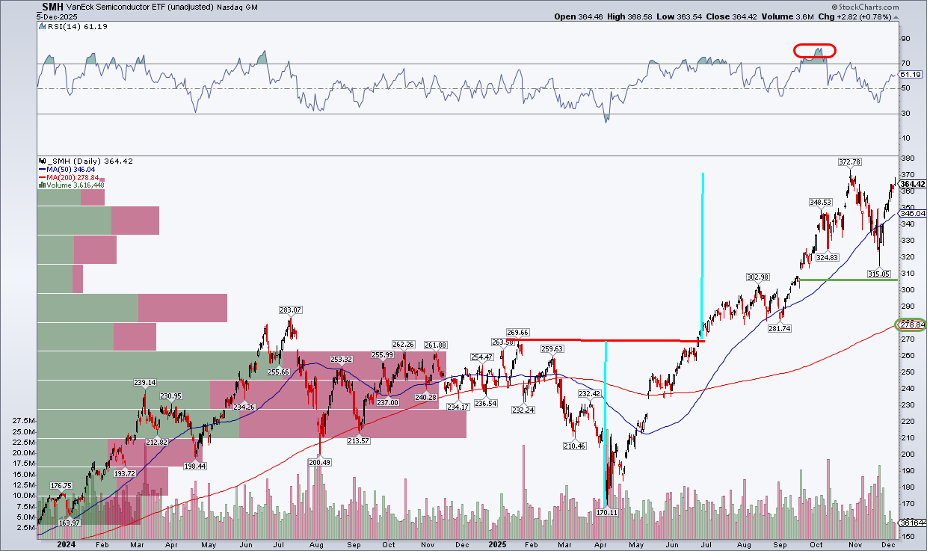
Finally, SMH is doing all the right things. The technical view reveals a rising 200-dma, with the 50-dma above it, and price over both trend-indicator lines. The semiconductor ETF settled last Friday at an all-time high, following a 15% October–November correction. The RSI tagged a nosebleed 83 reading, but the oscillator only fell to about 40 at SMH’s November nadir (generally considered the base of a bullish range).
$370 is an interesting spot, since it’s the measured-move upside price objective based on the Q1–Q2 decline and subsequent breakout. Unlike December 2024, SMH is heading into the new year with a solid head of steam.
The Big Picture: Tech Leaders Face a Turning Point
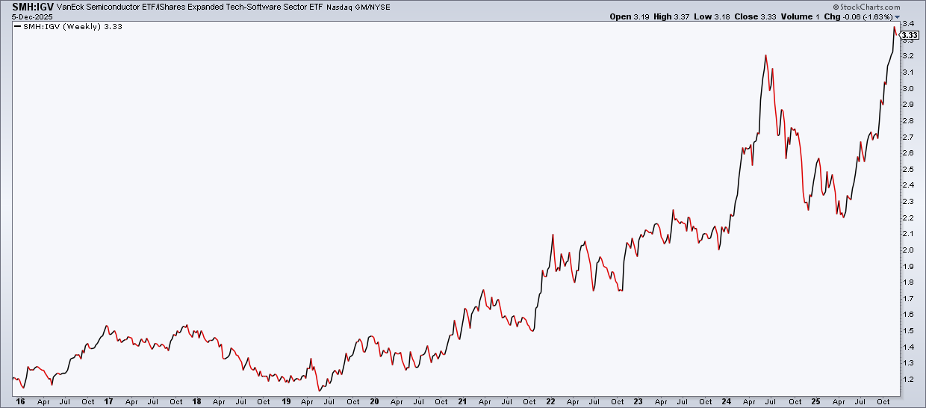
How should you play it? Keeping it simple, the long-term trend clearly favors semis over software. SMH vs. IGV is in a yearslong uptrend (now approaching two decades). While there have been major reversals, relative strength has ultimately favored chip stocks.
The Bottom Line
Putting it all together, there are emerging worries about where big-cap tech will go. Some strategists have made headlines lately, calling for a slowdown in some of this bull market’s leaders. Christmas comes early for fundamental analysts Wednesday and Thursday with Oracle and Broadcom earnings. While not Mag 7 stocks (and ORCL is not even listed on the Nasdaq), you can be sure the tech trade will be in focus.
Disclaimer: This blog is for educational purposes only and should not be construed as financial advice. The ideas and strategies should never be used without first assessing your own personal and financial situation, or without consulting a financial professional.


