Are Your Stocks Keeping Up? Here's How to Check
A quiet week, but be sure to look under the hood.
It was another week of relatively little movement in the stock market. Yes, tariff headlines stirred things up a bit, but as the dust settled, the major indices quietly edged higher.
Here’s their weekly performance:
- Dow Jones Industrial Average ($INDU): 49,625.97 (+0.25%)
- S&P 500 ($SPX): 6909.51 (+1.07%)
- Nasdaq Composite ($COMPQ): 22,886.07 (+1.51%)
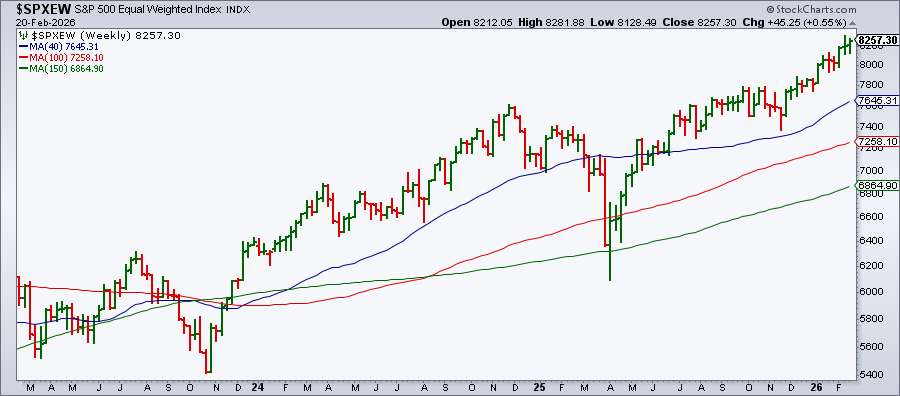
It’s not exactly exciting. What’s more interesting, though, is that the S&P 500 Equal Weighted Index ($SPXEW) finished the week at a record close.
Why does this matter? Unlike the standard S&P 500, which is heavily influenced by mega-cap stocks, the equal-weight version gives all 500 companies the same weight. That means the rally isn’t being carried by the Magnificent 7 but, rather, by the other hundreds of companies in the index.
Want to see what’s really moving?
You may be wondering which stocks are leading right now. Here’s a simple way to find out.
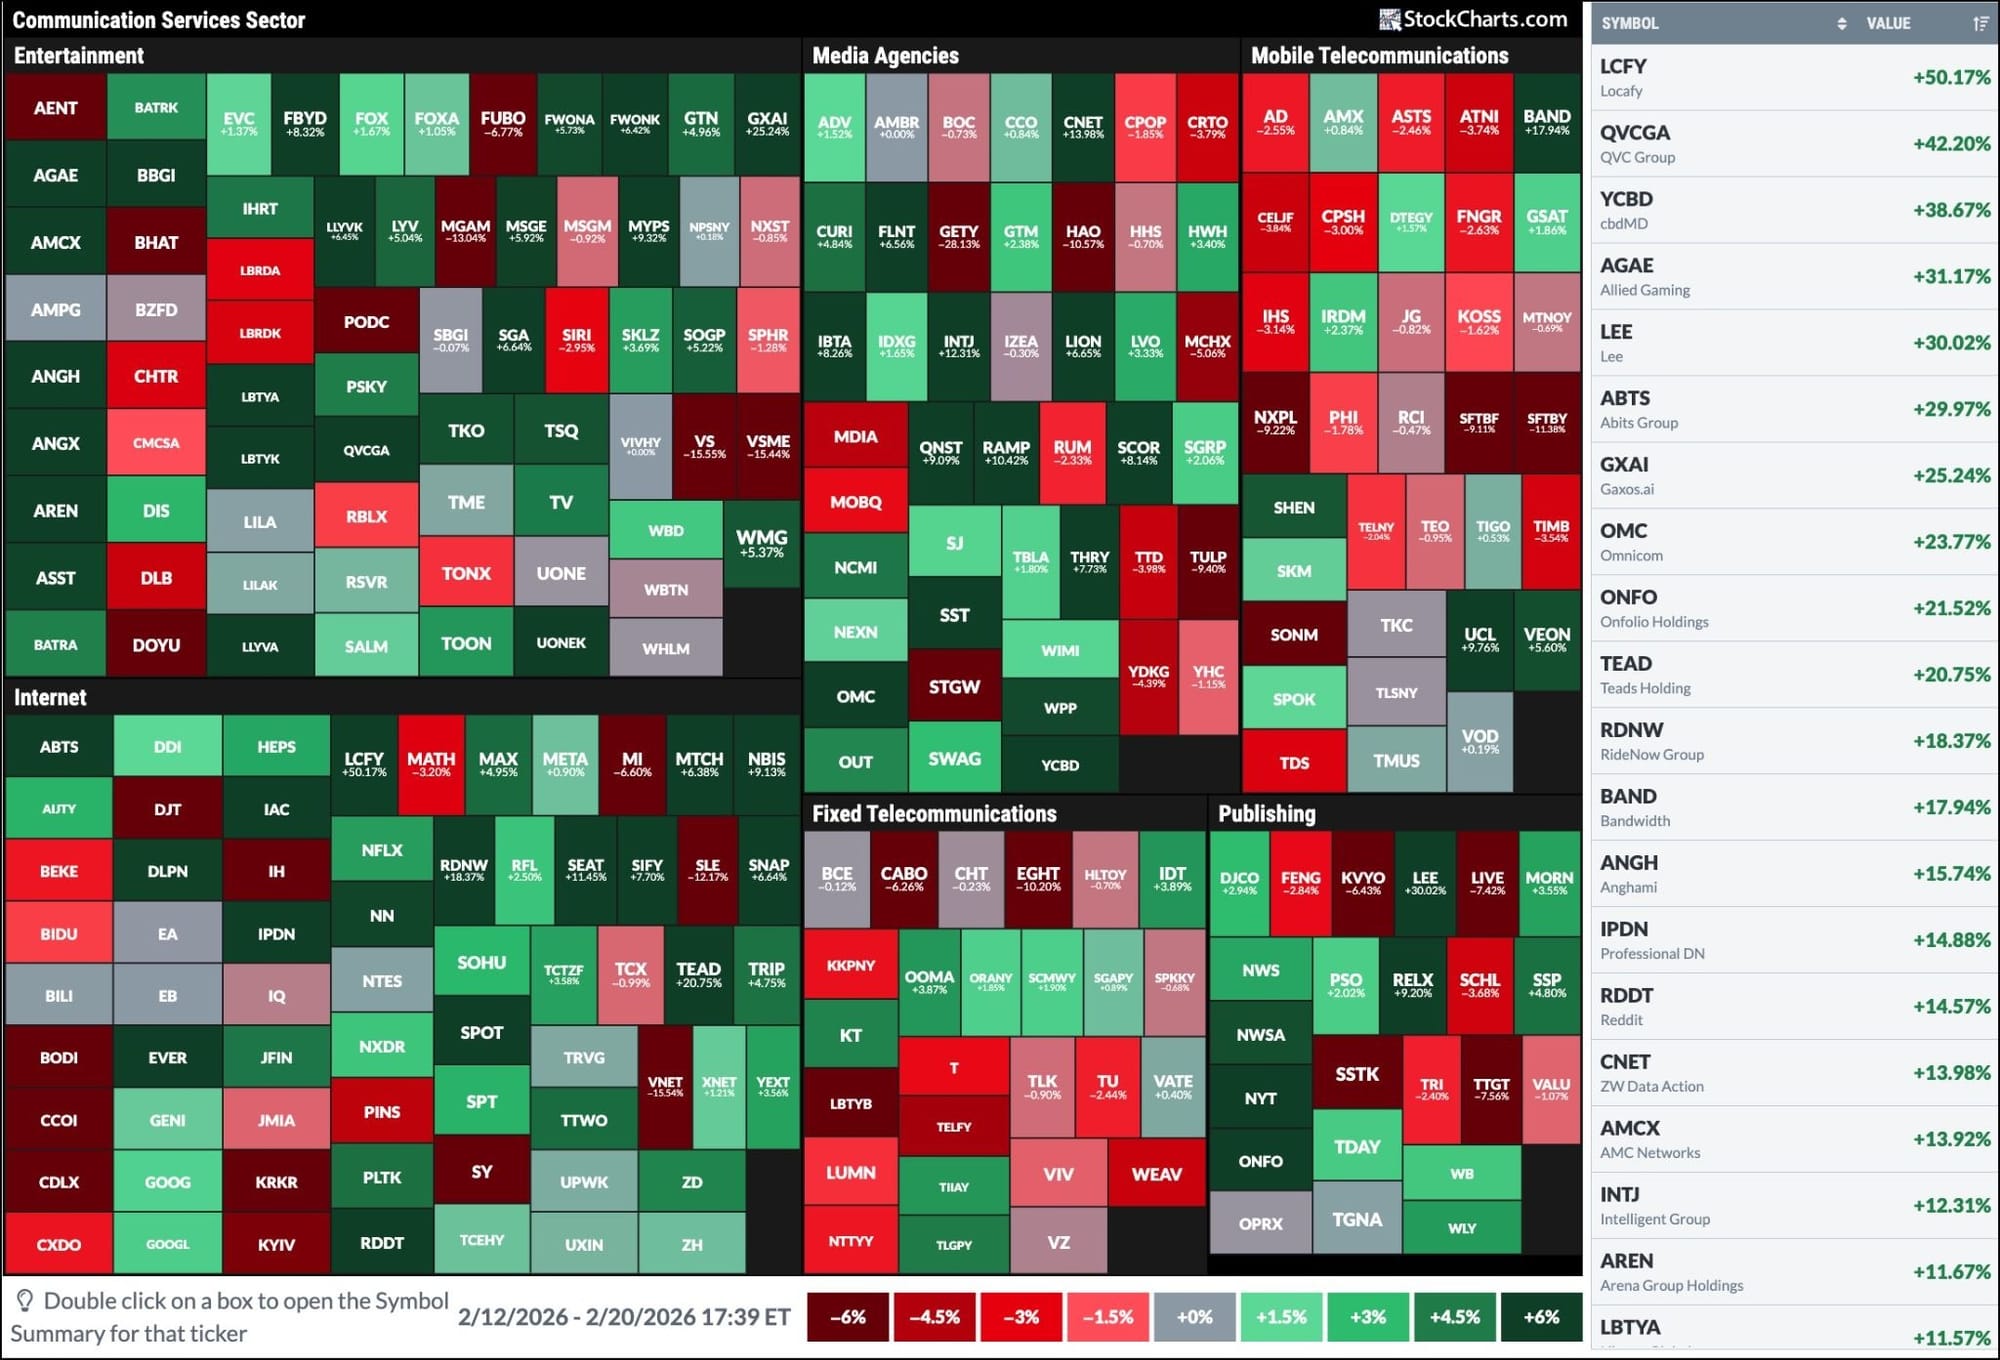
Start with a Sector Drill-Down (from the Sector Summary panel or access it from the Market Summary page) and look at the one-week performance. This past week, Communication Services took the top spot. Which stocks in the Communication Services sector gained the most? When you zoom in using the StockCharts MarketCarpets, a visual heat map tool, you can instantly see the stocks within the sector that drove performance.
To try this yourself:
- Go to the Charts & Tools tab.
- Select MarketCarpets.
- In Select Group, choose Communication Services.
- In Color By, select 5D Change.
- In Size By, choose Equal Weight.
The table on the right (and if you don’t see it, click the Table icon on the top right) displays the performance of the stocks within the Communication Services sector. Note that the two mega-cap giants of this sector, Alphabet and Meta, weren’t the top performers.
Now try this with other sectors. All you have to do is change the sector from the Select Group drop-down.
Take it one step further: How do your stocks compare?
Try to identify stocks in your portfolio using the MarketCarpets tool. Are they outperforming the broader market or lagging it?
Now pull up a chart of a specific stock and analyze its relative performance.
Select Price - Performance as your indicator and add $SYMBOL:$SPX in the Parameters box. This compares your stock’s performance against the S&P 500.
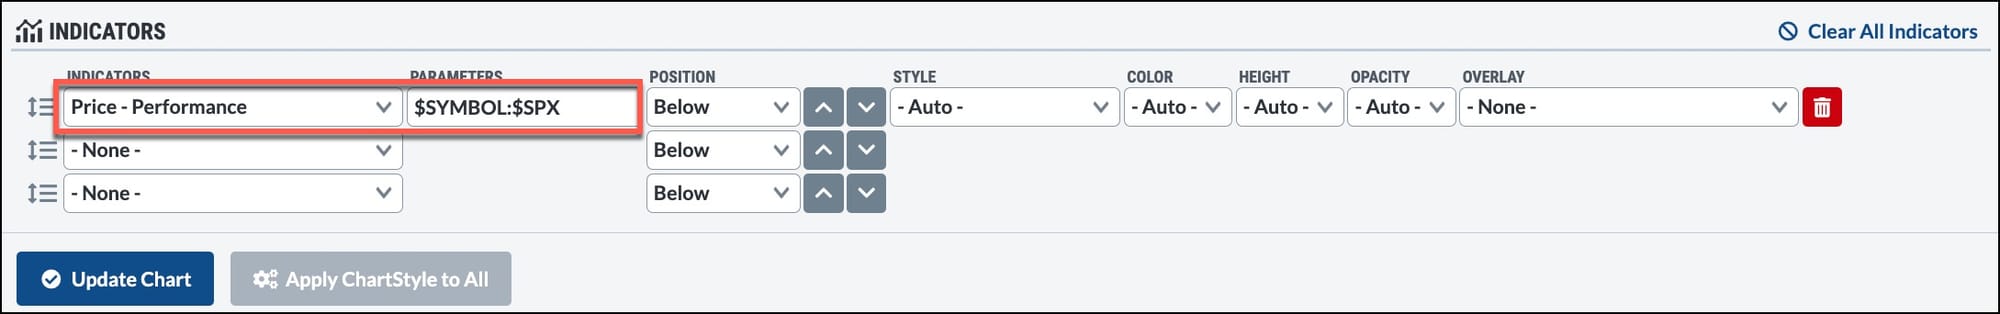
You can compare it against another stock, ETF, or even its sector. Just swap out $SPX for another symbol. Oftentimes, we look at the overall value of our portfolio. But a relative strength analysis can tell you which of your stocks are outperforming or lagging a benchmark.
Looking Ahead
Next week’s calendar is fairly light. The big events to watch are NVIDIA’s earnings and the January PPI. Of course, with geopolitics in focus, volatility can appear when we least expect it. But, for now, the market is showing resilience.
Have a wonderful weekend and Happy Lunar New Year!