Uptrends Expand; Tech Consolidates, Cybersecurity Breaks Out; A Classic Trading Setup; Big Banks Lead

Key Takeaways
- The percentage of stocks above 200-day moving average is expanding.
- Technology SPDR has consolidated within leading uptrend.
- Cybersecurity ETF ends correction with breakout.
- A classic trading setup/signal for CrowdStrike.
- Big bank ETF leads as price and price relative hit new highs.
Percentage of Stocks Above 200-Day Expands
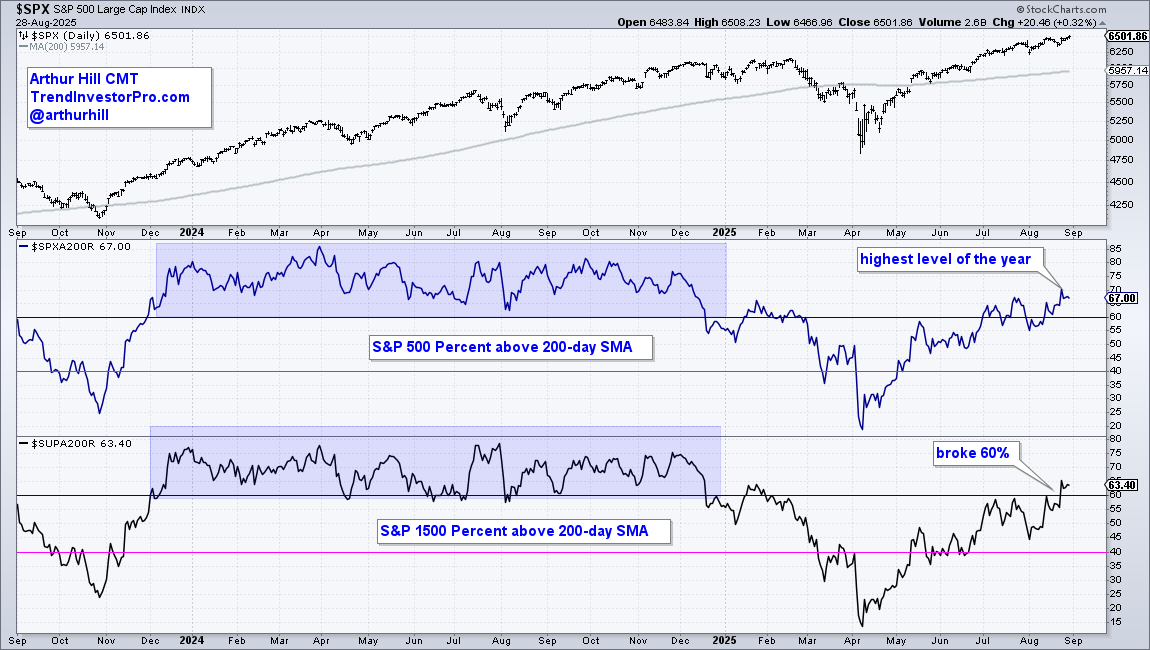
Strength is expanding within the stock market as more stocks move into long-term uptrends. SPX %Above 200-day SMA ($SPXA200R) hit 70% in late August, which is the highest level of the year. S&P 1500 %Above 200-day SMA ($SUPA200R) exceeded 60% for the first time since January. Currently, 63.4% of S&P 1500 stocks are above their 200-day SMAs, which means they are in long-term uptrends. The S&P 1500 is a broad index that includes large-caps (S&P 500), mid-caps (S&P MidCap 400) and small-caps (S&P SmallCap 600). Small- and mid-caps account for most of the recent expansion. Note that these indicators are part of the TrendInvestorPro breadth models for market timing.
Technology SPDR Consolidates Within Leading Uptrend
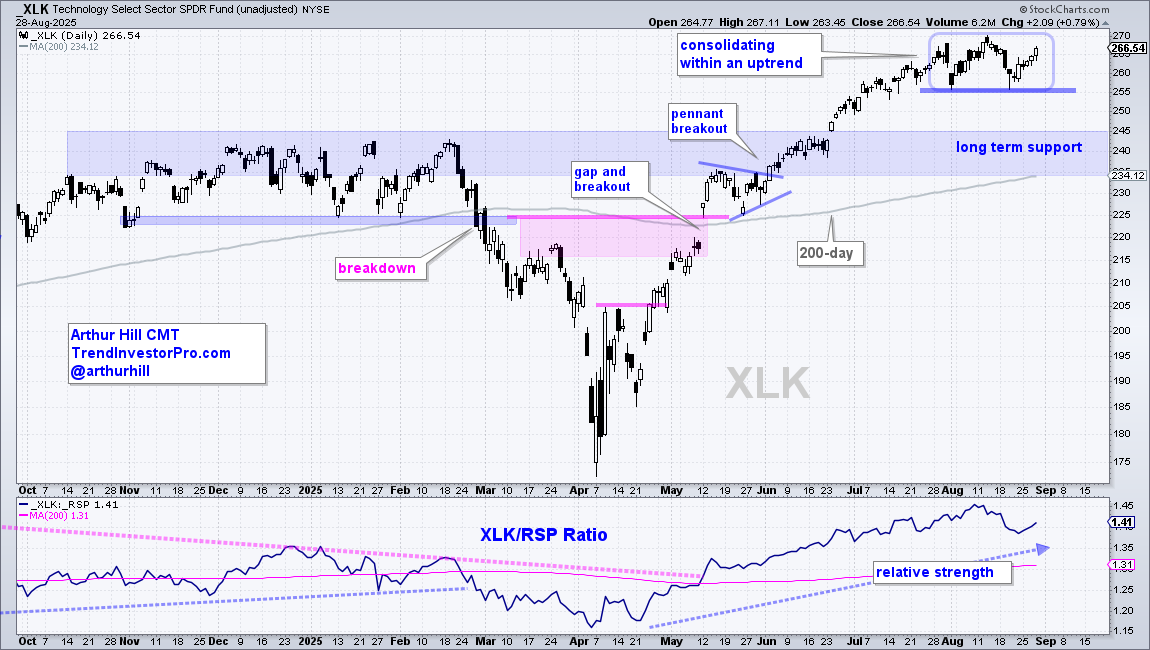
The Technology Select Sector SPDR Fund (XLK) remains in a clear uptrend with a new high in mid August and price well above the rising 200-day SMA. XLK moved sideways in August, which amounts to a consolidation within the uptrend. The two lows in August establish short-term support. All is good as long as 255 holds. A break below 255 would argue for a correction within the long-term uptrend.
Recent reports and videos at TrendInvestorPro:
- Silver breaks out as gold forms classic continuation pattern.
- The biggest holding in the Finance SPDR triggered a big breakout.
- Ten stocks with uptrends, tradable patterns, and/or breakouts.
- New leaders emerging as tech ETFs correct or consolidate.
- Click here to learn about subscriber bonuses and a trial offer.
Cybersecurity ETF Ends Correction with Breakout
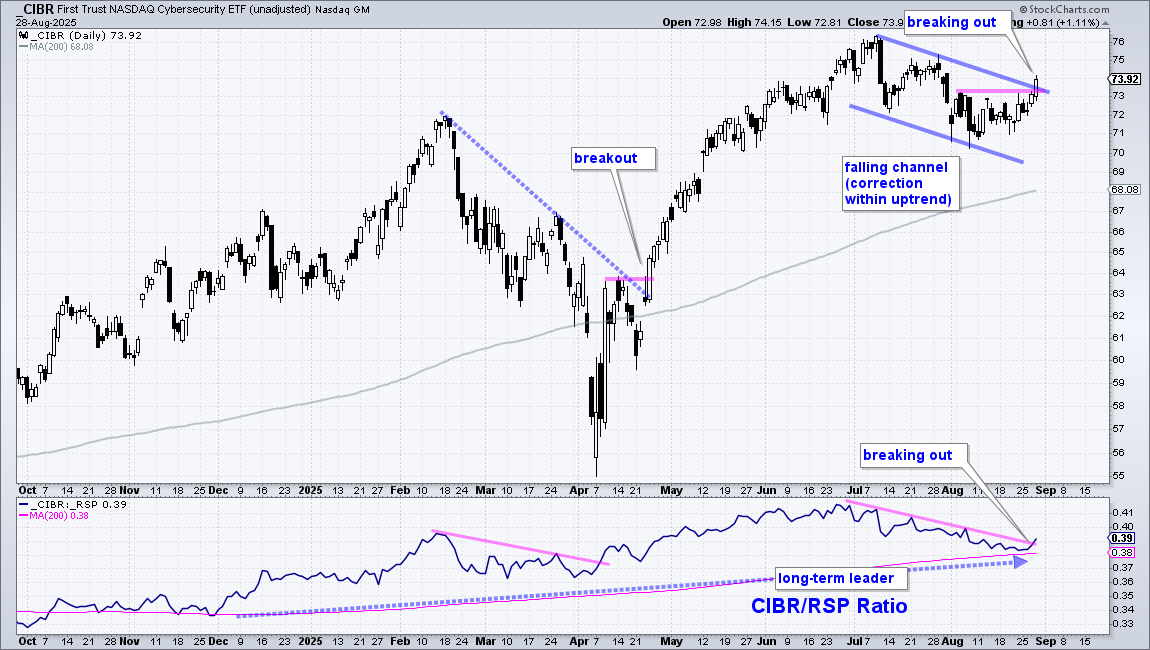
The First Trust Nasdaq Cybersecurity ETF (CIBR) broke falling channel resistance with a surge on Thursday. First and foremost, CIBR is in a long-term uptrend because it hit a new high in July and remains above the rising 200-day SMA. Second, the price-relative (bottom window) is in a long-term uptrend, which means CIBR is outperforming the broader market. The falling channel is viewed as a correction within this leading uptrend. This week's breakout reverses the fall and signals a continuation higher. Also notice that the price-relative (CIBR/RSP ratio) is turning up.
A Classic Trading Setup/Signal for CrowdStrike
CIBR was featured this week at TrendInvestorPro as the falling channel unfolded. CrowdStrike (CRWD), a key holding, was featured two weeks ago as it corrected back towards the rising 200-day SMA. These setups fit with the basic strategy at TrendInvestorPro: trade in the direction of the bigger trend. CIBR and CRWD are in long-term uptrends, meaning pullbacks, corrections, and consolidations are opportunities to trade within these uptrends.
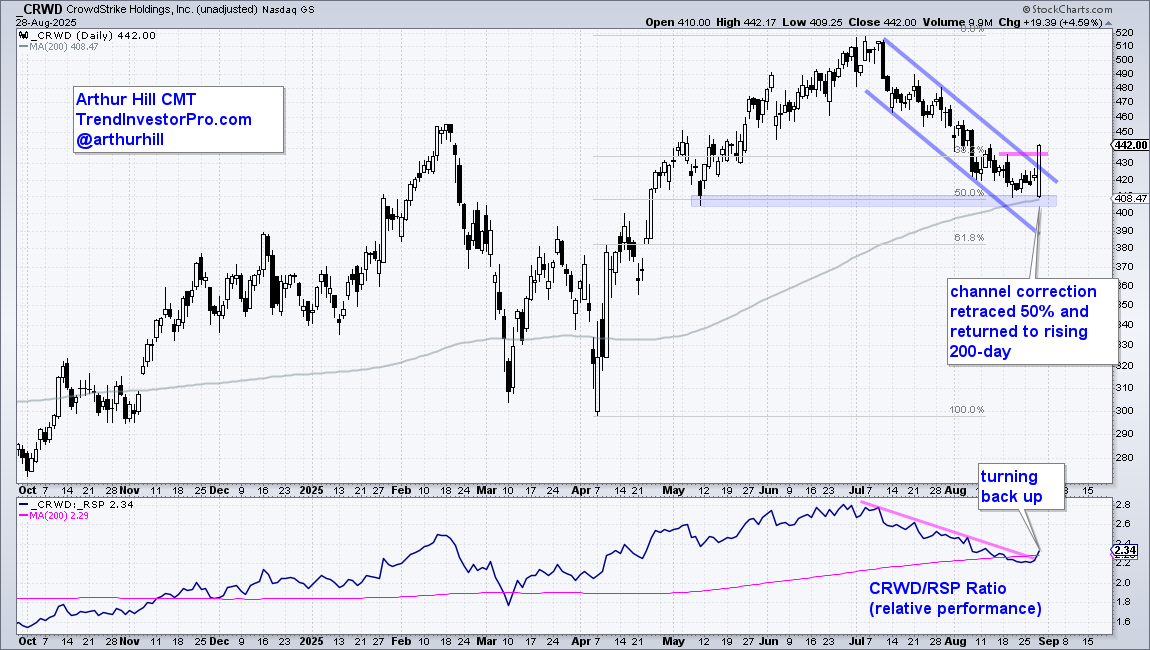
The chart below shows CRWD with a classic setup. After hitting a new high in early July, the stock corrected back to the rising 200-day SMA with a falling channel. This decline also retraced 50% of the prior advance. The April–July advance is two steps forward and the pullback into August is one step backward. It is normal for corrections to retrace half of the prior advance. Retracement levels mark areas to watch for support based on the chart and other indicators. The rising 200-day SMA and early May low act as support (blue shading). With CrowdStrike near support, a bullish trading setup was active for around two weeks. This setup turned into a signal as the stock broke out with an outsized advance on Thursday. This signals an end to the correction and a resumption of the bigger uptrend. A close below the 200-day would warrant a re-evaluation.
Bank ETF Leads as Price and the Price Relative Hit New Highs
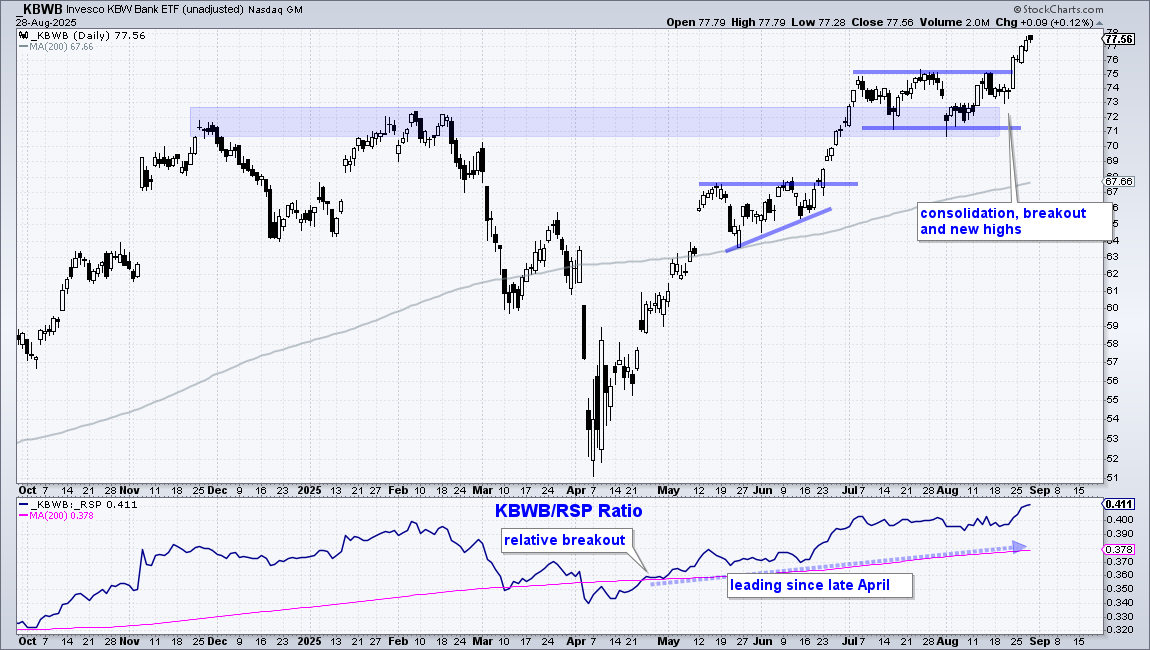
The Invesco KBW Bank ETF (KBWB) is dominated by the big banks which are performing well. Leaders include Goldman Sachs (GS), Morgan Stanley (MS), JP Morgan Chase (JPM), and Citigroup (C). KBWB surged above its 200-day in early May, formed a pennant, broke out in late June, and surged to 52-week highs in early July. The ETF then embarked on a consolidation as the prior high (resistance) turned into support (blue shading). This is classic technical analysis: prior resistance turns support.
KBWB broke out with a surge above 75 last Friday and hit new highs throughout the week. The bottom window shows the price-relative breaking above its 200-day in late April, rising into the summer and hitting a new high this week. KBWB is clearly a leader, and this is positive for the broader market.
