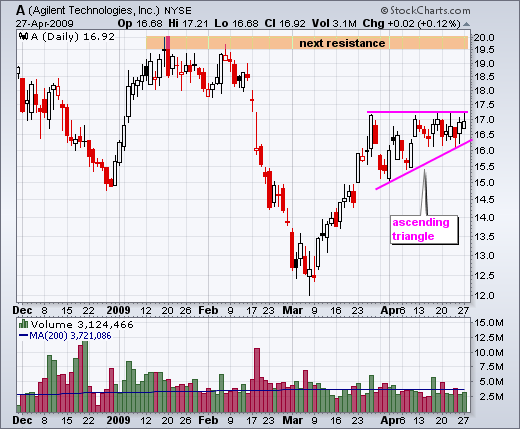
Agilent Traces Out Ascending Triangle
Agilent Technology (A) surged in March and then formed an ascending triangle over the last 4-5 weeks. These classic patterns are bullish continuation patterns that require confirmation with a breakout.
The equal highs around 17.2 mark overhead supply (resistance). The higher lows in April show buying pressure (demand) coming in at higher and higher lows. A break through overhead supply would confirm the pattern. This in turn would target a move towards the next resistance zone around 19.5-20. A move below support at 16 would negate this pattern.


