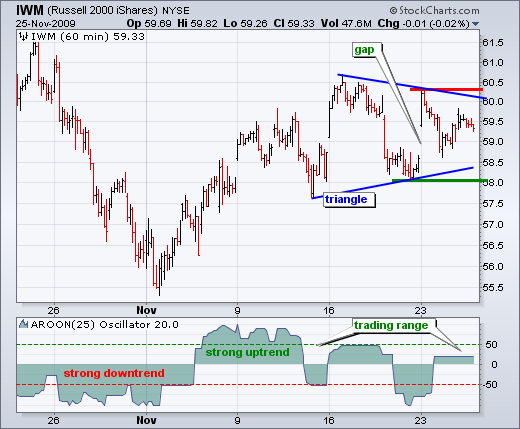
IWM traces out symmetrical triangle
The Russell 2000 ETF (IWM) is stalling with a symmetrical triangle over the last two weeks. Because the prior move was up, there is still a bullish bias overall. However, the ensuing break will determine the next directional signal for IWM. A move above this week's high would signal a continuation higher, but a break below 58 would signal a bearish reversal.

I am using a 60-minute chart to show changes in the Aroon oscillator over the last five weeks. There was a strong downtrend in late October as Aroon remained mostly below -50. A strong uptrend started in early November with the surge above +50. This did not last long as the indicator moved back to -50 in mid November. Since then Aroon has not been above to hold above zero for any length of time. This reflects choppy trading and the symmetrical triangle. Another move below -50 would turn this indicator bearish.


