SPY firms at range support
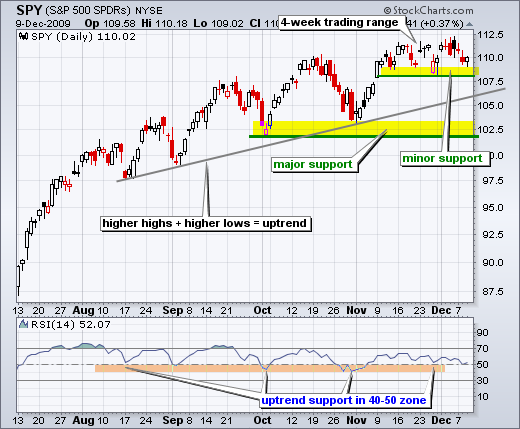
The major index ETFs remain in medium-term uptrends and short-term trading ranges. After a 3-4 day pullback, SPY firmed near the bottom of its four week trading range. The whole world is watching range support for a break that would be negative. Technically, a support break here would argue for a pullback within the larger uptrend. However, don't be surprised if we get a range support break and then a rally. There are a number of factors working against an extended decline or sharp pullback. First, the medium-term or bigger trend is up. Second, seasonality is bullish as we head into the last few weeks of the year. According to Sentimentrader.com, the odds favor mixed trading the next five trading days and then there is a clear upward bias from December 21st. This is the so-called Santa Claus rally. It does not always happen, but history shows a bullish bias towards yearend. Third, techs showed relative strength yesterday and small-caps have been showing relative strength the last few weeks.

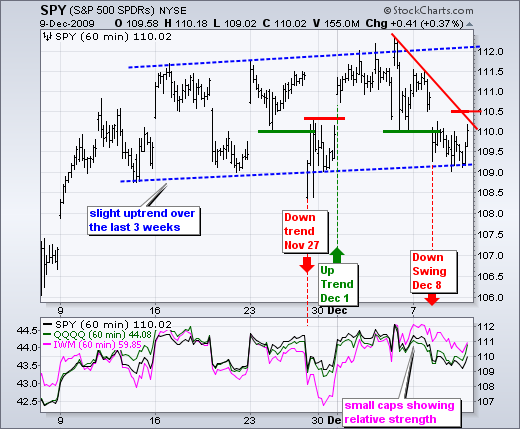
On the 30-minute chart, the S&P 500 ETF (SPY) has been working its way higher with a choppy advance since mid November. The blue dotted lines show a (slightly) rising price channel. The swing within this channel is currently down after the support break at 110. Despite Tuesday's gap down, SPY managed to firm at support and then bounce yesterday afternoon. While the bounce affirms support in the 109-109.5 area, the gap is still holding and I would look for follow through above 110.5 before considering a swing reversal. A breakout and new upswing would target a move above 112.

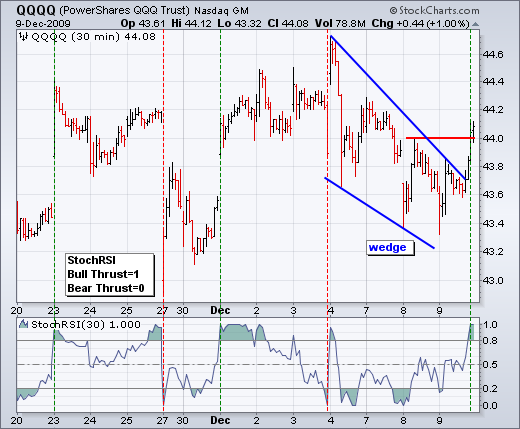
The Nasdaq 100 ETF (QQQQ) sports a falling wedge breakout with the surge above 44 yesterday. Also notice that StochRSI surged to 1 for the first time since December 2nd. Surges to 1 are considered a bullish momentum thrust, while plunges to 0 are a bearish momentum thurst. Even though this indicator is prone to whipsaws in a trading range, sustainable short-term trends are often started with strong thrusts. Movements that fall short just of 1 or fail to actually hit the zero line don't cut the thrust mustard.

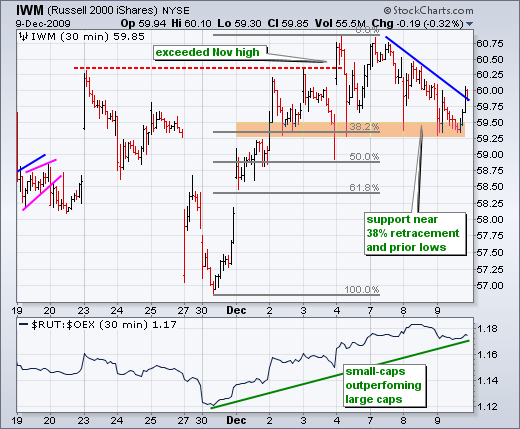
IWM started showing upside leadership with the surge above its November high. Trading has since turned choppy, but IWM is finding support near the 38% retracement and the prior lows (59.25-59.5). Also notice that IWM surged Wednesday afternoon. Follow through above 60.1 would reverse the 3-4 day downswing.


