StockCharts Logo StockCharts Icon
  • Log In
  • Free Trial
  • Welcome
    •   Your Dashboard
    •   Your ChartLists
    •   Your Scans
    •   Your Alerts
    •   Notifications
    •   Your Account
    •   Support Center
    •   Contact Us
    •   Log Out
  • Symbol Summary
  • SharpChart
  • ACP
  • Point & Figure
  • GalleryView
  • Seasonality
  • Options
  • PerfChart
  • CandleGlance
  • RRG
  • Symbol Lookup
  • Charts & Tools
  • Articles
  • StockCharts TV
  • ChartSchool
  • Your Dashboard
  • Help

Charts of Interest

January 05, 2010 at 06:30 AM
Arthur Hill
by Arthur Hill,
Chief Technical Strategist, TrendInvestorPro.com

AMGN, ANF, DRYS, GERN, GT, IGT, MOT, S , SII, SVNT, XLF, XLY
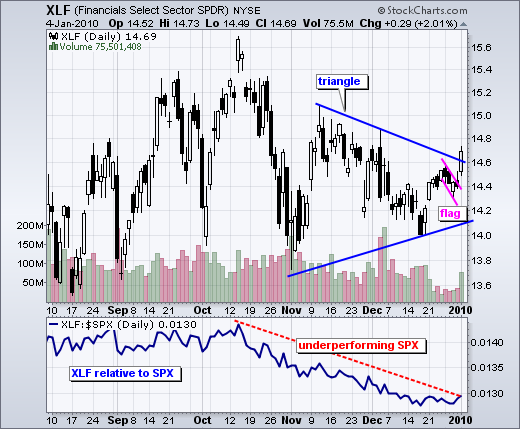
100105xlf


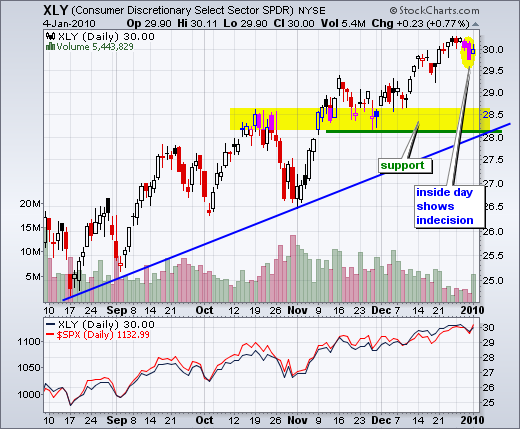
100105xly


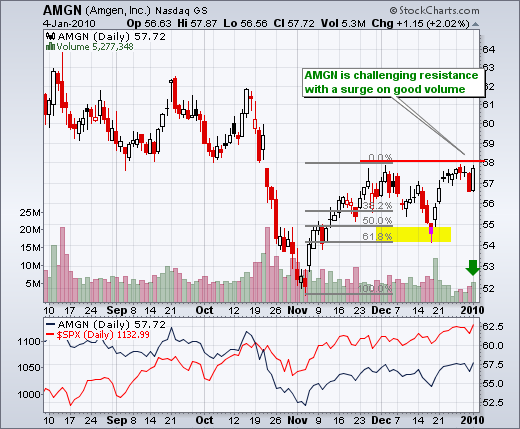
100105amgn


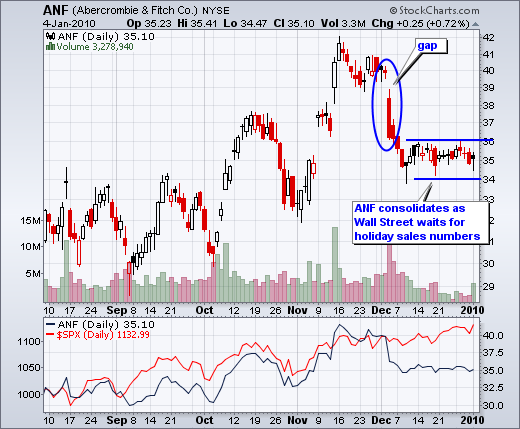
100105anf


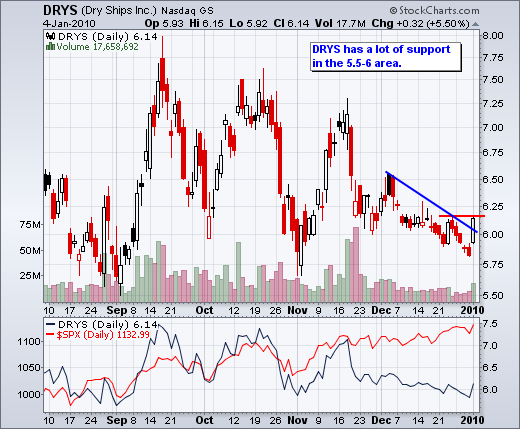
100105drys


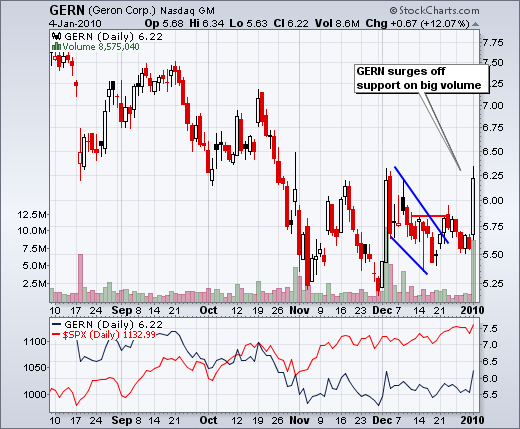
100105gern


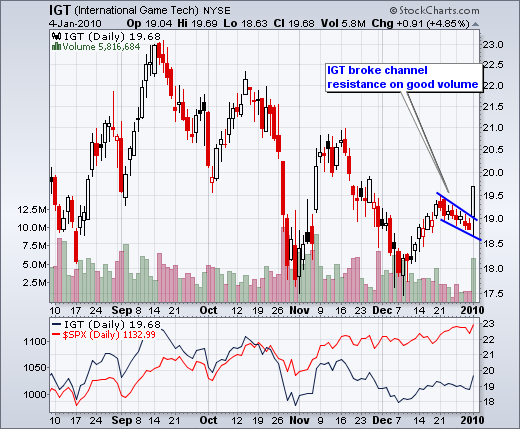
100105igt


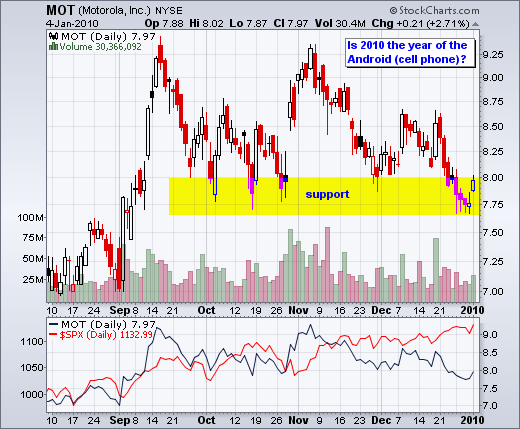
100105mot


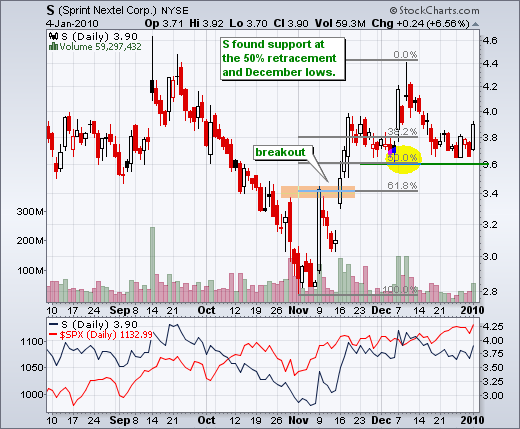
100105s


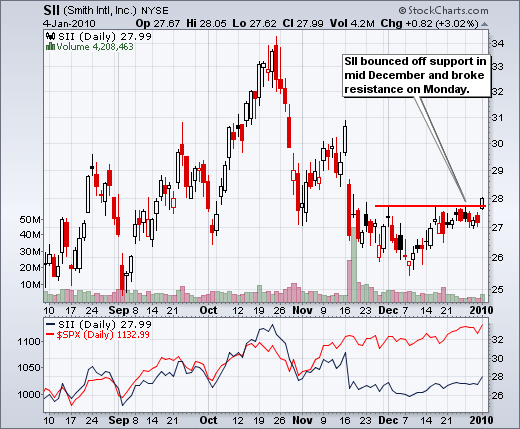
100105sii


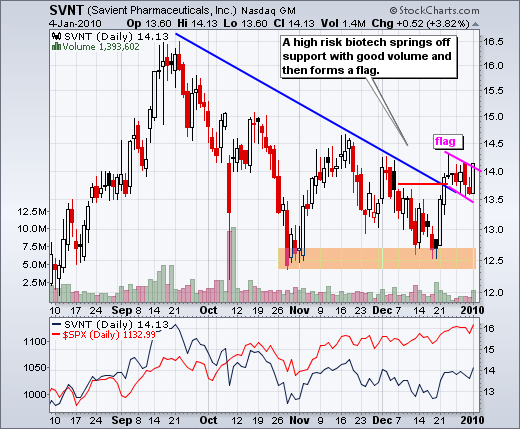
100105svnt
Arthur Hill
About The Author:

Arthur is Chief Technical Strategist at TrendInvestorPro.com. Focused primarily on US equities and ETFs, his systematic approach of identifying trend, finding signals within and setting key price levels has made him an industry-leading technician. Learn More 

 Previous Article Next Article 

Read More

MEMBERS ONLY

Semiconductor chip: NVDA takes spotlight

Jensen > Jay: NVIDIA Takes the Spotlight from the Fed and Mag 7 Earnings

Mike Zaccardi
by Mike Zaccardi,

NVIDIA shares reached a record $5 trillion in market cap. Here's a deep dive into the stock's price action and what could keep it in the driver's seat....   READ MORE 

MEMBERS ONLY

Young man sitting in front of laptop resting chin on hands looking up towards the ceiling

A Few Stocks Are Driving the Market Higher — Should You Be Concerned?

Jayanthi Gopalakrishnan
by Jayanthi Gopalakrishnan,
Director of Site Content, StockCharts.com

Explore what market breadth, S&P 500 trends, and tech earnings say about the strength behind today's rally and what to watch in the days ahead....   READ MORE 

MEMBERS ONLY

StockCharts Insider: Crack the Code of Near-High Breakouts

StockCharts Insider: Crack the Code of Near-High Breakouts

Karl Montevirgen
by Karl Montevirgen,
The StockCharts Insider

Before We Dive In… You’re about to see why traders obsess over 52-week highs, and why not all highs are created equal. I’ll break down what really happens when a stock hits (or hovers just below) that milestone. Even better, I’ll show you how to scan for...   READ MORE 

Featured Articles

MEMBERS ONLY

Semiconductor chip: NVDA takes spotlight

Jensen > Jay: NVIDIA Takes the Spotlight from the Fed and Mag 7 Earnings

Mike Zaccardi
by Mike Zaccardi,

NVIDIA shares reached a record $5 trillion in market cap. Here's a deep dive into the stock's price action and what could keep it in the driver's seat....   READ MORE 

MEMBERS ONLY

Video from Dave Keller CMT showing Perfect Setup vs. Failed Pattern

This Head and Shoulders Pattern Looked Perfect… Until It Failed!

David Keller
by David Keller,
President and Chief Strategist, Sierra Alpha Research

Learn how to spot valid head and shoulders patterns and when to walk away. David Keller, CMT, shows how failed setups can signal strength and potential bullish reversals....   READ MORE 

MEMBERS ONLY

Best Five Sectors

The Best Five Sectors This Week, #42

Julius de Kempenaer
by Julius de Kempenaer,
Senior Technical Analyst, StockCharts.com

Weekly update on US sector rotation based on Relative Rotation Graphs....   READ MORE 

All Articles Follow

Experts


Arthur Hill Arthur Hill Bruce Fraser Bruce Fraser Carl Swenlin Carl Swenlin David Keller David Keller Frank Cappelleri Frank Cappelleri Grayson Roze Grayson Roze Jayanthi Gopalakrishnan Jayanthi Gopalakrishnan Joe Rabil Joe Rabil Julius de Kempenaer Julius de Kempenaer Karl Montevirgen Karl Montevirgen Larry Williams Larry Williams Martin Pring Martin Pring Mary Ellen McGonagle Mary Ellen McGonagle Mike Zaccardi Mike Zaccardi Milan Vaishnav Milan Vaishnav Tom Bowley Tom Bowley Tony Zhang Tony Zhang

Topics


Bonds China stocks Commodities Crypto Earnings Equities ETFs FOMC Forex How To Indicators Interest Rates Market Analysis Members Only Options Precious Metals Sectors Tips & Tricks Tools Trading Strategies Volatility

Featured Articles


MEMBERS ONLY

Semiconductor chip: NVDA takes spotlight

Jensen > Jay: NVIDIA Takes the Spotlight from the Fed and Mag 7 Earnings

Mike Zaccardi
by Mike Zaccardi,

NVIDIA shares reached a record $5 trillion in market cap. Here's a deep dive into the stock's price action and what could keep it in the driver's seat....   READ MORE 


MEMBERS ONLY

Video from Dave Keller CMT showing Perfect Setup vs. Failed Pattern

This Head and Shoulders Pattern Looked Perfect… Until It Failed!

David Keller
by David Keller,
President and Chief Strategist, Sierra Alpha Research

Learn how to spot valid head and shoulders patterns and when to walk away. David Keller, CMT, shows how failed setups can signal strength and potential bullish reversals....   READ MORE 


MEMBERS ONLY

Best Five Sectors

The Best Five Sectors This Week, #42

Julius de Kempenaer
by Julius de Kempenaer,
Senior Technical Analyst, StockCharts.com

Weekly update on US sector rotation based on Relative Rotation Graphs....   READ MORE 

Premium Content


MEMBERS ONLY

These Three Markets Could Get a Boost from Trade Talks

These Three Markets Could Get a Boost from Trade Talks

Martin Pring
by Martin Pring,
President, Pring Research

With U.S.-China trade talks on the immediate horizon, Martin Pring takes a look at commodities poised to benefit. He also presents an update on $GOLD....   READ MORE 


MEMBERS ONLY

Gold Not Just Rallying, But Breaking Out All Over

Gold Not Just Rallying, But Breaking Out All Over

Martin Pring
by Martin Pring,
President, Pring Research

Gold is completing multi-year consolidation or reversal patterns relative to different asset classes, setting the stage for significant breakouts. Here's an analysis of these different intermarket relationships....   READ MORE 


MEMBERS ONLY

What are These Two Reliable Indicators Saying About a Top in Gold and Silver?

What are These Two Reliable Indicators Saying About a Top in Gold and Silver?

Martin Pring
by Martin Pring,
President, Pring Research

There may not be a "holy grail" of indicators, but Martin still finds some techniques particularly helpful in analyzing gold and silver at this critical moment....   READ MORE 

ChartWatchers The StockCharts Newsletter

Get expert technical commentary delivered straight to your inbox! Sign up for our FREE weekly ChartWatchers Newsletter. Learn More

Marketplace


Explore our full collection of exclusive plug-ins and premium add-ons, designed to instantly enhance your investing, trading and charting experience with powerful indicators, data, market insights and other technical capabilities.

 Add-Ons  Plug-Ins  ChartPacks
Explore More

Expert market commentary delivered right to your inbox, for free.

Sign up for our weekly ChartWatchers Newsletter

Learn More  

On StockCharts

  • Charts & Tools
  • Articles
  • StockCharts TV
  • ChartSchool

Members

  • Your Dashboard
  • Your ChartLists
  • Advanced Scans
  • Technical Alerts

Help

  • Support Center
  • FAQs
  • Contact Us
  • Symbol Catalog
  • Pricing

Company

  • About Us
  • What's New
  • Careers
StockCharts.com Logo
Download StockCharts On The App Store Download StockCharts On The App Store Download StockCharts On The Google Play Store Download StockCharts On The Google Play Store

© StockCharts.com, Inc. All Rights Reserved.

  • Terms of Service
  • Privacy Statement
  • Site Map

Market data provided by Xignite, Inc. Commodity and historical index data provided by Pinnacle Data Corporation. Cryptocurrency data provided by CryptoCompare. Unless otherwise indicated, all data is delayed by 15 minutes. The information provided by StockCharts.com, Inc. is not investment advice. Trading and investing in financial markets involves risk. You are responsible for your own investment decisions.