SPY continues support test
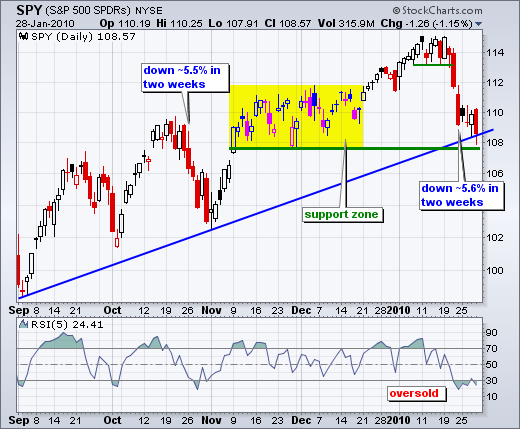
SPY opened strong and closed weak to form a long red candlestick. After three indecisive candlesticks Monday through Wednesday, Thursday's failed rally reflects the skittishness of traders/investors. Even so, SPY remains in a support zone around 109 (plus or minus 1 point). SPY has been fluctuating above/below 109 the entire week. So far, this decline looks similar to the October decline in that it has been short and sharp. SPY declined ~5.5% in two weeks in October and is now down ~5.6% in two weeks. It was tempting to turn bearish in October, but Mr Market managed to hold support around 102 and rebound strongly in November. The current decline represents the first shoe, which is so far just a sharp pullback within a bigger uptrend. Corrections in uptrends tend to be short and sharp. Should the second shoe drop and push SPY below support, we would then have a medium-term trend reversal on our hands.

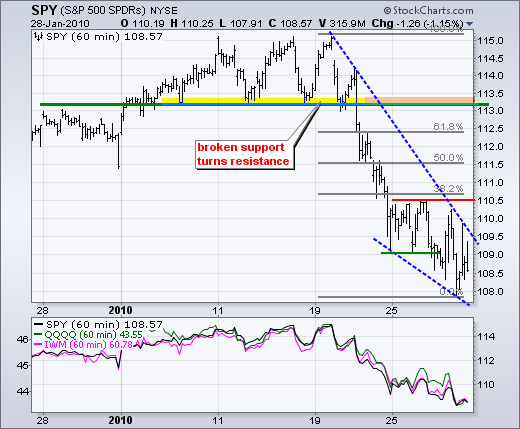
On the 60-minute chart, SPY remains in a short-term downtrend with resistance at 110.5. This level held the entire week. There were four bounces above 110 this week and all four failed (no follow through). It looks like buyers are pulling in their horns and sellers are showing their claws. Put another way, supply is outstripping demand in the 110-110.5 area. Even so, we should not loose sight of the medium-term uptrend, support on the daily chart and oversold conditions on the daily chart. These three factors may ultimately trump the short-term downtrend.


