SPY stalls in support zone
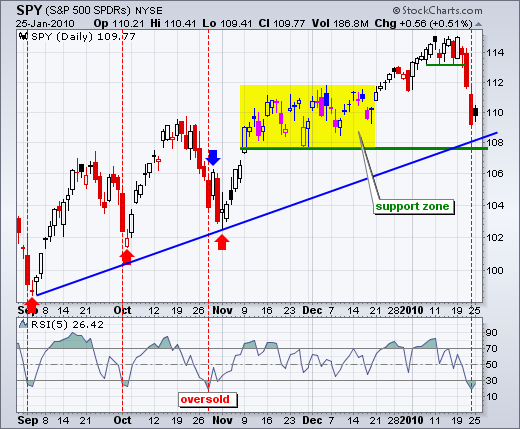
After a long red candlestick and sharp decline on Friday, the S&P 500 ETF (SPY) stalled with an inside day on Monday. Taken together, the red candlestick and smaller black candlestick form a harami, which is a potential reversal pattern. The inside day signals indecision that sometimes foreshadows a change in short-term direction. SPY is short-term oversold after 5-period RSI dipped below 30 for the first time since late October. However, notice that the first bounce attempt failed in late October (blue arrow) and SPY moved lower one more time before finally bouncing. It is possible that SPY moves further towards support before getting an oversold bounce.

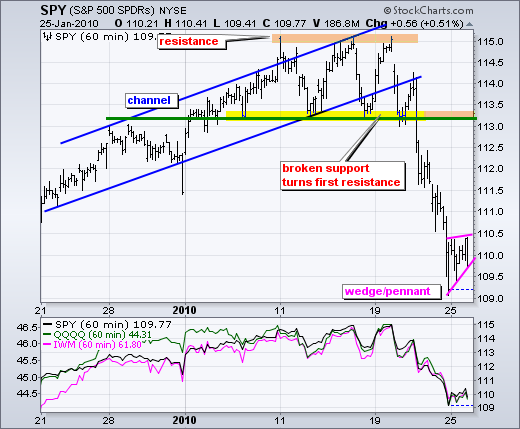
On the 60-minute chart, SPY formed a small rising wedge consolidation on Monday. This could be just a rest before another move lower. A break below wedge support would signal a short-term continuation lower and target a move towards medium-term support on the daily chart (108). It is a tricky time for trading. The medium-term trend remains up and SPY is short-term oversold. However, a bearish pennant-wedge is taking shape and earnings season is in full swing.


