SPY stalls at short-term resistance
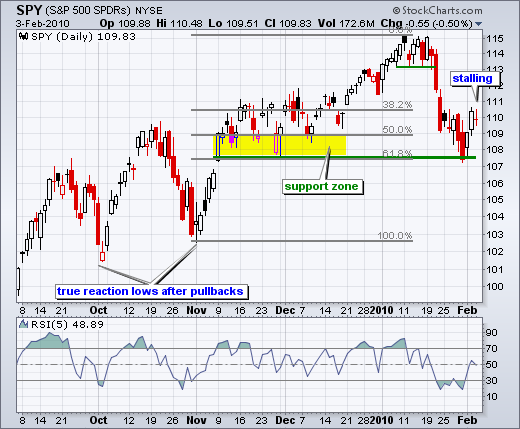
SPY surged off support with two good gains on Monday-Tuesday, but ran into short-term resistance on Wednesday and stalled with a doji. The doji looks like a big plus sign (+). With little change from open to close, the horizontal portion is small or just a line. Vertical lines represent the intraday high-low. Despite movement within the day, prices ended up right where they started. SPY is having second thoughts ahead of Friday's employment report.

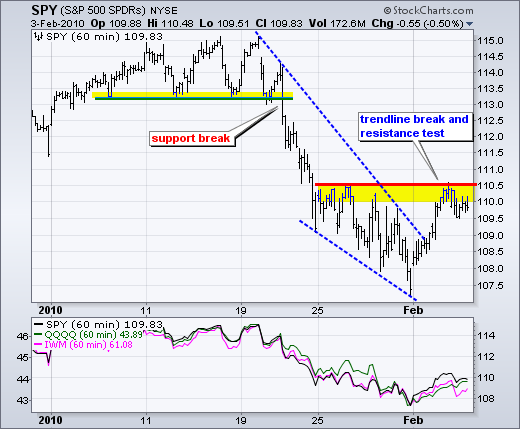
On the 60-minute chart, SPY raced to resistance on Tuesday and hit the wall on Wednesday. This Monday-Tuesday advance is the sharpest two day advance of 2010. But will it hold? A breakout here would open the door to the 112-113 area. Failure would lead to a test of last week's lows and perhaps even a support break. There is also the possibility that SPY moves into a choppy trading range, such as the mid November to mid December period.


