SPY makes it lucky 13
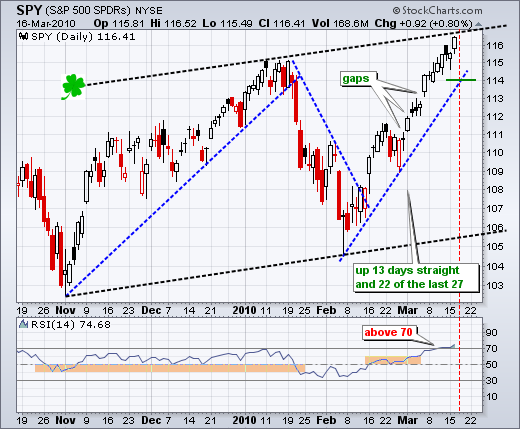
The S&P 500 ETF (SPY) made it a lucky 13 with another advance on Tuesday. There are, hundreds, if not thousands, of indicators and drawing techniques available to the technical analyst. Chances are that one of these indicators or drawing techniques will pick the exact top. Our job is to sift through and find that technique - before using the infallible HSI (Hind Sight Indicator). As you may have guessed, this is tantamount to finding a needle in a haystack. However, it is St Patty's day and I will take a stab here. I first drew a trendline from the early November low to the early February low. Second, I drew a parallel trendline and moved it to the January high. This trendline, which represents the start of a possible channel, projects resistance around 116.5 this week and 117 next week. As far as the current upswing is concerned, the blue trendline extending up from the February low has yet to be tested. RSI remains above 70 as this upswing remains overbought and strong.
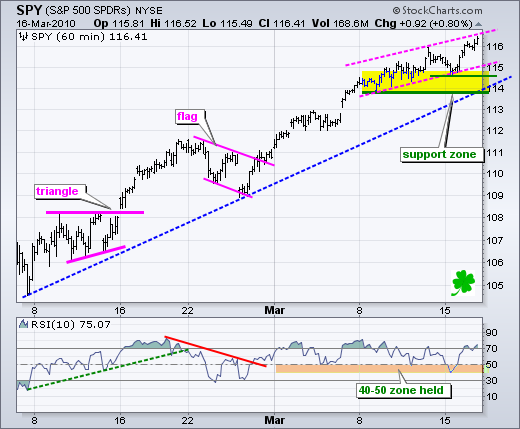
We have yet to see even the first sign of weakness on the 60-minute chart. SPY pulled back a little early Monday, but rebounded into the close and moved above 116 on Tuesday. I redrew the pink channel and raised my support zone to the 114 area. The first sign of weakness would be a break below Monday's low. Further weakness below last week's low would break the February trendline and reverse this uptrend. Even this break would be an early reversal signal because the last true reaction low is at 109 (late February). RSI held the 40-50 zone for the third time this month. A break below 40 would turn this momentum indicator bearish.
Wednesday Mar 17 - 8:30am - Core PPI and PPI
Wednesday Mar 17 - 10:30am - Crude Inventories
Thursday Mar 18 - 8:30am - Core CPI and CPI
Thursday Mar 18 - 8:30am - Initial Claims
Friday Mar 18 - 10:00am - Leading Indicators
Charts of interest are just that: charts of interest. We all need to think for ourselves when it comes to trading our own accounts. First, it is the only way to really learn. Second, we are the only ones responsible for our decisions. Think of these charts as food for further analysis. Before making a trade, it is important to have a plan. Plan the trade and trade the plan. Among other things, this includes setting a trigger level, a target area and a stop-loss level. It is also important to plan for three possible price movements: advance, decline or sideways. Have a plan for all three scenarios BEFORE making the trade. Consider possible holding times. And finally, look at overall market conditions and sector/industry performance.
