The runaway train continues
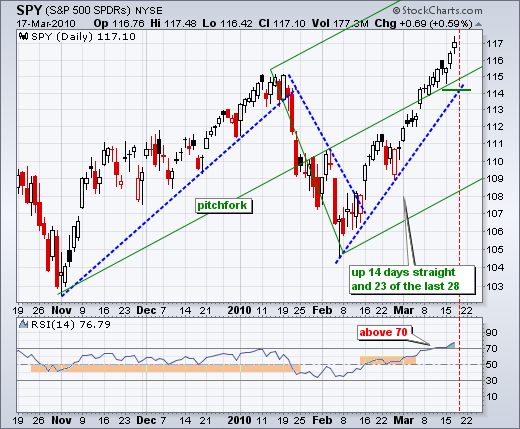
The S&P 500 ETF (SPY) continued higher with a close above 117. Even though the ETF closed up on the day, the candlestick was indecisive with a small body and relatively equal upper/lower shadows. Since the breakout at 108, I count six indecisive candlesticks. It is clear that indecision after an advance does not indicate weakness. It mere reflects a stand-off between bulls and bears when buying and selling pressure are relatively equal during the trading day. Indecision can foreshadow a short-term reversal, but CONFIRMATION is required with some actual weakness. Needless to say, we have yet to see indecision followed by weakness. The blue trendlines show Andrews' Pitchfork. The middle line bisects the line between the January high and February low. Its slope reflects the slope of the current advance, which is quite steep. The outer trendlines are based on the January high and February low. These represent the width of a possible channel. A reversal occurs when prices move below the lower trendline (currently around 109).
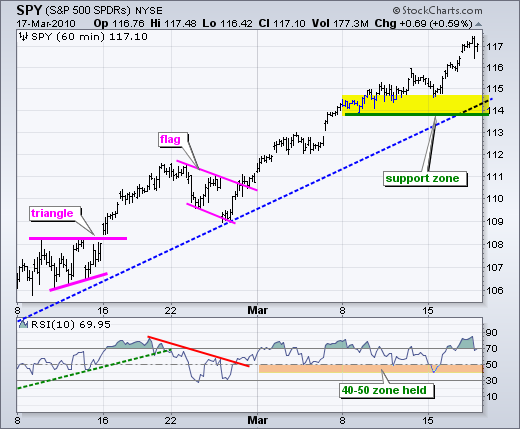
I get the feeling we are in the middle of a melt-up, which is the opposite of a selling climax. Prices are accelerating to the upside as euphoria expands and buyers jump on the bandwagon. There is no telling how far it will extend. SPY is short-term overbought on most accounts, but also in a short-term uptrend - by all accounts. The 114-115 area marks the first support zone to watch. A pullback to this area could entice buy-the-dippers into the market.
Wednesday Mar 17 - 8:30am - Core PPI and PPI
Wednesday Mar 17 - 10:30am - Crude Inventories
Thursday Mar 18 - 8:30am - Core CPI and CPI
Thursday Mar 18 - 8:30am - Initial Claims
Friday Mar 18 - 10:00am - Leading Indicators
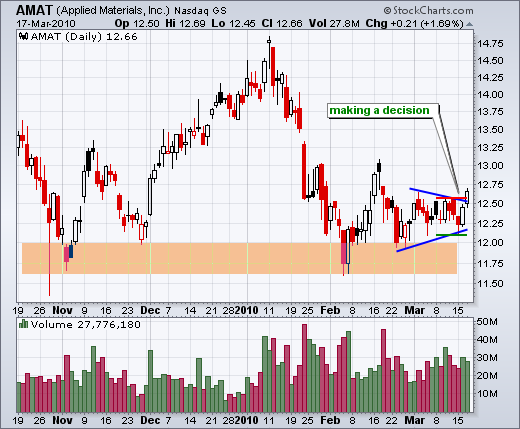
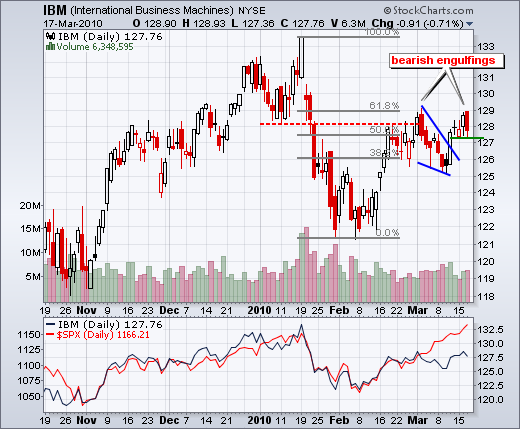
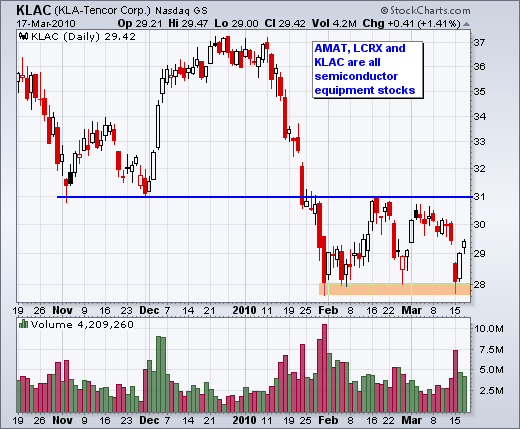
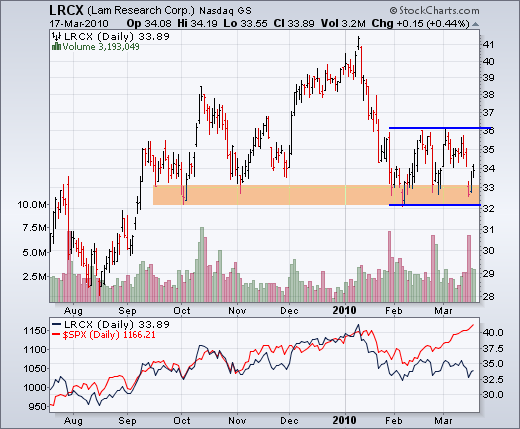
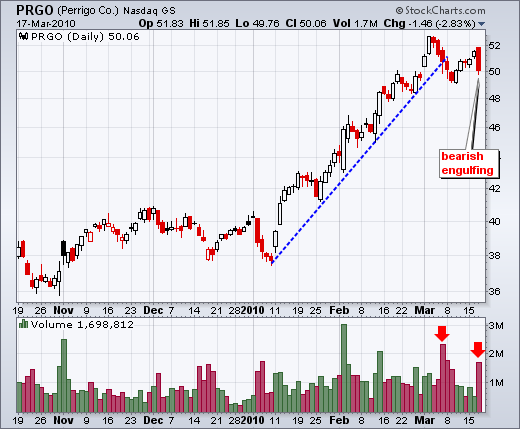
Charts of Interest: AMAT, IBM, KLAC, LRCX, PRGO
