Stocks remain oversold after steep decline
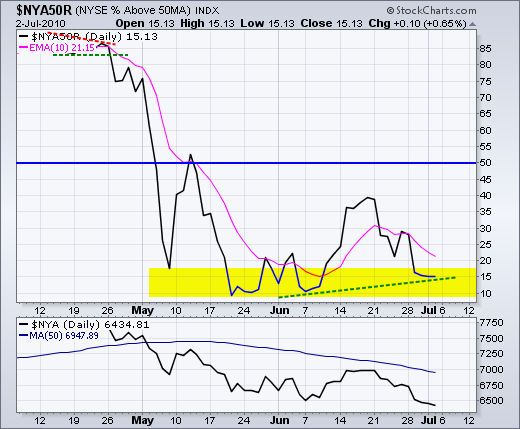
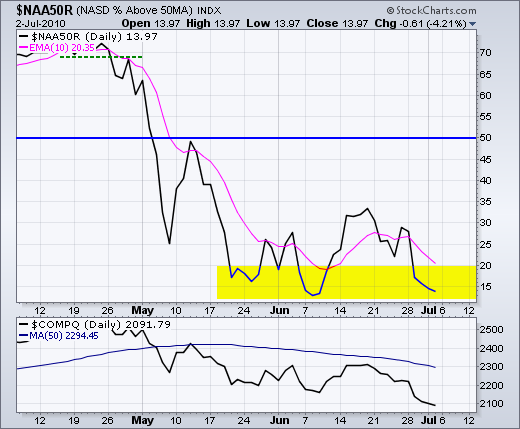
After a steep decline the last two weeks, stocks are deeply oversold and pessimism is running rampant. A story on Bob Prechter's "take cover" forecast is the "most emailed" article in the New York Times. The 50-day SMA closed below the 200-day SMA in the S&P 500 for a dead cross, which has been covered extensively in the financial press. Statistical evidence suggests that a dead cross is neutral at worst. There is also the head-and-shoulders pattern, which has been covered quite extensively as well. An extended decline may certainly be upon us, but pessimism seems to be getting extreme and this could give way to a bounce. The charts below show the percentage of NYSE and Nasdaq stocks above their 50-day moving average dipping into oversold territory.
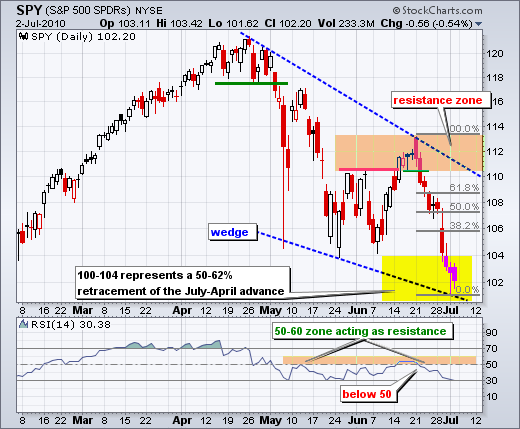
On the daily chart, SPY is down around 10% from its 21-June high. The decline over the last two weeks is pretty much straight down. Nine down days (red candlesticks) and one up day (black candlestick). This too is extreme on the downside. A hammer formed on Thursday, but the SPY fell back on Friday. Nevertheless, the ETF has a large falling wedge working and the 100-104 area marks a 50-62% retracement of the July-April advance, which was the last leg up. This retracement zone marks a potential support zone that could evolve into a reversal. RSI is trading at 30.38, which is oversold for all intents and purposes. At the very least, the time to be short is growing, well, short. Betting on a bounce is still for bottom pickers.
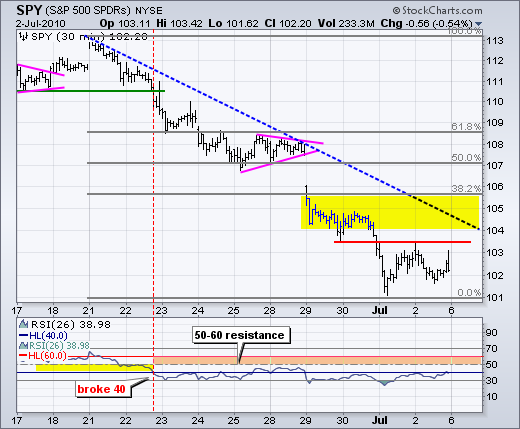
On the 30-minute chart, SPY established resistance at 103.5 with Thursday's high (the hammer high). The ETF attempted a bounce late Friday, but fell back by the close. A break above this level would be the first sign of resilience. Picking the next resistance level is difficult so I am showing the Fibonacci Retracements Tool for potential targets. As noted before, the first bounce may bring out second chance sellers and result in a test of the prior low or a pullback in the form of a falling flag or wedge. Ideally, a falling flag/wedge would provide an identifiable breakout signal to play a second bounce. Mr Market is not always ideal though.
Key Economic Reports:
Tue - Jul 06 - 10:00 - ISM Services
Wed - Jul 07 - 10:30 - Crude Inventories
Thu - Jul 08 - 07:00 - Euro Central Bank policy statement
Wed - Jul 08 - 08:30 - Initial Claims
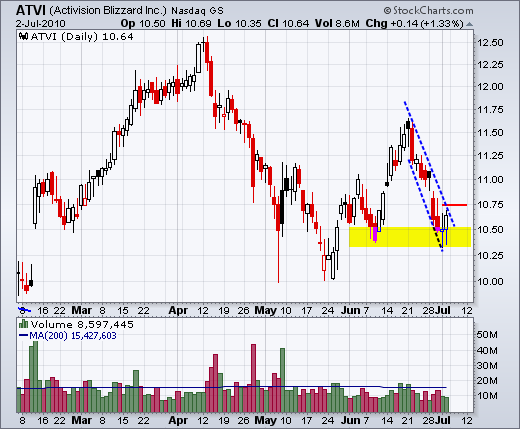
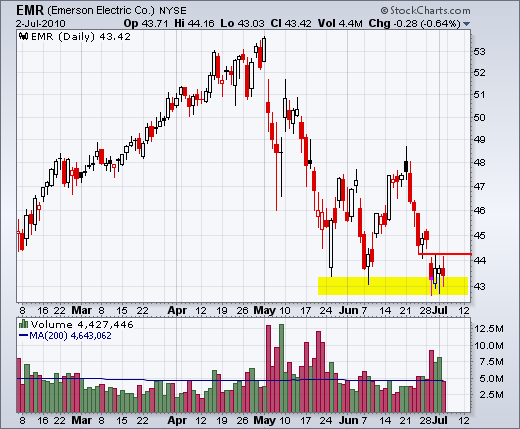
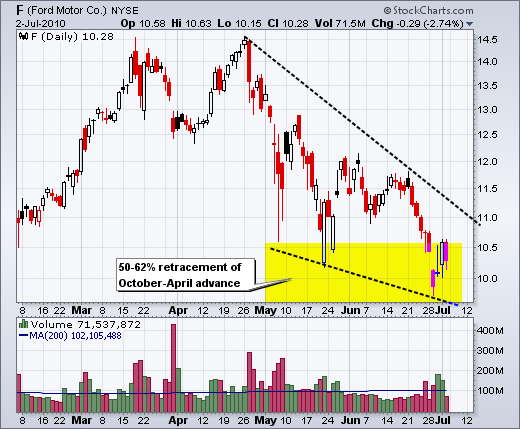
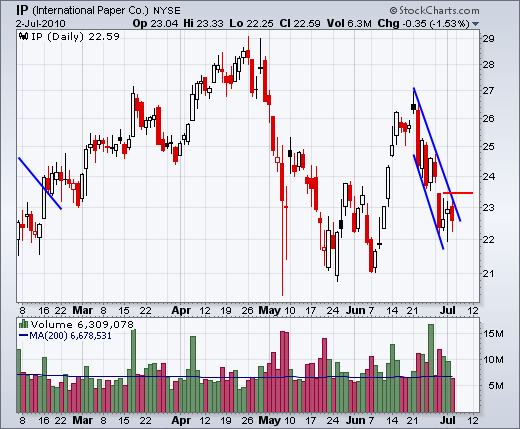
Charts of Interest: ATVI, EMR, F, IP, JCI, LUB, MAN
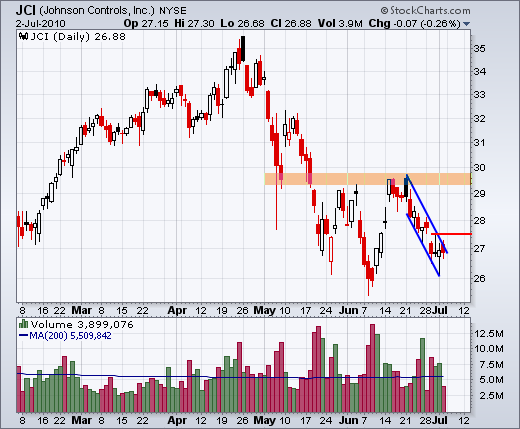
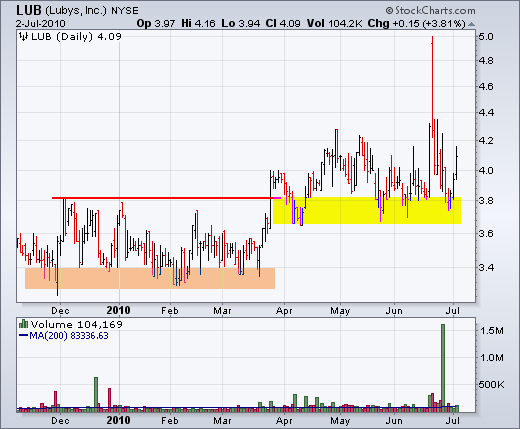
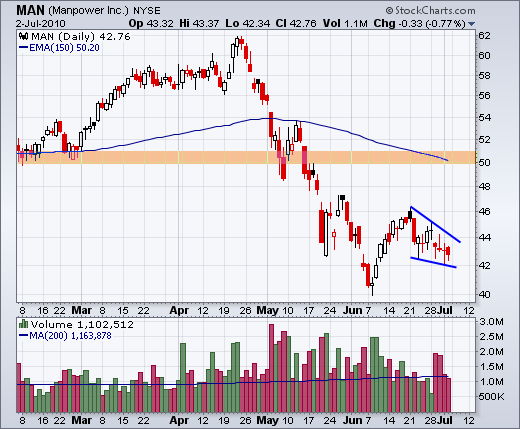
This commentary and charts-of-interest are designed to stimulate thinking. This analysis is not a recommendation to buy, sell, hold or sell short any security (stock ETF or otherwise). We all need to think for ourselves when it comes to trading our own accounts. First, it is the only way to really learn. Second, we are the only ones responsible for our decisions. Think of these charts as food for further analysis. Before making a trade, it is important to have a plan. Plan the trade and trade the plan. Among other things, this includes setting a trigger level, a target area and a stop-loss level. It is also important to plan for three possible price movements: advance, decline or sideways. Have a plan for all three scenarios BEFORE making the trade. Consider possible holding times. And finally, look at overall market conditions and sector/industry performance.


