Charts of Interest: ADBE, AGU, DE, HSIC, MDT
ADBE Forms Falling Flag after Surge.
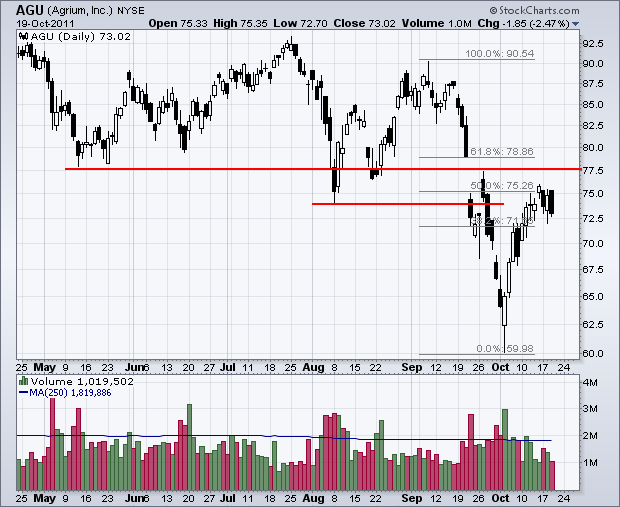
AGU Forms Bearish Engulfing in Resistance Zone.
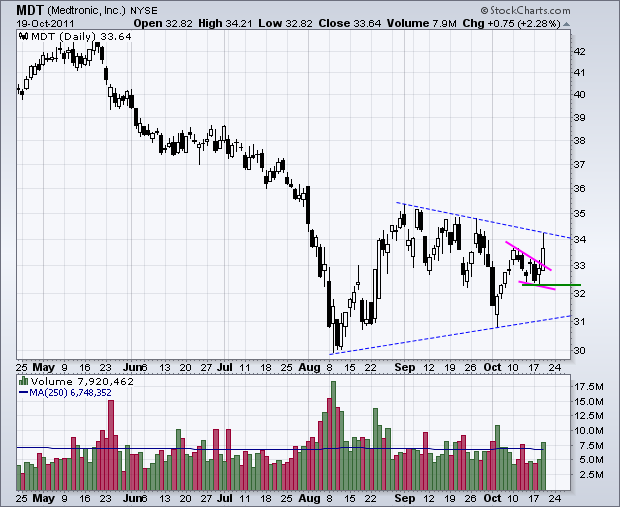
MDT Breaks Flag/Wedge Resistance with Volume.
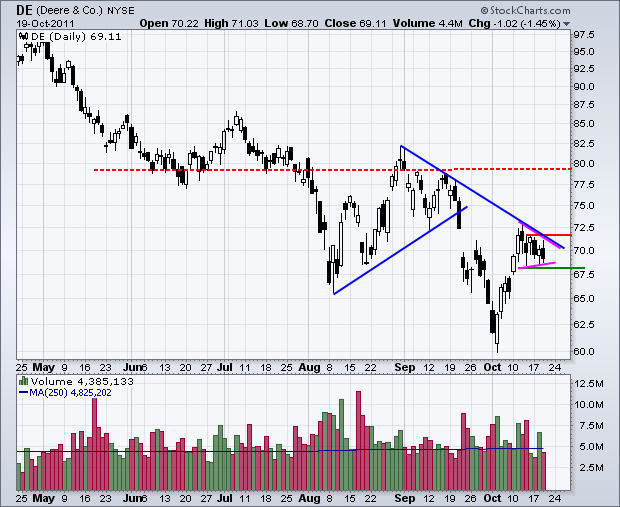
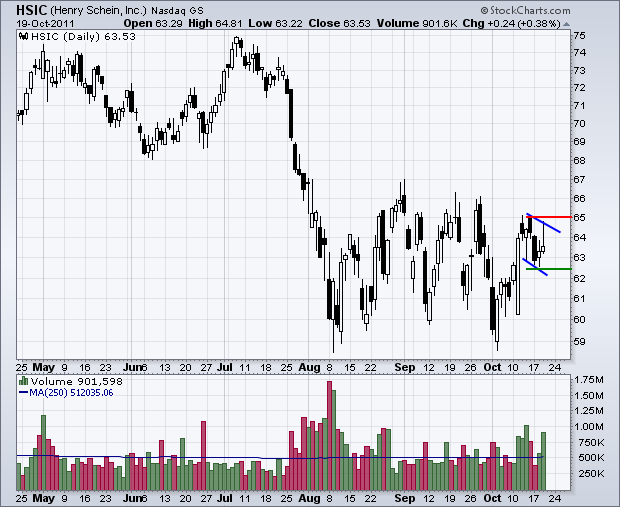
Plus DE and HSIC
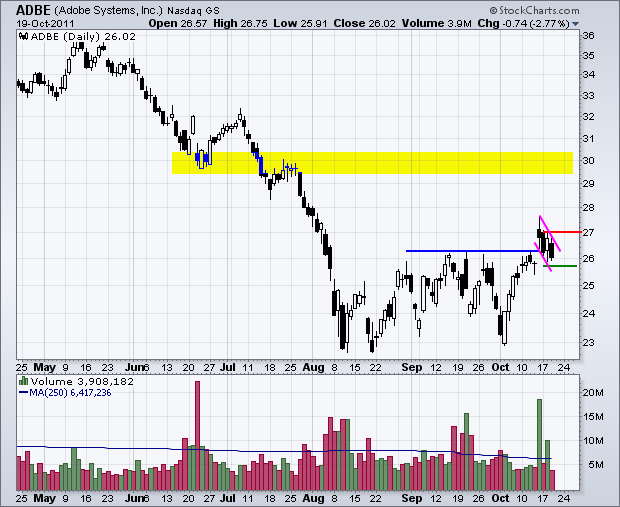
ADBE Forms Falling Flag after Surge.
AGU Forms Bearish Engulfing in Resistance Zone.
MDT Breaks Flag/Wedge Resistance with Volume.
Plus DE and HSIC


Arthur is Chief Technical Strategist at TrendInvestorPro.com. Focused primarily on US equities and ETFs, his systematic approach of identifying trend, finding signals within and setting key price levels has made him an industry-leading technician. Learn More


Before We Dive In… The Chikou Span is arguably the most overlooked, most underestimated, and most underutilized part of the Ichimoku Cloud. At first glance, it doesn’t look like much. It simply takes today’s closing price and plots it 26 periods back. If you’re focused on what’... READ MORE


Market breadth is driving stocks as macro data returns. SCTR, BPI, and moving averages reveal where leadership is forming.... READ MORE


Martin takes a look at some important signs that suggest the Real Estate sector has reached the end of a corrective period and could be poised for a major breakout.... READ MORE


Market breadth is driving stocks as macro data returns. SCTR, BPI, and moving averages reveal where leadership is forming.... READ MORE


The Dow Jones Industrial Average and Dow Jones Transportation Average notched record closes, indicating that economic conditions are strong. Even the S&P 500 and XLK bounced off key support levels. Does this mean we're out of the woods? Find out here.... READ MORE


As volatility picks up, the S&P 500 sits in a crucial neutral zone. Dave Keller, CMT, uses probabilistic analysis to outline four possible paths for the index into late March—from a renewed bull run to a deeper correction—helping investors prepare for multiple outcomes.... READ MORE