DIA Forms Bearish Engulfing - GLD Breaks Resistance
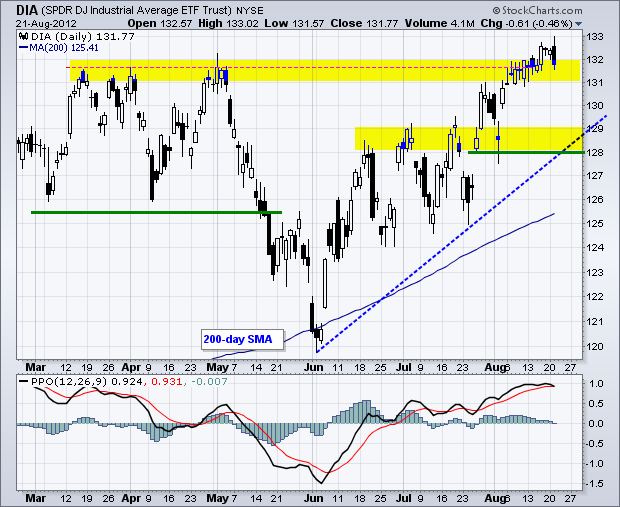
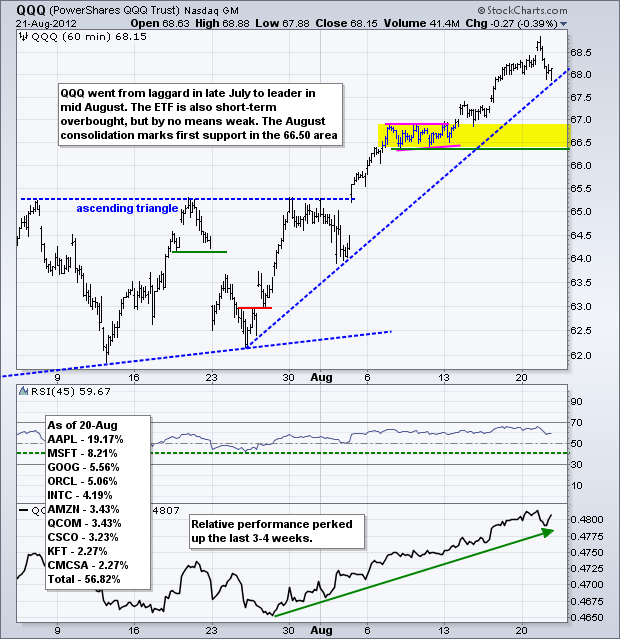
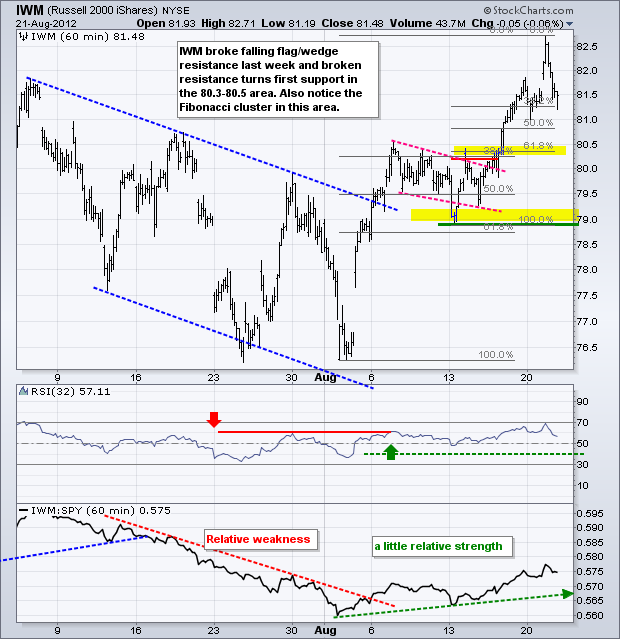
With the old pop and drop on Tuesday, a number of bearish engulfing patterns formed on the price charts. DIA, QQQ and SPY all formed bearish engulfing patterns. With stocks overbought to begin the week, these bearish engulfing patterns could foreshadow a short-term consolidation or pullback. Keep in mind that these patterns are short-term and a pullback-consolidation at this stage would be healthy for the medium-term uptrend.
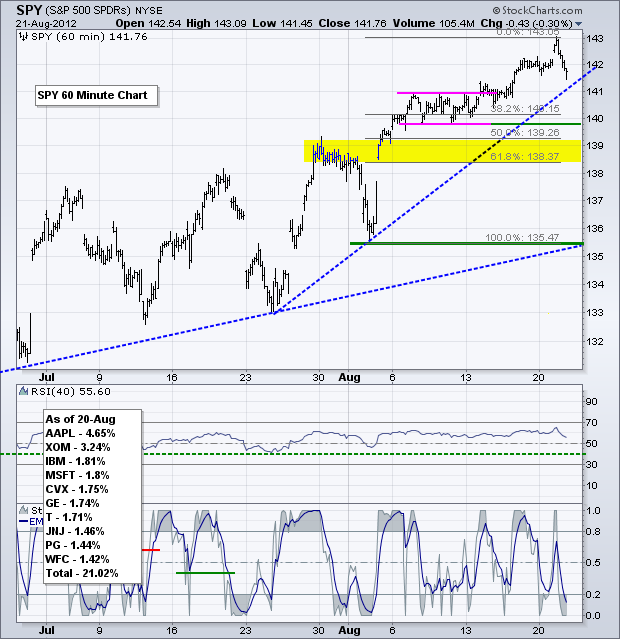
Picking support levels for a pullback is a challenge. First, the medium-term trend remains up and could override a short-term correction at any time. Second, there are several levels worth considering for short-term support. On the SPY chart, the consolidation during the second week of August marks support in the 140 area. I will use this level for my base case. A deeper pullback could extend to the 138.5-139 area. Broken resistance and the 50-61.80% retracement zone mark support here. Also notice that RSI is expected to find support in the 40-50 zone.
**************************************************************************
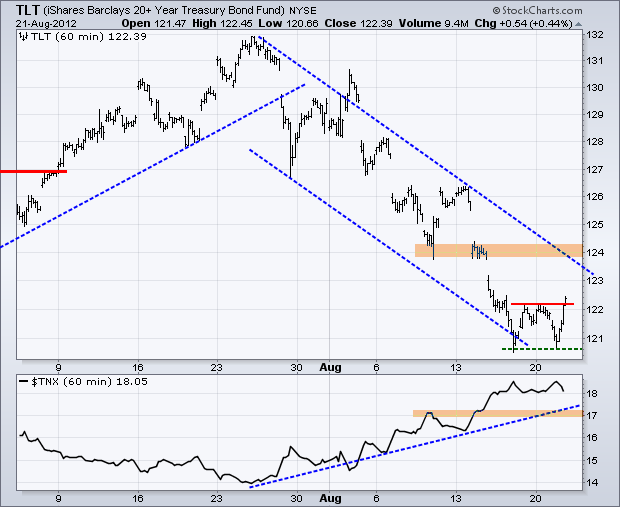
Treasuries were not sure what to do on Tuesday. Strength in the Euro favors the risk-on trade, which is bearish for treasuries. However, weakness in the stock market benefited treasuries because they are negatively correlated with stocks. Chartists should defer to the actual price chart when rational reasoning fails. The 20+ Year T-Bond ETF (TLT) established support with two bounces and then broke resistance with a surge above 122. An oversold bounce could be materializing with the first upside target around 124. Further strength in TLT would be negative for stocks.
**************************************************************************
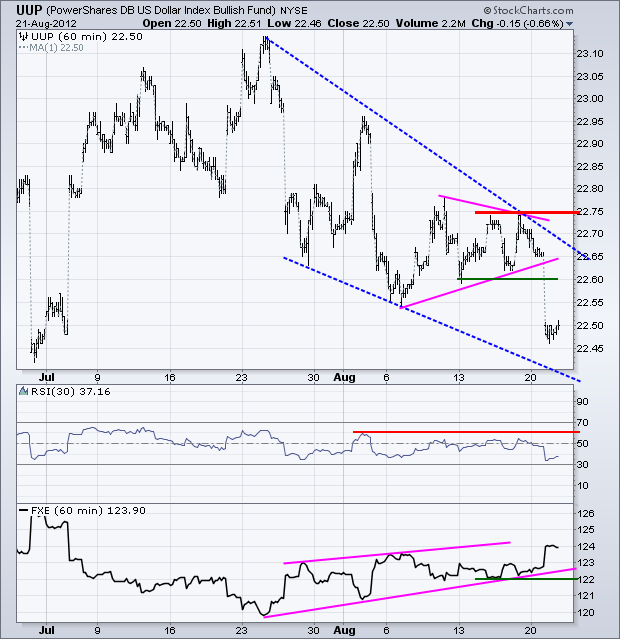
Positive rumblings from Germany lifted the Euro on Tuesday. The US Dollar Fund (UUP) broke triangle support and is now testing the late June low. Since peaking in late July, UUP formed a series of falling peaks and troughs. Last week's peaks now mark key resistance at 22.75. RSI resistance is set at 60 and FXE support at 122.
**************************************************************************
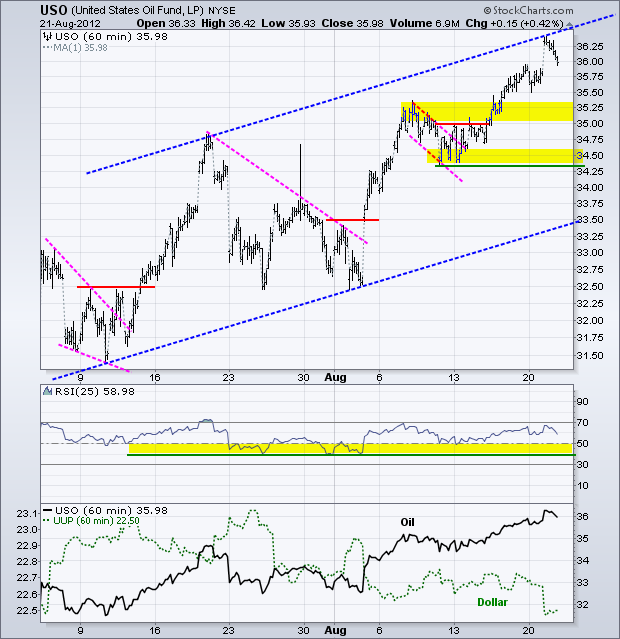
Oil followed the stock market with a pop and drop on Tuesday. The US Oil Fund (USO) opened near the upper trend line of a rising channel and then moved below 36 by the close. After a run from 34.5 to 36.25 in seven days, the ETF is a bit overbought and ripe for a corrective period as well. Broken resistance levels just above 35 turn into the first support levels to watch. Key support remains at 34.25 and RSI support at 40.
**************************************************************************
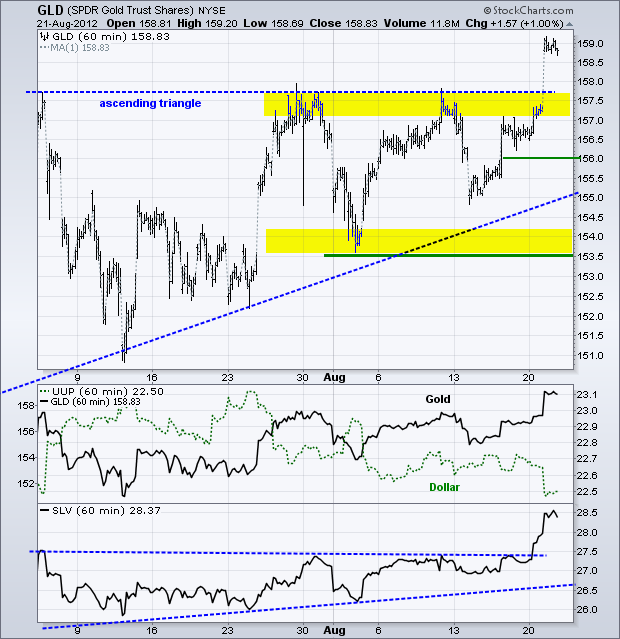
A plunge in the Dollar lifted gold as the Gold SPDR (GLD) broke above resistance. This breakout is a long time coming and broken resistance turns into the first support zone. A strong breakout should hold. I am going to give GLD a little buffer and mark first support at 156. A move back below this level would invalidate the breakout. Elsewhere, the Silver Trust (SLV) led GLD with a breakout on Monday.
**************************************************************************
Key Reports and Events:
Wed - Aug 22 - 07:00 - MBA Mortgage Index
Wed - Aug 22 - 10:00 - Existing Home Sales
Wed - Aug 22 - 10:30 - Crude Inventories
Thu - Aug 23 - 08:30 - Hollande & Merkel Meet in Berlin
Thu - Aug 23 - 08:30 - Initial Claims
Thu - Aug 23 - 10:00 - New Home Sales
Fri - Aug 24 - 08:30 - Samaras & Merkel Meet in Berlin
Fri - Aug 24 - 08:30 - Durable Orders
Sat - Aug 25 - 08:30 - Samaras & Hollande Meet in Paris
Fri - Aug 31 - 09:00 - Jackson Hole Central Bank Symposium
Tue - Sep 11 - 09:00 - Troika to Greece
Wed - Sep 12 - 09:00 - German Constitutional Court Ruling
Charts of Interest: Tuesday and Thursday
This commentary and charts-of-interest are designed to stimulate thinking. This analysis is not a recommendation to buy, sell, hold or sell short any security (stock ETF or otherwise). We all need to think for ourselves when it comes to trading our own accounts. First, it is the only way to really learn. Second, we are the only ones responsible for our decisions. Think of these charts as food for further analysis. Before making a trade, it is important to have a plan. Plan the trade and trade the plan. Among other things, this includes setting a trigger level, a target area and a stop-loss level. It is also important to plan for three possible price movements: advance, decline or sideways. Have a plan for all three scenarios BEFORE making the trade. Consider possible holding times. And finally, look at overall market conditions and sector/industry performance.


