MEMBERS ONLY
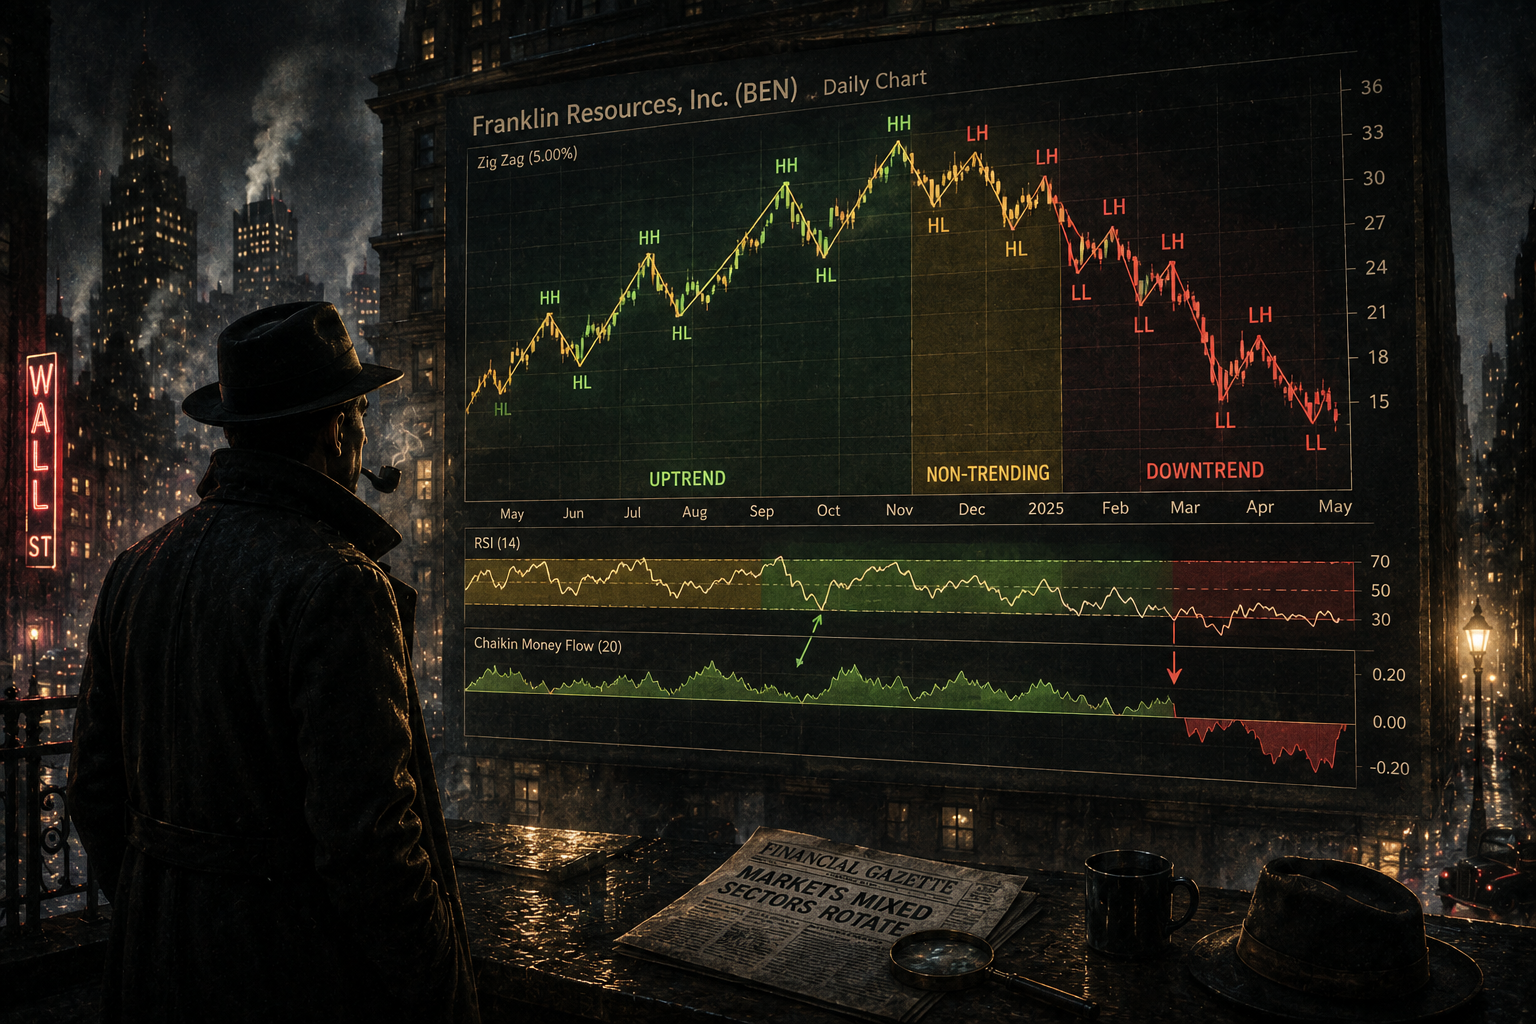
StockCharts Insider: Swing Charting and the Hidden Architecture of Trends

by Karl Montevirgen,
The StockCharts Insider
Before We Dive In…
Swing charting is one of the models featured in ChartSchool’s Trading Strategies & Models page. It’s a simple concept. But its simplicity is comparable to the bare foundations of an elaborate building. No matter how detailed and ornate a structure, if the foundation is...
READ MORE
MEMBERS ONLY

The Hindenburg Omen Is Sounding Again. Should Investors Be Concerned?

by David Keller,
President and Chief Strategist, Sierra Alpha Research
A second Hindenburg Omen confirmation has emerged as market breadth weakens beneath new highs in the S&P 500 and Nasdaq. Dave Keller, CMT, explains why the signal should be viewed as an early warning sign, not a prediction, and how investors can prepare for rising risk....
READ MORE
MEMBERS ONLY

Too Much AI in EM? Emerging Markets Investors Face a Key Decision
AI gains have influenced rallies in emerging market ETFs such as EEM and IEMG. Technical signals indicate that the upside in these ETFs may be ready for a pause. But this less volatile ETF could still have more upside....
READ MORE
MEMBERS ONLY

The Importance of Richard D. Wyckoff‘s Composite Operator

by Bruce Fraser,
Industry-leading "Wyckoffian"
Bruce explains the Wyckoffian notion of the Composite Operator, including what it is, how it is integral to the Wyckoffian trading philosophy, and how DLTR recently exemplified C.O. Accumulation in action....
READ MORE
MEMBERS ONLY

The Market Still Looks Bullish — But Something Changed

by Tom Bowley,
Chief Market Strategist, EarningsBeats.com
Technology stocks surged and growth continued leading the market, but some key leadership trends weakened late in the week. Tom Bowley explains what changed, what he’s watching, and why he’s still not turning bearish....
READ MORE
MEMBERS ONLY
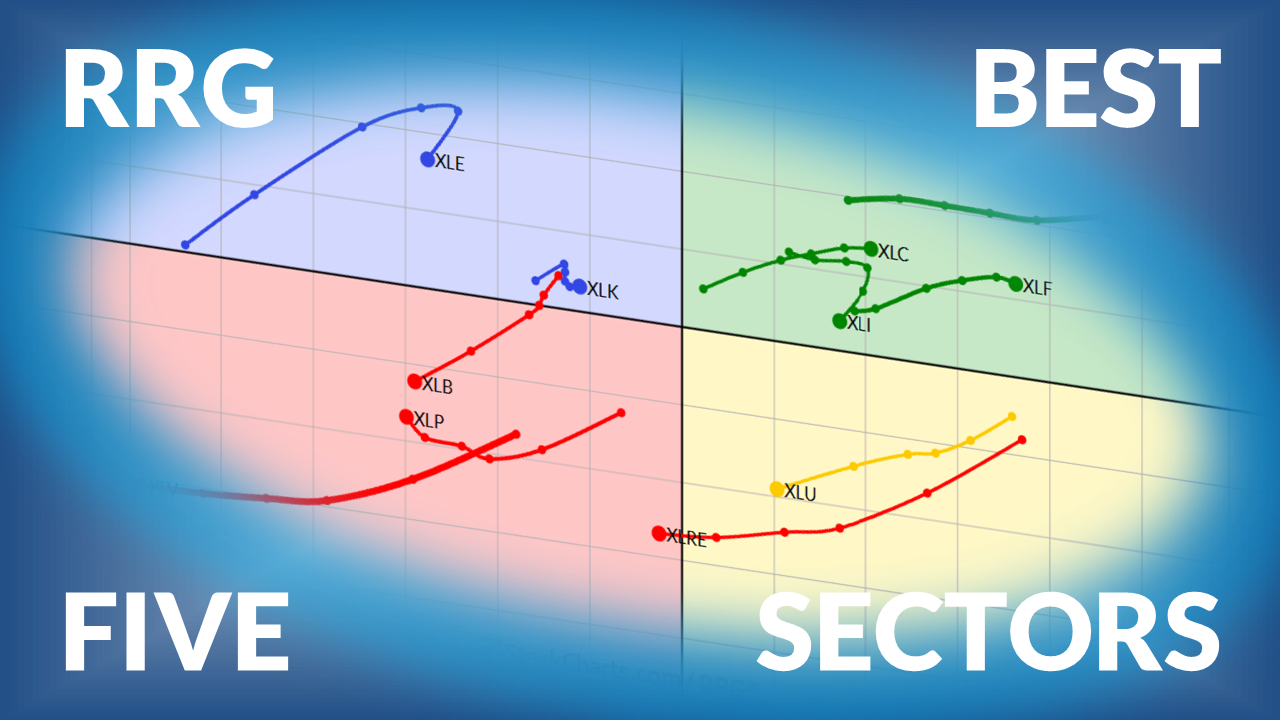
The Best Five Sectors This Week #68

by Julius de Kempenaer,
Senior Technical Analyst, StockCharts.com
Julius presents his weekly update on US sector rotation, using Relative Rotation Graphs, with Technology now leading the rankings and real estate entering the top five....
READ MORE
MEMBERS ONLY
These Sectors Could Be Next in the Rotation

by Joe Rabil,
President, Rabil Stock Research
In this video, Joe Rabil highlights a key sentiment warning signal and explains why several sectors may be next in the rotation. He reviews relative strength, momentum, and technical setups that could soon become much more important....
READ MORE
MEMBERS ONLY

Bitcoin Eyes Crucial Support: What If It Fails?

by Martin Pring,
President, Pring Research
Could Bitcoin provide a sign that the bear market is over? Martin takes a look at the $BTCUSD chart to examine what it means if Bitcoin breaks support -- and also what it means if it doesn't....
READ MORE
MEMBERS ONLY

Here's Why Market Rotation Matters More Than Ever

by Frank Cappelleri,
Founder & President, CappThesis, LLC
The S&P 500 keeps hitting bullish targets, but fewer stocks are driving the rally. Frank Cappelleri explains why broader participation may be needed and where leadership could emerge next....
READ MORE
MEMBERS ONLY

The AI Rally Left Industrials Behind. Here’s Why That May Not Last
Though industrials have lagged the S&P 500 this year, technicals suggest a trend reversal in the works. Mike Zaccardi explains why looking beyond AI trades may prove rewarding....
READ MORE
MEMBERS ONLY

These Fibonacci Levels Could Define Your Next Trade
by David Keller,
President and Chief Strategist, Sierra Alpha Research
Dave Keller explains how Fibonacci retracements can help identify support, resistance, price targets, and risk management levels. Using examples from MSFT, LULU, and AT&T, he shows when Fibonacci analysis is most effective and how traders use these key levels to plan their next move....
READ MORE
MEMBERS ONLY

Week Ahead: MSCI Rebalance Inflicts Technical Damage; Drags Resistance Down To These Levels

by Milan Vaishnav,
Founder and Technical Analyst, EquityResearch.asia and ChartWizard.ae
The Nifty closed near the lower end of its weekly range, mainly due to MSCI rebalancing. Milan Vaishnav analyzes the Nifty and shows why it's likely the index could trade within a consolidation zone....
READ MORE
MEMBERS ONLY
Nine Straight Up Weeks: What This Market Is Really Telling Us

by Jayanthi Gopalakrishnan,
Director of Site Content, StockCharts.com
It was another stellar week and month for stocks.
How stellar? Just head over to the Market Summary page, switch to the monthly timeframe, and look at the gains in the Equities panel. The only group in the red was Dow Utilities. Even more impressive is the Weekly Streak column:...
READ MORE
MEMBERS ONLY

AI Is Reaching New Corners of the Market

by Mary Ellen McGonagle,
President, MEM Investment Research
AI-driven market leadership is expanding beyond software and semiconductors. Mary Ellen McGonagle highlights stocks and sectors benefiting from the next phase of the AI trade....
READ MORE
MEMBERS ONLY
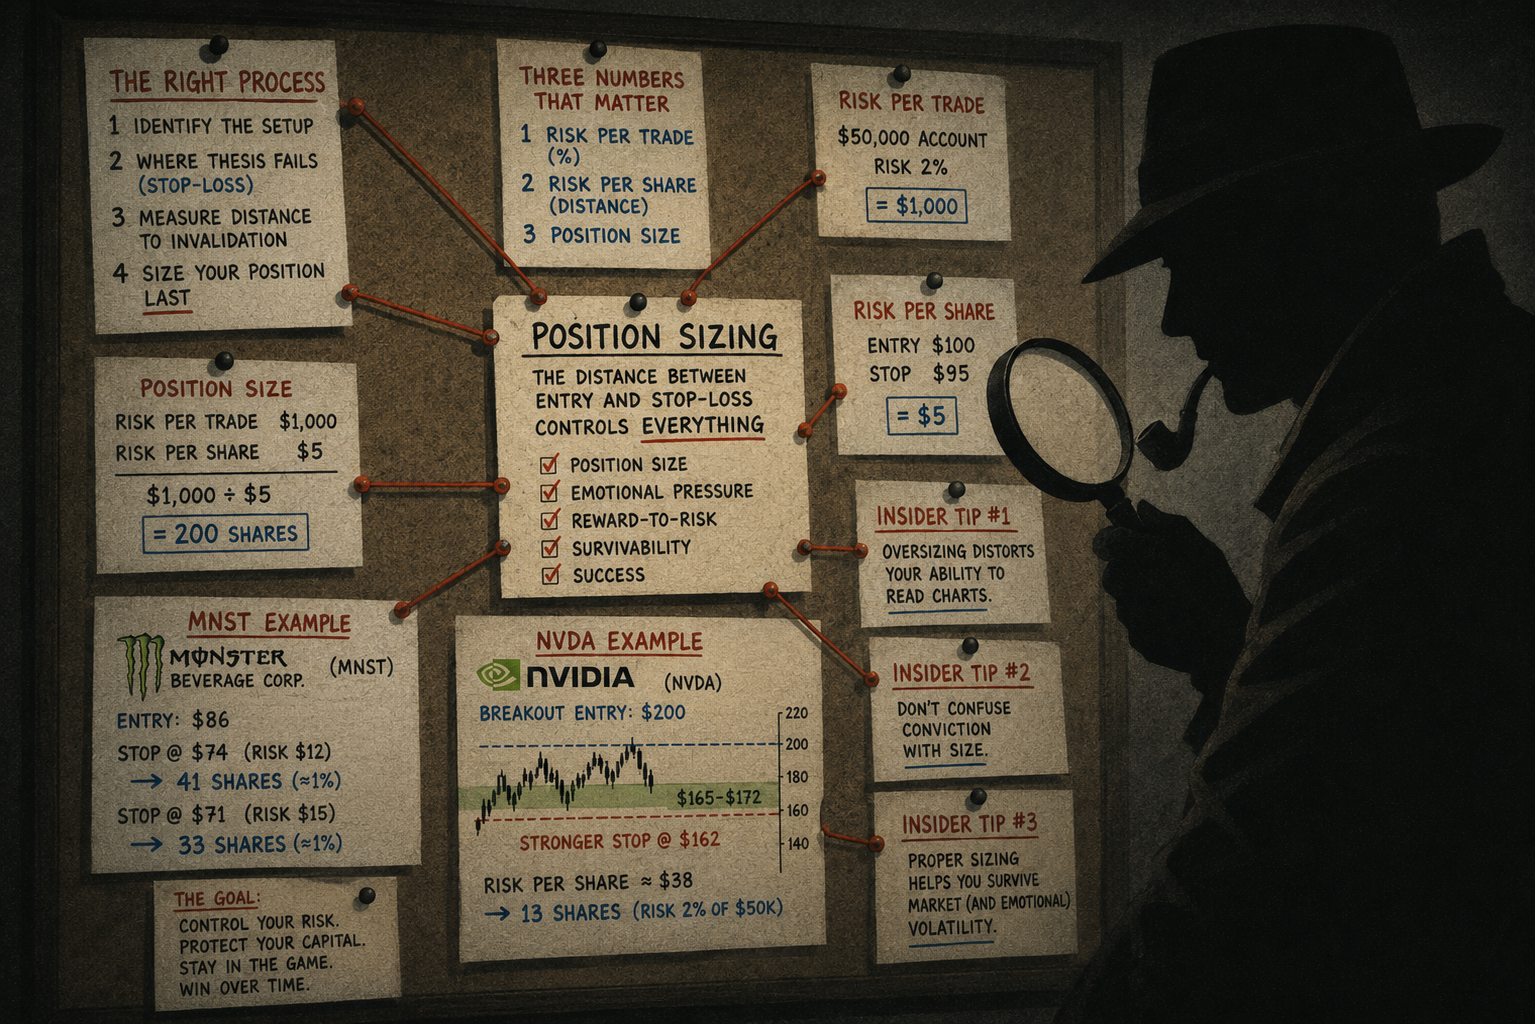
StockCharts Insider: Why Position Sizing Sometimes Matters More Than Stock Picking
by Karl Montevirgen,
The StockCharts Insider
Before We Dive In…
You invested a lot of money into a bad stock, and you realized it too late. It plunged, and you've taken a huge loss. So, later, you buy a sizable position in a much stronger company. It pulls back, as all stocks do. You...
READ MORE
MEMBERS ONLY

The Breakout Parade within Tech — Cloud, Cybersecurity, and Software: What's Next?

by Arthur Hill,
Chief Technical Strategist, TrendInvestorPro.com
Technology stocks are breaking out with strong follow-through. Arthur Hill analyzes charts of the cybersecurity, software, and Fintech ETFs and shows that they are displaying healthy breakout signals....
READ MORE
MEMBERS ONLY
These Warning Signs Keep Growing — But Tom Isn’t Bearish
by Tom Bowley,
Chief Market Strategist, EarningsBeats.com
Negative divergences and bearish warning signs are starting to appear, but Tom Bowley still sees a healthy bull market, and explains why growth leadership and risk-on signals continue to outweigh the concerns....
READ MORE
MEMBERS ONLY

Are Warning Signs Emerging Beneath the Surface of This Bull Market?
by David Keller,
President and Chief Strategist, Sierra Alpha Research
The S&P 500 remains in a strong uptrend, but two notable breadth indicators are flashing caution signals. Dave Keller, CMT, examines the Hindenburg Omen and Titanic Syndrome to assess whether weakening participation beneath the surface could signal a late-stage bull market environment....
READ MORE
MEMBERS ONLY

The Best Five Sectors This Week #67
by Julius de Kempenaer,
Senior Technical Analyst, StockCharts.com
Julius de Kempenaer presents his weekly update on US S&P 500 sector rotation, using Relative Rotation Graphs, for the week of May 25, 2026....
READ MORE
MEMBERS ONLY

Our Super Bowley Fantasy DRAFTs Are Proving One Thing
by Tom Bowley,
Chief Market Strategist, EarningsBeats.com
Get a behind-the-scenes look at how technical analysts set up their game plan for Tom's Super Bowley Fantasy Stock Draft. Discover how they analyze the overall market, the strategies they follow, and how they pick sectors and stocks that will outperform the market....
READ MORE
MEMBERS ONLY

How a Strong Uptrend is REALLY Formed
by Frank Cappelleri,
Founder & President, CappThesis, LLC
Since the March lows, the S&P 500 has pushed higher with multiple bullish pattern breakouts. Frank presents an analysis of the S&P 500, oil and gas exploration, precious metals, and bitcoin....
READ MORE
MEMBERS ONLY

The Summer Market Setup Is Here. Oil, Bonds, and the Dollar Hold the Key
So far, 2026 has been shaped by geopolitical upheavals, stellar earnings, and mini booms and busts. As we enter the summer months, investors should monitor the broad action and watch intermarket relationships between bond yields, crypto, precious metals, and oil. ...
READ MORE
MEMBERS ONLY

Record Highs, Fading Momentum: Is the S&P 500 Due For a Pause?
by Jayanthi Gopalakrishnan,
Director of Site Content, StockCharts.com
S&P 500, Nasdaq, and Dow close at record highs, but momentum is starting to fade. All eyes are on crude oil as investors focus on U.S.-Iran headlines. ...
READ MORE
MEMBERS ONLY
Warning Signs for Stocks: The Hindenburg Omen and Titanic Syndrome Explained
by David Keller,
President and Chief Strategist, Sierra Alpha Research
Dave Keller breaks down the Hindenburg Omen and Titanic Syndrome, two breadth indicators designed to identify conditions often seen near major market tops, and explains why recent signals deserve attention....
READ MORE
MEMBERS ONLY
New Stock Trends Are Starting to Emerge
by Joe Rabil,
President, Rabil Stock Research
Joe Rabil highlights emerging stock trends, sector rotation, and stocks showing improving relative strength after long periods of consolidation. He explains the setups, momentum signals, and trend changes he’s watching now....
READ MORE
MEMBERS ONLY

Finding Small Cap Breakouts as Breadth Improves

by Tony Zhang,
Chief Strategist, OptionsPlay
Tony Zhang shows how to find a defined-risk trade by scanning small-cap setups and ranking bulish options strategies....
READ MORE
MEMBERS ONLY

The Next Bullish Wave May Be Starting

by Larry Williams,
Veteran Investor and Author
Legendary trader Larry Williams returns with a timely update on where he believes the markets are headed next, explaining why market cycles, money flow, and seasonal patterns still point to higher stock prices in 2026....
READ MORE
MEMBERS ONLY

Space ETFs Are Soaring Ahead of the SpaceX IPO. Can the Rally Continue?
Ahead of SpaceX's anticipated IPO, several space-themed ETFs are seeing massive inflows, with NASA and UFO are displaying solid uptrends. Here's what you should be monitoring ahead of SPCX's debut. ...
READ MORE
MEMBERS ONLY

Week Ahead: NIFTY Stays Poised in the Coming Truncated Week
by Milan Vaishnav,
Founder and Technical Analyst, EquityResearch.asia and ChartWizard.ae
The Nifty 50 is range-bound, hovering below a key resistance zone. Milan Vaishnav analyzes the chart of the Nifty and suggests when investors should consider adding positions. He also analyzes the performance of the various sectors in the Indian stock market. ...
READ MORE
MEMBERS ONLY
These New Areas are Driving the Market Higher
by Mary Ellen McGonagle,
President, MEM Investment Research
Stock market leadership is broadening as falling yields and lower volatility bring new groups into this rally. Mary Ellen McGonagle shares where strength is emerging beyond AI and semiconductor stocks, and why healthcare, banks, retail, and other economically sensitive areas are starting to improve....
READ MORE
MEMBERS ONLY
A Better Way to Review the Market at Week’s End
by Jayanthi Gopalakrishnan,
Director of Site Content, StockCharts.com
The end of the week is the perfect time to step back, assess your portfolio holdings, and get a read on the overall stock market sentiment.
This week may have felt a bit uneventful. NVIDIA’s earnings failed to excite investors, consumer confidence came in weak, and there was still...
READ MORE
MEMBERS ONLY

The Stock Market Is Broadening Out: Three Charts Make the Case
by Mary Ellen McGonagle,
President, MEM Investment Research
Stock market breadth is expanding. Mary Ellen McGonagle looks at three market breadth indicators, which are showing a healthy expansion....
READ MORE
MEMBERS ONLY
Breadth Deteriorates: Is This a Threat or an Opportunity?
by Arthur Hill,
Chief Technical Strategist, TrendInvestorPro.com
Breadth in the S&P 500 and SPY is bullish, which means bullish outcomes are more likely than bearish ones. Arthur Hill analyzes market breadth in SPY and RSP and shows that the overall tone is bullish....
READ MORE
MEMBERS ONLY

StockCharts Insider: Turn Market News Into Actionable Setups
by Karl Montevirgen,
The StockCharts Insider
Before We Dive In…
Whether you trade for the short-term or long-term, the first thing you probably do every morning is check the headlines: CNBC, Bloomberg, Fox Business, or whatever suits you. We all do this, because markets react to information. And we don't want to be caught...
READ MORE
MEMBERS ONLY

Finding Breakouts in the Stealth Bull Market
by Tony Zhang,
Chief Strategist, OptionsPlay
Learn how StockCharts and OptionsPlay help traders find risk-defined opportunities like LUNR as market breadth expands into small caps and industrials....
READ MORE
MEMBERS ONLY

AI Stocks Are Still Driving the Rally, But Oil May Decide What’s Next
by Jayanthi Gopalakrishnan,
Director of Site Content, StockCharts.com
AI and quantum stocks rally as oil prices slide and IPO buzz builds. See what falling yields, semiconductor strength, and geopolitical headlines could mean for the market. ...
READ MORE
MEMBERS ONLY

The Market Just Pulled Back — Here’s Why
by Tom Bowley,
Chief Market Strategist, EarningsBeats.com
After weeks of relentless gains, the market finally pulled back—but Tom Bowley says it wasn’t random. He explains how options expiration, market maker positioning, and sentiment extremes helped trigger the reversal....
READ MORE
MEMBERS ONLY

Consumer Staples is Outperforming Again. Is It a Warning Sign for Stocks?
The Consumer Staples sector is quietly staging a rally in Q2. Investors should monitor the trends in XLP:SPY and the charts of Walmart and Costco. ...
READ MORE