XRT Breaks Wedge Resistance and XLY Hits New High
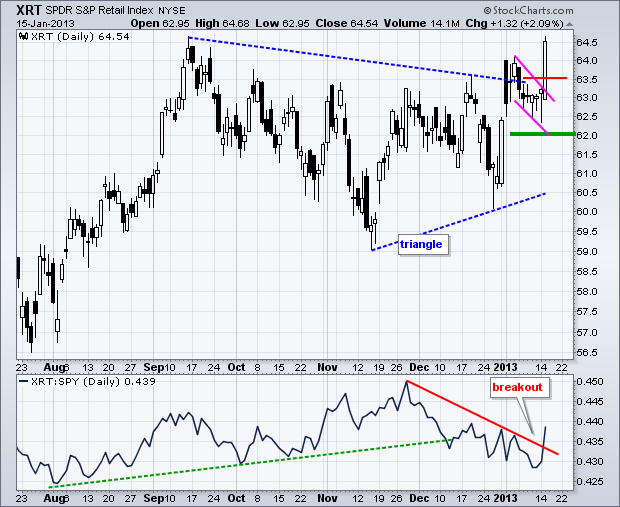
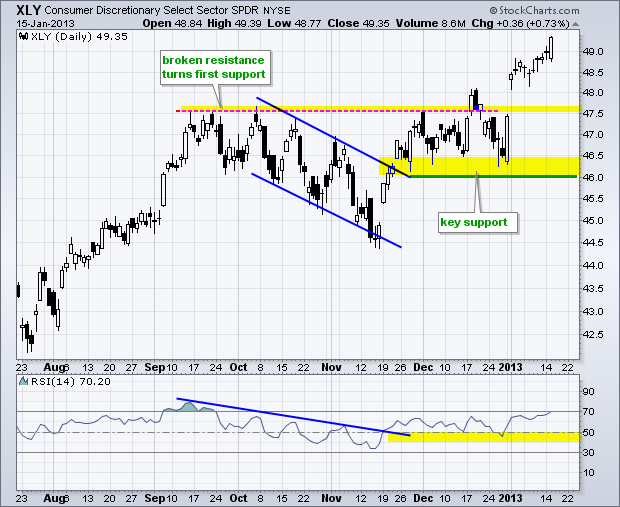
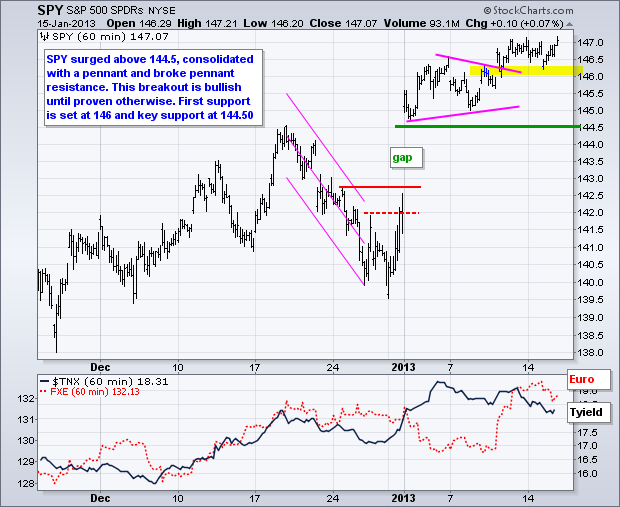
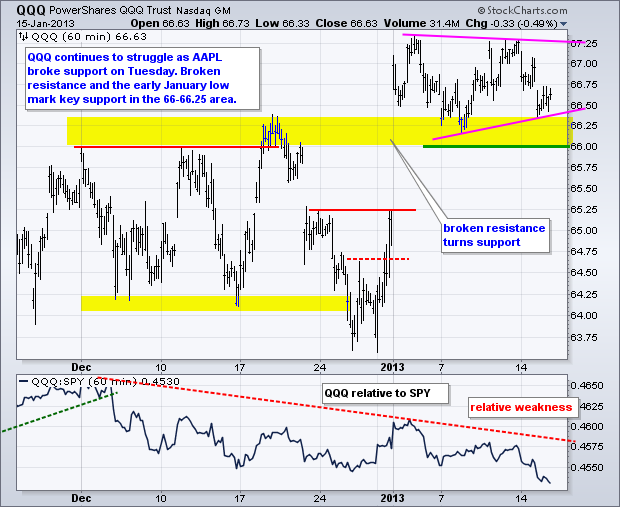
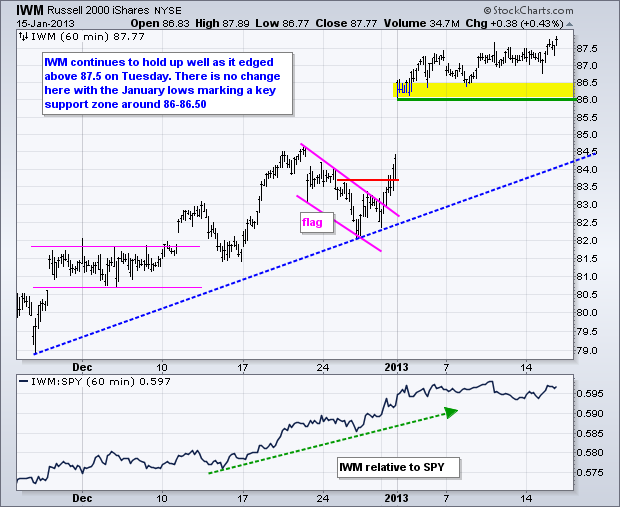
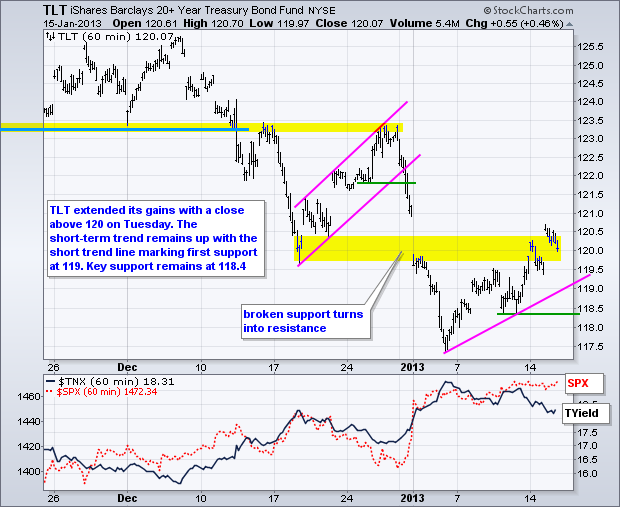
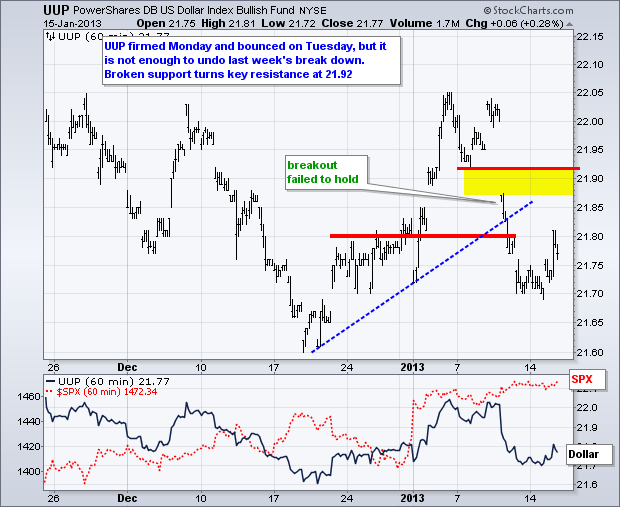
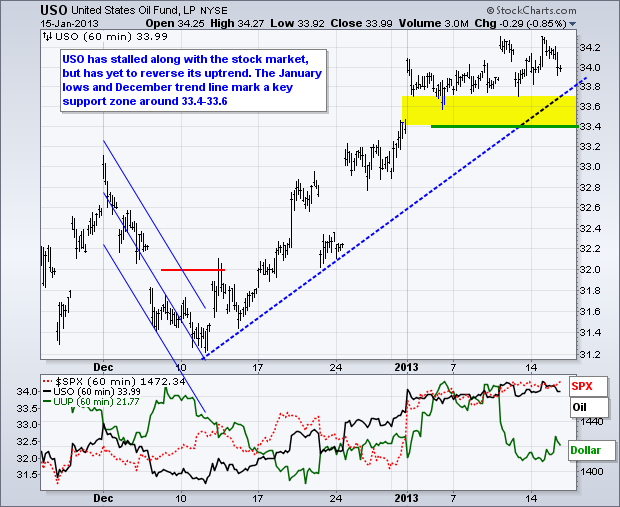
It is getting to be a familiar story. Stocks in general edged higher, but the Nasdaq 100 ETF (QQQ) edged lower because of weakness in Apple. AAPL broke support at 500 with a sharp decline on Tuesday. The company reports next Wednesday after the close. This is definitely one of the most anticipated reports in years, but don't forget that over 100 companies will also report earnings on Wednesday. Even though Apple weighs heavily in a number of market-capitalization weighted indices, I think the issues are company specific and the media coverage is excessive. Turning to matters that really matter, the Retail SPDR (XRT) broke wedge resistance with a huge move on Tuesday. This was in response to a better-than-expected retail sales report. Also note that the Consumer Discretionary SPDR (XLY) surges to a new 52-week highs. These are positive developments for the stock market overall.
**************************************************************************
**************************************************************************
**************************************************************************
**************************************************************************
**************************************************************************
Key Reports and Events:
Wed - Jan 16 - 07:00 - MBA Mortgage Index
Wed - Jan 16 - 08:30 - Consumer Price Index (CPI)
Wed - Jan 16 - 09:15 - Industrial Production
Wed - Jan 16 - 10:00 - NAHB Housing Market Index
Wed - Jan 16 - 10:30 - Oil Inventories
Wed - Jan 16 - 14:00 - Fed Beige Book
Thu - Jan 17 - 08:30 - Jobless Claims
Thu - Jan 17 - 08:30 - Housing Starts/Building Permits
Thu - Jan 17 - 10:00 - Philadelphia Fed
Thu - Jan 17 - 10:30 - Natural Gas Inventories
Fri - Jan 18 - 09:55 - Michigan Sentiment
Wed - Jan 23 - 16:30 - Apple Earnings
Charts of Interest: Tuesday and Thursday
This commentary and charts-of-interest are designed to stimulate thinking. This analysis is
not a recommendation to buy, sell, hold or sell short any security (stock ETF or otherwise).
We all need to think for ourselves when it comes to trading our own accounts. First, it is
the only way to really learn. Second, we are the only ones responsible for our decisions.
Think of these charts as food for further analysis. Before making a trade, it is important
to have a plan. Plan the trade and trade the plan. Among other things, this includes setting
a trigger level, a target area and a stop-loss level. It is also important to plan for three
possible price movements: advance, decline or sideways. Have a plan for all three scenarios
BEFORE making the trade. Consider possible holding times. And finally, look at overall market
conditions and sector/industry performance.


