Gold and GDX Break Down - USO Breaks Flag Resistance
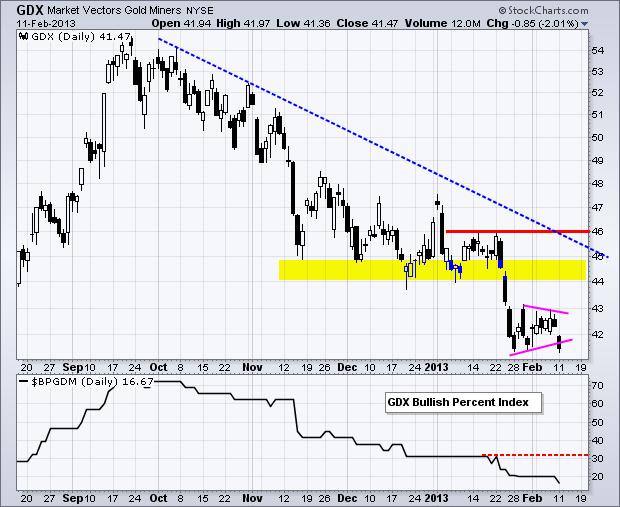
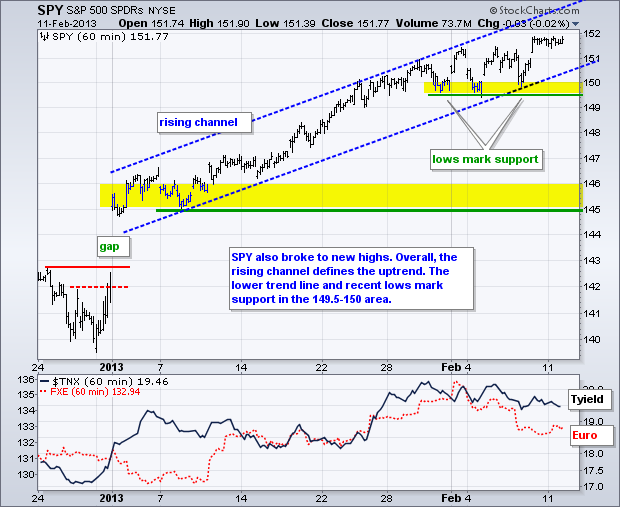
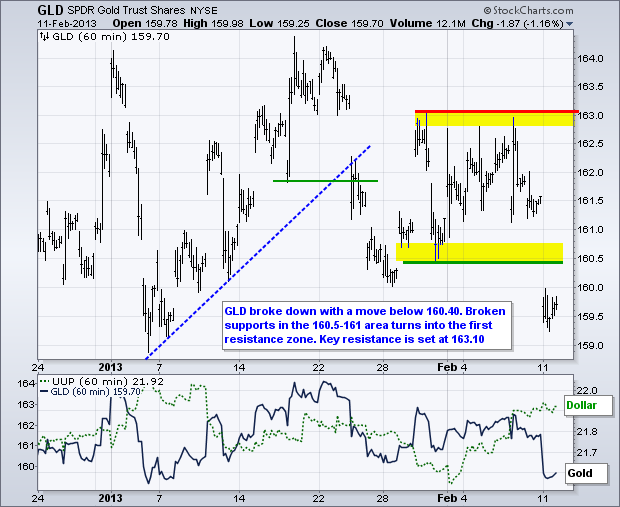
Stocks were mixed on Monday with the S&P 500 ETF (SPY) edging lower (.02%) and the S&P 500 Equal-Weight ETF (RSP) edging higher (.03%). Yes, it was a mixed, and dull, day. The sector SPDRs were also mixed and the moves were small. The Gold Miners ETF (GDX) was hit hard after gold broke below 1650. The chart below shows GDX breaking pennant support with a gap down on Monday. The February highs now mark first resistance. Even though a bounce of this level would be positive, it would not be enough to reverse the medium-term downtrend. The October trend line and mid January highs mark medium-term resistance at 46. Also notice that the Bullish Percent Index for GDX moved below 20% for the first time since August. This indicator may be oversold, but we need an upturn and break above 32% to reverse the downtrend.
**************************************************************************
**************************************************************************
**************************************************************************
**************************************************************************
**************************************************************************
Key Reports and Events:
Tue - Feb 12 - 10:00 - Tim Cook Speaks at Goldman Sachs Tech Conference
Tue - Feb 12 - 20:30 - State of the Union
Wed - Feb 13 - 07:00 - MBA Mortgage Index
Wed - Feb 13 - 08:30 - Retail Sales
Wed - Feb 13 - 10:00 - Business Inventories
Wed - Feb 13 - 10:30 - Oil Inventories
Thu - Feb 14 - 08:30 - Jobless Claims
Thu - Feb 14 - 10:30 - Natural Gas Inventories
Fri - Feb 15 - 08:30 - Empire State Manufacturing
Fri - Feb 15 - 09:15 - Industrial Production/Utilization
Fri - Feb 15 - 09:55 - Michigan Sentiment
Sun - Feb 24 - 10:00 - Italian Parliamentary Elections
Fri - Mar 01 - 23:59 - Sequester Takes Effect (unless...)
Wed - Mar 27 - 23:59 - Government Shut Down Deadline
Wed - May 15 - 23:59 - New Debt Ceiling Deadline
Charts of Interest: Tuesday and Thursday
This commentary and charts-of-interest are designed to stimulate thinking. This analysis is
not a recommendation to buy, sell, hold or sell short any security (stock ETF or otherwise).
We all need to think for ourselves when it comes to trading our own accounts. First, it is
the only way to really learn. Second, we are the only ones responsible for our decisions.
Think of these charts as food for further analysis. Before making a trade, it is important
to have a plan. Plan the trade and trade the plan. Among other things, this includes setting
a trigger level, a target area and a stop-loss level. It is also important to plan for three
possible price movements: advance, decline or sideways. Have a plan for all three scenarios
BEFORE making the trade. Consider possible holding times. And finally, look at overall market
conditions and sector/industry performance.


