Narrow Leadership Is a Concern, but the Bear Signal Has Yet To Trigger: Here's What To Watch
Key Takeaways
- Relative to 2024, new highs remain subdued and show narrow leadership.
- Despite narrow leadership, new highs are outpacing new lows as the High-Low Line rises.
- For clues on the next move, watch for new highs to expand above 60 or the High-Low Line to turn down.
The market is rising, but relatively few stocks are doing the heavy lifting. Will leadership broaden and extend this bull run, or will narrow leadership lead to weakness? Today's report will show indicators and levels to watch.
Chartists can use new highs and new lows to quantify leadership within the S&P 500 ($SPX) and time directional moves. High/Low data reflect relatively narrow leadership during the 2025 advance. Even so, new highs are still outpacing new lows and the High-Low Line is rising. The trouble starts when the High-Low Line turns down. TrendInvestorPro is watching this indicator and several others for signs of a correction.
The first indicator shows the S&P 500 new highs and lows as an up/down pair. New highs are positive (up), and new lows are negative (down). I have horizontal lines at +50 and -50, which represent 10% of the S&P 500. New highs exceeded 50 just once this year (July 23rd). The inability to exceed 50 regularly shows narrow leadership within the S&P 500.
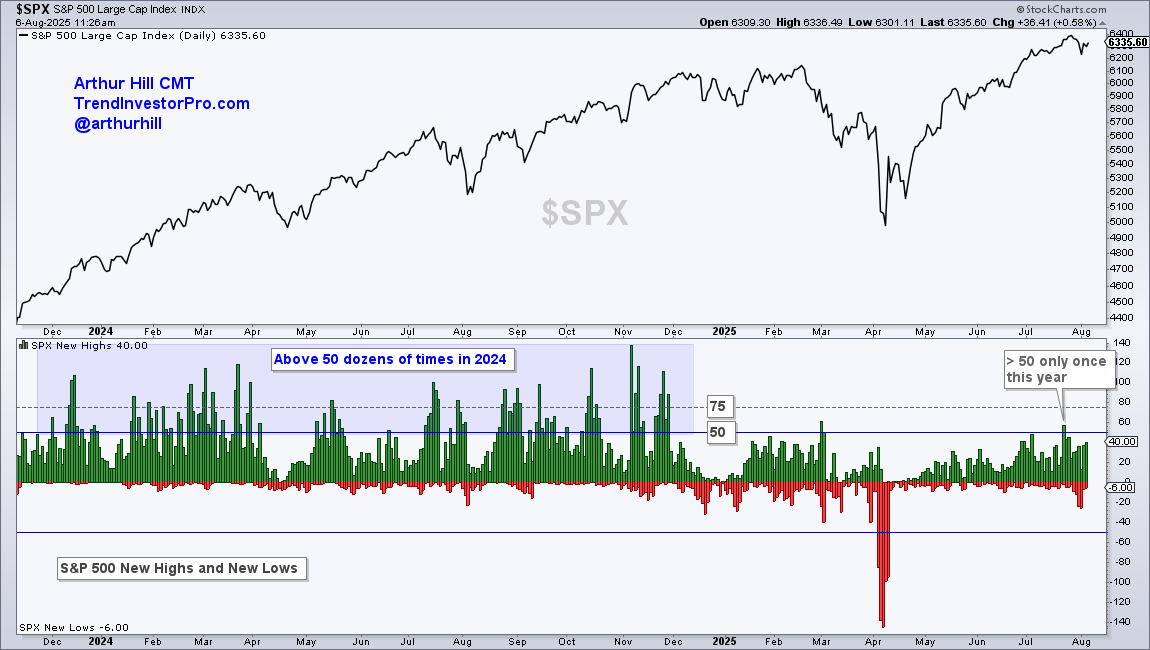
In contrast with 2025, the 2024 bull market showed broad leadership because new highs regularly exceeded 50. In fact, new highs exceeded 75 several times and 100 on a few occasions. It is much easier to trade during bull markets with broad leadership. Look for new highs to exceed 60 for signs of expanding leadership.
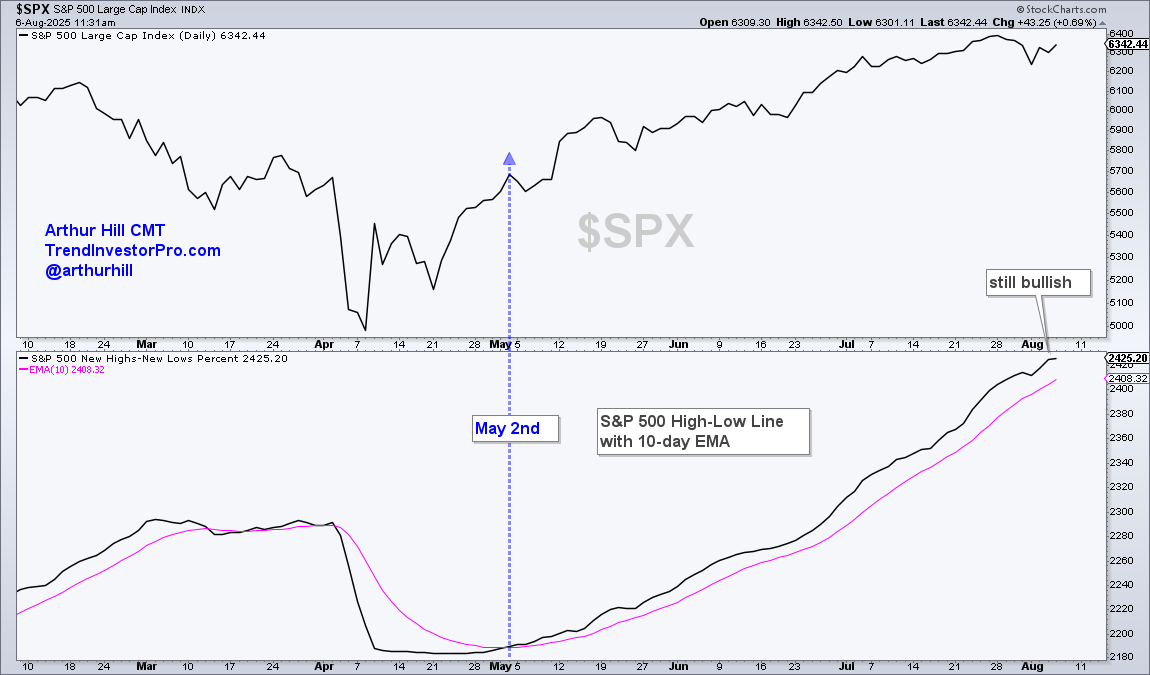
Despite narrow leadership, the cup is half full for the indicator and the S&P 500. The next chart shows the High-Low Line, which is a cumulative measure of daily net new highs (new highs less new lows). This line rises as long as new highs outpace new lows. It turned up on May 2nd with a cross above its 10-day EMA (pink line), and remains in an uptrend. The bulls have the edge until the High-Low Line turns down and breaks its 10-day EMA, which would mean new lows are outpacing new highs.
TrendInvestorPro recently posted reports and videos covering:
- A sentiment indicator signals excess and triggers bearish.
- An unusually large percentage of stocks are in downtrends.
- Bonds extend on breakout and high-yield ETFs break out.
- Tech ETFs trigger trailing stops and remain overextended.
Click here to learn about our subscriber bonuses and trial offer.


